
SQL Server Reporting Services Basics: Building SSRS Reports
SQL Server Reporting Services (SSRS) is a server-based reporting platform that allows us to create and manage a wide variety of different types of report, and deliver them in a range of formats. We can create basic reports containing tables and graphs, or more complex data visualizations, using charts, maps and sparklines. Our reports can draw their data from SQL Server databases, but also from other relational database such as Oracle, and other types of multi-dimensional or XML-based data sources such as SQL Server Analysis Services, Teradata, or Parallel Data Warehouse.
We can present our finished reports directly from the Reporting Services website, called Report Manager, or users can view them directly within their web- or Windows-based applications. End users can run reports on demand or schedule them as subscriptions. We can also install SSRS so that the reports run from SharePoint. This article is the first in a series that will provide in-depth coverage of the basics of report development with SSRS:
- Building SSRS Reports (this article) – covers the basics of SSRS, demonstrates how to build quick, simple reports, and will familiarize you with the basic Report Designer environment
- Customizing SSRS Reports (Part 2) – covers use of custom and aggregate functions, sub-reporting, the matrix control, drill-downs, and sorting.
- SSRS Visual Controls (Part 3) will take an in-depth look at the SSRS visual controls, notably the chart control.
- Deploying SSRS Reports (Part 4) walks you through deploying reports and the Report Builder tool
The report development examples in this series will work for SSRS 2008 R2 through 2012. Most of the examples will also work for 2008, and any I’ll call out any exceptions. If you are still using SQL Server 2005, please refer to Steve Joubert’s original SSRS series, upon which the example in this series are based.
SSRS through the ages
SSRS has been around for over 10 years, first shipping as an “add-on” for SQL Server 2000, and then fully integrated into SQL Server 2005. I first saw it demonstrated at the 2003 PASS Summit, and had the Beta version installed and running within a couple of days of getting back to work. Back in 2003, SSRS caused great excitement as it made available, for the first time, built-in reporting capabilities for SQL Server. If you owned SQL Server, you owned SSRS.
Since its integration into SQL Server 2005, Microsoft has made a number of improvements and added many new features. It had a big overhaul in 2008 and acquired a bunch of new features with 2008 R2 including:
- The tablix data region which allows us to convert a report area from a table to a matrix and back again
- Enhanced chart, and new gauge, data regions (thanks to the Dundas acquisition)
- Complete redesign of the Report Designer including a new Grouping Pane
- Formatting of text elements, not just at the textbox level
- Performance enhancements
- 2008 R2: KPIs, maps, sparklines, new functions, published Report Parts, and more
Since then, the basic features of the standard SSRS reporting tool haven’t changed. However, with SSRS 2012, Microsoft added Power View, providing a new way to create reports and geared towards business users. Power View is part of SSRS when installed in SharePoint integrated mode or as an add-in for Excel 2013. SQL Server 2014 was recently released, and there were no developer feature enhancements with this release.
SSRS Architecture
This series of articles focuses on the development of reports. Keep in mind that SSRS can be deployed to SharePoint, but this series of article only covers the native deployment architecture.
An SSRS deployment must be associated with a SQL Server instance. On the instance will be two databases, by default:
ReportServer– contains the report definitions, configuration, history, security of deployed reports and moreReportServerTempdb– much liketempdb, it is used as a workspace for building reports and doesn’t maintain any objects permanently.
We will also need a location for the Report Server Web Service, which can be on the same server as the databases, as in the simple deployment architecture shown in Figure 1, or on a different server. On whichever server we choose, we will have access to a Report Manager website that allows us to deploy and manage the reports. End users can run reports from Report Manager, create subscriptions, and publish their own reports if they have permission.
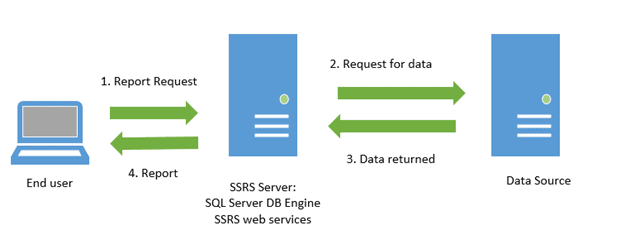
Figure 1
The end user sends an HTTP request for a report, providing any required parameters. The SSRS server finds the metadata of the report and sends a request for data to the data sources. The data returned by the data sources is merged with the report definition into a report. As the report is generated, it is returned to the client.
Installing and Configuring Reporting Services
There are many ways to design a Reporting Services deployment for your department or company, with SharePoint integrated mode gaining popularity. However, since this series is focused on report development, it will cover native mode only, and just enough about installation and configuration to help you get things set up on your development computer.
To follow along with this series of articles, you will need to install the development tool and set up the SSRS services. If the SQL Server media is not available, you can download an evaluation copy of SQL Server 2014.
SSRS installation
When running the SSRS installation, you will need to install the Database Engine and SQL Server Reporting Services in Native mode. It is easier to install both services at one time, because you can choose to have the installation process configure the SSRS services for you. If SSRS is installed later, or if you select not to configure it at installation, you will have to configure it manually. During installation, be sure to select these features:
- Database Engine
- SQL Server Reporting Services – Native (if installing 2008 R2, you’ll be asked on a subsequent screen to select the mode)
- Management Tools – Basic
- Management Tools – Complete
- Business Intelligence Development Tools or SQL Server Data Tools if available with the media you are using, which is dependent on the version
If given the choice, select Install and Configure.
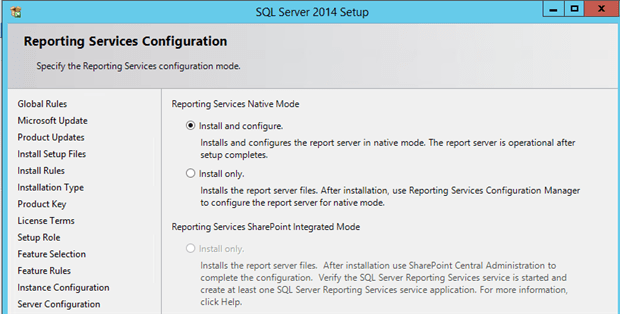
Figure 2
SSRS Development Tools
Early versions of SQL Server used Business Intelligence Development Studio (BIDS) as the SSRS development tool. However, starting with SQL Server 2012, you will use SQL Server Data Tools – Business Intelligence (SSDT-BI), which may or may not be on the SQL Server media, depending on the version. Each tool runs as an add-in for Visual Studio. If you do not have Visual Studio in place, the BIDS or SSDT-BI installation will install a Visual Studio shell.
Naming confusion?
Just to add a little confusion, there is also an add-in called SQL Server Data Tools for Visual Studio 2012. This is for database projects, not the BI tools that will allow you to create SSRS projects. It is not the option you want for SSRS development. You will also often see SSDT-BI abbreviated simply as SSDT.
The following table should help you navigate the options, understand the differences, and find the correct process for installing the development tool for your version of SQL Server.
|
SQL Server Version |
Development Tool |
Location of Media |
Documentation |
|
2008 R2 |
BIDS |
SQL Server installation media |
http://technet.microsoft.com/en-us/library/bb522791(v=sql.105).aspx. |
|
2012 option 1 |
SSDT-BI and VS 2010 |
SQL Server Installation media |
http://msdn.microsoft.com/en-us/library/ms143711(v=sql.110).aspx |
|
2012 option 2 |
SSDT-BI and VS2012 |
Download here http://www.microsoft.com/en-us/download/details.aspx?id=36843 |
http://msdn.microsoft.com/en-us/library/ms143711(v=sql.110).aspx |
|
2014 |
SSDT-BI and VS2012 |
Download here http://www.microsoft.com/en-us/download/details.aspx?id=36843
|
http://msdn.microsoft.com/en-us/library/ms143711(v=sql.120).aspx |
SSRS configuration
If you were unable to let the installation process configure SSRS for you, or are installing SSRS after the initial engine installation, or maybe you decided to configure SSRS on your own for fun, you will need to launch the Reporting Services Configuration Manager.
As discussed, we need to associate SSRS with a SQL Server instance, where it can create the reporting databases (ReportServer and ReportSereverTempdb). When prompted, select the instance name and click Connect.
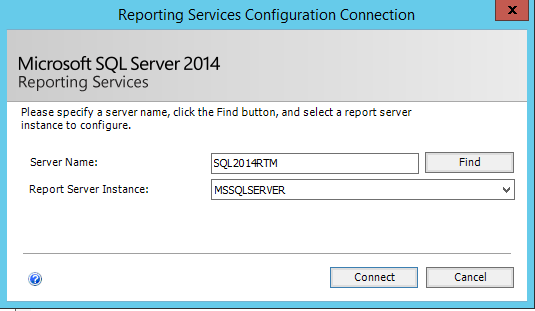
Figure 3
On the next screen, select the Database page on the left menu and click Change Database.
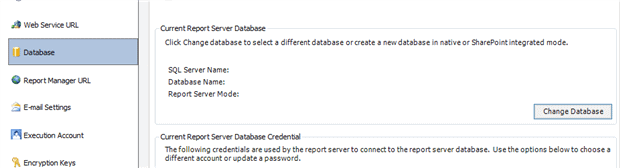
Figure 4
Select Create a new report server database and click Next. Enter the name of the SQL Server instance where you wish to create the reporting databases and click Next.
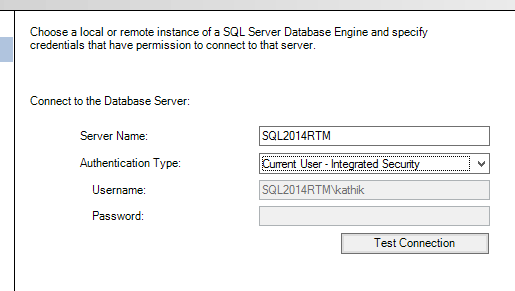
Figure 5
On the following screen, we configure the report databases. We can choose a different name from the default of ReportServer, if desired, but only do so if you have a good reason such as multiple instances of Reporting Services on the same server.
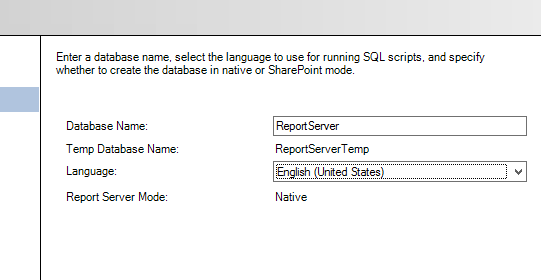
Figure 6
Continue clicking though the wizard and complete it. Once done, we need to configure the Report Server Web Service, so click the Web Service URL link.
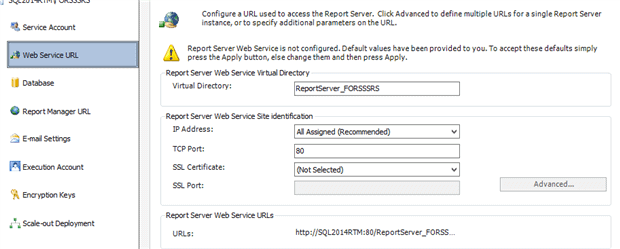
Figure 7
Accept the defaults and click Apply. Finally, we need to configure Report Manager, so click the Report Manager URL link. Again, accept the defaults and click Apply.
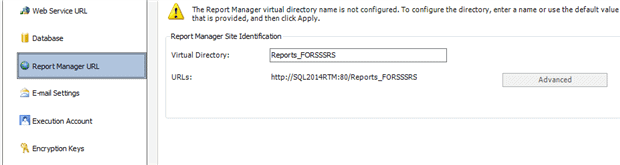
Figure 8
Click Exit to dismiss the Reporting Services Configuration Manager.
Creating Basic Reports
Now that we’re all set up, it’s time to start building our first report. We’re going to build a report based on a ReportingDemo database. If you want to follow along, building the example report from scratch then you’ll need to create the database using the ReportingDemoDatabaseScript.sql script or, alternatively, by restoring the ReportingDemo.bak file, both of which you will find in the code file for this article (see the Code Download link at the end of the article).
Alternatively, the download bundle also contains a copy of the completed SSRS project, FirstProject.
Using the Report Wizard
There are two ways to create SSRS projects within SSDT-BI. We can build the project manually, or we can get a kick start with the Report Wizard. Within the project we can create one or more reports. For example, we might have one project for all of the reports against a particular database, but that is not a requirement.
With the wizard, we can create only a relatively simple report, with one table or matrix data region containing text only.
Generally, the reports we create through the wizard won’t meet any but the most basic development requirements, but do not discount it entirely. It will allow us to get a report up and running with zero code and zero property setting, and the resulting report often makes a starting point for more complicated reports. Once we’ve created a report with the Report Wizard, we are free to modify it further as we wish, just as for a report we create from scratch, manually.
Our very first report project, FirstProject, demonstrates how to create a report with grouping levels including one of the dynamic features, collapsing and expanding sections. The report is essentially just a list of customers that we’ll group by state. The end result is not perfect, but it is a good start.
Open SSDT-BI and create a new project. Select the Report Server Project Wizard type. This will open up the New Project dialog. Create a new Reporting Services project called FirstProject. Click OK to start up the new report wizard. We can also kick off the wizard from within an existing project by right-clicking the Reports folder in Solution Explorer and selecting Add New Report.
The first dialog of note is Select the Data Source. Since this is our first data source, our only option is to create a new one.
Embedded versus Shared Data Sources
For the sake of this example, we will just create a new, embedded data source, which will be available only to the report in which it is embedded. However, a shared database source is available to all reports within a project, and once deployed, to any deployed report, from any project. If an existing shared data source exists, we should use it, and we have the option on this screen to make the current data source a shared data source. We’re going to set up a shared data source later in this article.
Select the New data source radio button and give the data source a name, usually referring to the database name, so in this case ReportingDemo. Leave the data source type as the default (Microsoft SQL Server).
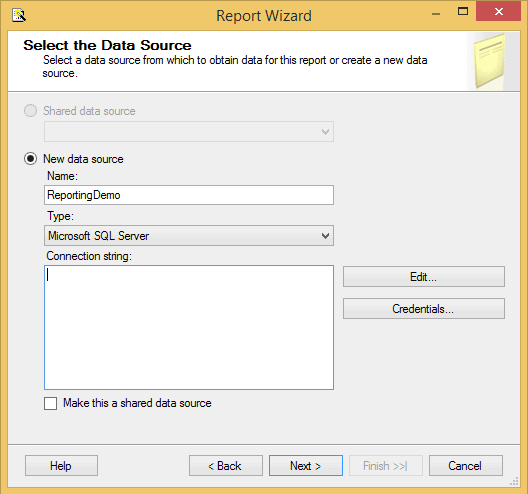
Figure 9
Click the Edit button to bring up the Connection Properties dialog. Enter the name of the SQL Server instance hosting the data source, in this case the ReportingDemo database. The default option is to log on using Windows Authentication. If you are using SQL Server Authentication, choose that setting, and enter the username and password. Finally, select ReportingDemo and make sure you test the connection before you click OK.
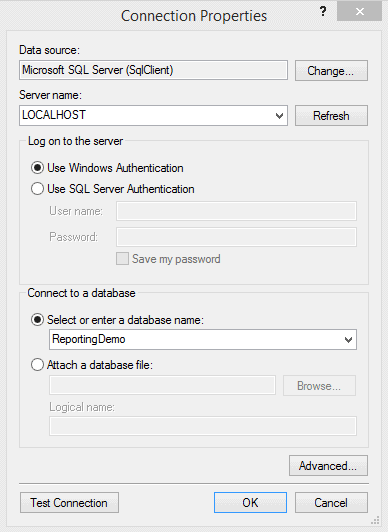
Figure 10
Next up is the Design the Query screen. We can use the Query Builder by clicking the button at the top left but, in this case, simply enter SELECT * FROM Customer; into the Query string text box and click Next.
On the Select the Report Type dialog, we can choose between a tabular or matrix report. A tabular report is a traditional grid with column headings and rows of data, and it might contain grouping sections at the row level. A matrix report is like a pivot table. It can have column headings that expand across the top of the report. It can have grouping sections at the row and column levels. We’re going to start with a simple tabular report so choose Tabular and hit Next.
This brings up the Design the Table screen, where we specify what customer data we wish to include in our report, and how we wish to group it. Essentially, we need to specify how we will use each field (column) in the report. We might display some fields at the top of each page, use others for grouping, and others will form the detail level of the report.
In this case, we simply want to group the customer data by state, so select State in the Available fields box and click the Group button. If you group by more than one field, then make sure the fields are ordered (use the Up and Down arrows) to reflect the grouping level hierarchy you wish to see in the report. For example, State would be higher than City.
Add the other fields to the Details box.
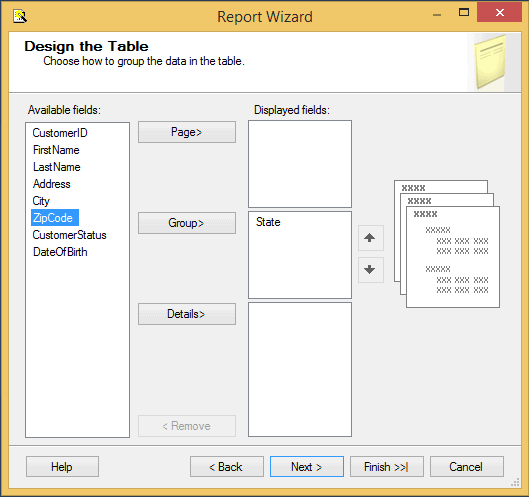
Figure 11
On the Choose the Table Layout page, we have the choice of Stepped or Block. I don’t see a lot of difference between these layouts. After some experimentation, I found that the Stepped report had a row dedicated to the group label and that row was formatted with a background color. The Block report shows the group label on the first row of the detail and no special background. With the Block report, we do not have the option for drilldowns.
Select the Stepped option and check the Enable Drilldown checkbox, which will allow us to collapse and expand the data by state (the grouping column)
On the next screen, choose a style for your report (I chose Ocean).
The Choose the Deployment Location screen allows us to specify the Report Server to which we wish to deploy the reports in the project. For now, we will be working within SSDT-BI and not deploying the reports to the server, so we can just accept the defaults. When we are ready to deploy the reports, we can revisit these settings by right-clicking the project name and selecting Properties.
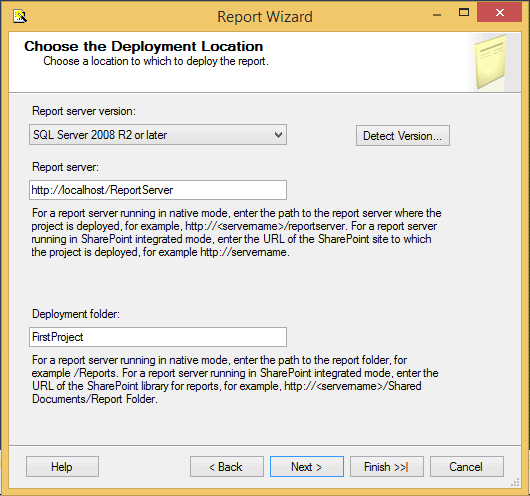
Figure 12
This brings up the final screen, Completing the Wizard, which simply summarizes our chosen report options, and lets us name the report and preview it. Name the report ReportWZ and click Finish to end the wizard.
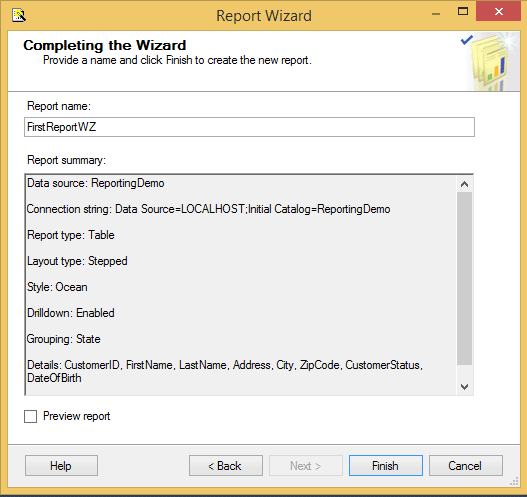
Figure 13
After the wizard completes, we will see the report in the Design tab of the standard Report Designer.
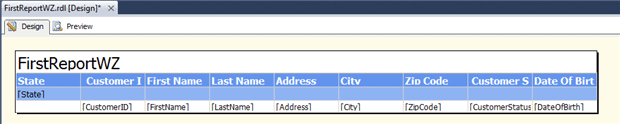
Figure 14
Click on the Preview tab to view the report. The Preview tab allows us to run the report from SSDT-BI, without having to publish it first to the Report Server. If the report takes parameters, the Preview tab will ask us to fill them out before it runs the report. Since this report doesn’t take any arguments, it will display immediately.
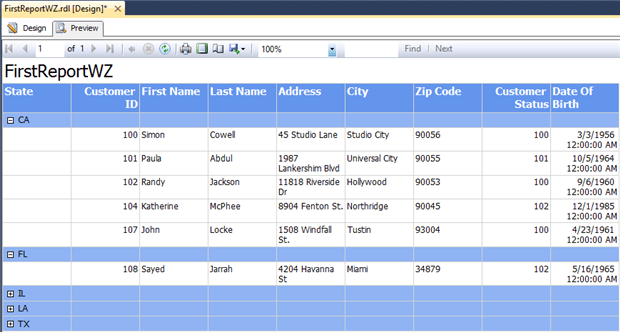
Figure 15
Use the +/- symbols next to the State abbreviations to expand and collapse the grouping of the report.
Manual report creation
Whilst the FirstReportWZ report is simplistic, it does demonstrate how quickly we can generate reports using the Wizard, which is often useful for prototyping.
In this section, we are going to create another simple, but more realistic, report from scratch. It will demonstrate how to create and use a shared data source object, stored procedures, and how to format the report, set report properties and use report parameters.
Create a shared data source
A shared data source is a data source that is common to, and can be used by, all of the reports in the project. Once the shared data source is published to the report server, any published reports can use it.
In the previous section, we created a ReportingDemo data source that is embedded in the ReportWZ report, and so is available only to that report. However, generally, it is a bad practice to use embedded data sources. Let’s say we have 20 reports that access the ReportingDemo database, but a few months later some aspect of the connection information changes (such as the login credentials, or server name). We’ll have to open all twenty reports and edit the connection information appropriately. It is much better to define a single shared data source that all reports that need the ReportingDemo database can use.
Likewise, let’s say that our organization has deployed three SSRS sites: Development, Test and Production. If we embed the connection information in the report, we will have to change the data source properties each time we publish the report to Development, Test or Production. If we use a shared data source, the data source will be configured appropriately on each of three sites. We can configure a data source on each site with the same name but pointing to the appropriate servers. We can simply publish the reports to each site, and the reports will automatically use the connection information associated with that environment.
We can find in SSDT-BI’s Solution Explorer all the reports and other project-level objects. To add a new shared data source to the project, right-click on the Shared Data Sources folder and select Add New Data Source and then simply create a ReportingDemo data source exactly as described in the previous section. It’s not possible to edit the existing embedded data source to make it a shared one. We have to define it as a shared data source upon creation.
Figure 16
Add a new report
We’re now going to create another report to return customer information. In the previous example, we used a simple SELECT * query to define the data set for the report. Here, we’ll use a stored procedure. In this first example, we’ll use a basic stored procedure with no parameters, but later we’ll refine it to add parameters, and allow end users to filter the report data by parameter value (e.g. to view customers only from a particular state).
When creating a new report manually, we must always follow this sequence of steps before we can begin to add data-connected objects:
- Add the report
- Create a data source in the report, preferably pointing to a shared data source
- Create a dataset that points to the data source and contains your query
First we add the report to the project. From the menu select Project | Add New Item (or right-click on FirstProject in solution explorer). Select Report, name it FirstReportMan.rdl and click Add. The new report will open up in Report Designer tool, at the Design tab.
Second, we define the database for the FirstReportMan report. On the left, you will see the Report Data window, used to manage the data sources, datasets and parameters of our report. At the top of the Report Data window, choose New | Data Source… from the dropdown list, which will open the Data Source Properties window, where we can either create a new embedded data source or point to a shared data source. We’ll change the name of the data source to ReportingDemo and select the Use shared data source reference option, selecting the ReportingDemo shared data source from the dropdown list.
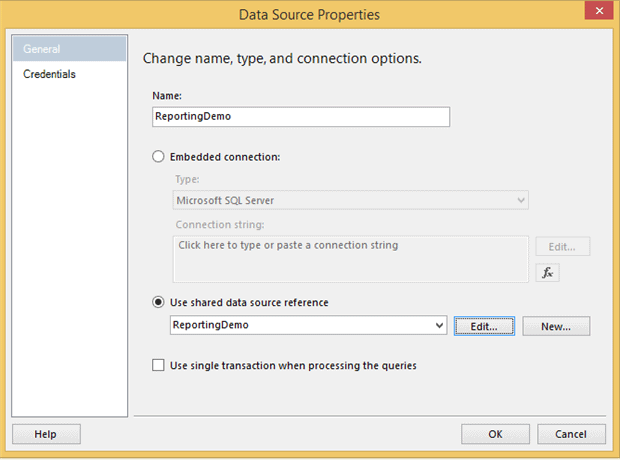
Figure 17
Third, we create the Dataset. While the data source is the connection string, the dataset is the query definition. In this example, our dataset is a very simple, parameter-less stored procedure called spr_CustomerSelectAll and all it does is select all of the columns from the Customer table. The ReportingDemoDatabaseScript.sql script, in the code download, includes the code to create the stored procedure.
From the Report Data menu, choose New | Data Set… to open the Dataset Properties dialog. We can create a shared dataset or a dataset embedded in the report. Most of the time, the dataset will be embedded in the report. There are some exceptions to this, for example, when we have a parameter list we use in multiple reports. Name the dataset Customers and choose to embed the dataset in the report. Select the ReportinDemo data source from the dropdown. Select StoredProcedure as the command type, and choose spr_CustomerSelectAll in the stored procedure list.
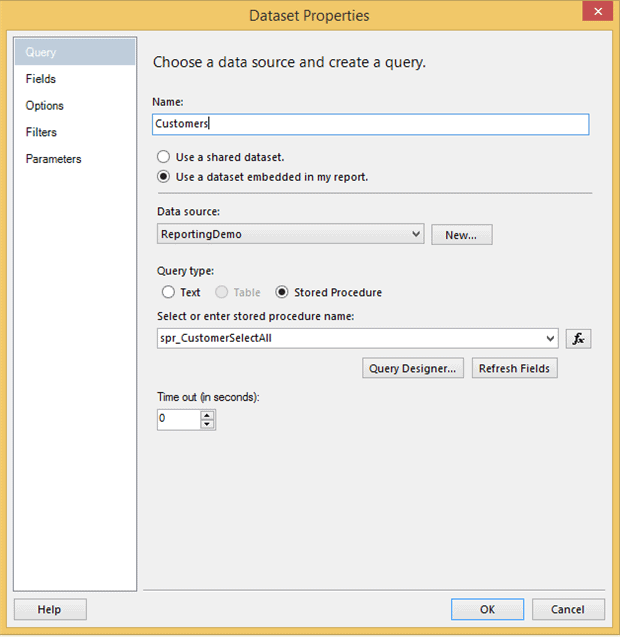
Figure 18
We can repeat these steps to add multiple datasets to the report, but for now we only need the one.
Designing the report
As we’ve noted previously, at the top of the Report Designer window are two tabs: Design and Preview. The Design tab is the physical Report Designer where we design the report i.e. set up the data presentation of the report itself, plus any header and footer for the report pages.
Design the Report table
Let’s start by designing the basic report table. Click to Design tab of our FirstReportMan report. We’re going to build a tabular report, so we start by dragging a Table control from the Toolbox window, onto the body of the report. By default, the table shows a header row at the top, and a data (or detail) row at the bottom.
In the Report Data window, expand the Customers dataset, select FirstName and drag it to the first cell of the detail row of the table, then drag LastName into the second column, and CustomerStatus into the third. When we drag each column into the data row of the table, SSRS make a guess as to what to call the row in the corresponding header. We can expand and shrink the size of the columns by highlighting and dragging.
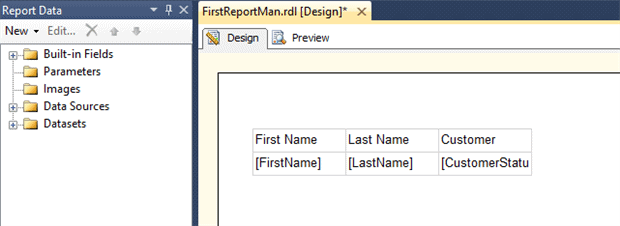
Figure 19
We can add additional columns to the table by right-clicking on one of the columns and selecting one of the two Insert Column options. We’ll add the DateOfBirth column to the report, so add a new column to the right of CustomerStatus, and then drag the DateOfBirth field from the dataset to the detail row of the new column. Alternatively, we can hover over the cell to see a popup list of fields from the dataset, and select DateOfBirth
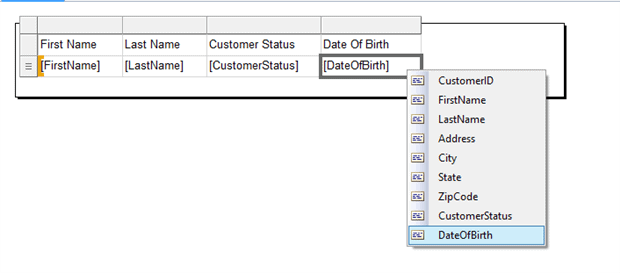
Figure 20
At this stage, we can click on the Preview tab to view the report.
Format the table header
Now we have a basic, very plain, tabular report, so let’s add some formatting to make it look better. We have lots of options such as adding background colors, changing the font or text color, adding italics or bolding, and more. In this example, we will change the background color of the header row.
To format all the cells in the header in the same way, click one cell to make the table handles appear. Then select the entire row by selecting the handle:
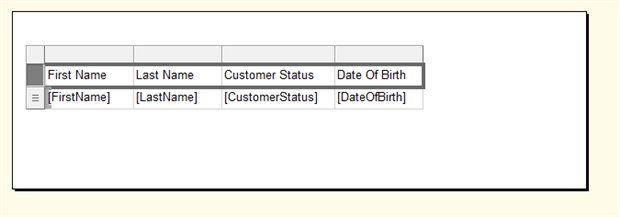
Figure 21
There are two ways to modify the properties. The first is to open the Properties window (F4), where we can set background color, font, and so on. The other method is to use the formatting toolbar. Whichever way you choose, set the background color for the headers to your preferred color and choose the bold font style.
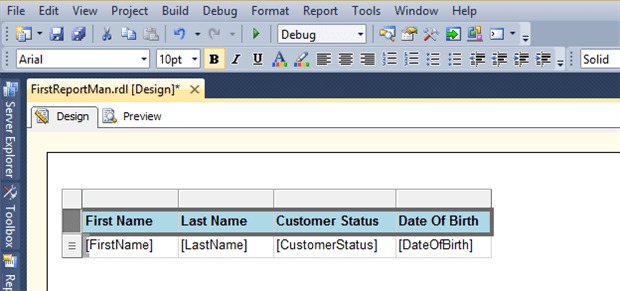
Figure 22
Having formatted the header row, we can once again click on the Preview tab to view the report.
Add a Page header
We’ve worked on the table header, but the report page itself can also have a header and footer. Report headers and footers appear on every page of the report. To add one, move to Design mode and select Report | Add Page Header from the menu. A new band appears on the report above the body. From the toolbox, drag a text box onto the header, click on it and enter your header, “My First Report”. Select the textbox and modify the font and text style, as desired. Again, we can check our handiwork in Preview mode.
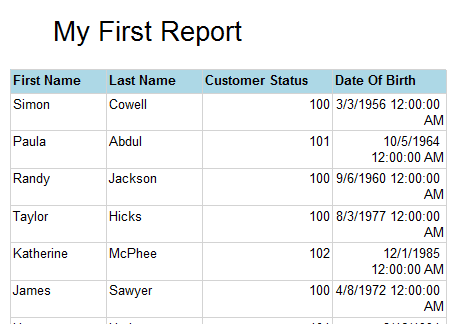
Figure 23
Starting with the 2008 release, as well as applying formatting to a textbox, we can also apply multiple formats to the text within a textbox. Clicking the edge of the textbox selects the textbox. Clicking inside the textbox selects the text. To try this, go back to the design view and select just part of the text in the “My First Report” textbox and apply different formatting, such as a different font. Now there are two formats within one textbox.
Field Formatting
We can apply formatting to each detail field in the report table. Let’s start by beautifying that ugly DateOfBirth field. The time information is superfluous, so let’s format the date properly. Right-click on the cell that contains the date of birth, choose Text Box Properties. Next, navigate Number | Date and then set the preferred format (I used yyyy-mm-dd).
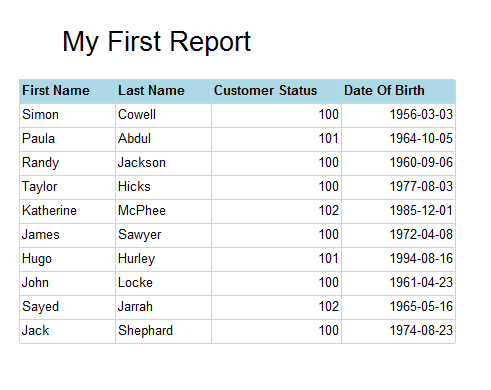
Figure 24
Setting report level properties
When on the Design tab of the Report Designer a top menu item, Report, activates, from where we can:
- Turn on and off the header and footer sections for the report pages
- Open the Report Properties dialog and set various report properties, such as the print format
- Publish report parts – starting with 2008 R2, you can publish individual part of the report that can be used to build dashboards (we won’t cover this till later in the series)
- View the grouping section and ruler. For example, if the ruler is not visible, turn it on from Report | View | Ruler.
Navigate Report | Report Properties to open the Report Properties dialog. Some of the report properties are also available in the Properties (F4) window as well, but you may find that working in the Report Properties dialog is more convenient.
Setting up the report print settings is not intuitive, compared to other products. In the report Design tab you see your report with a ruler across the top. Since I am in the US, my ruler is set up in inches by default. A standard sheet of paper is 8.5 x 11 inches. The default setting in SSRS is to have a 1-inch (or 2 cm) margin all the way around the content area. So, at 8.5 inches wide with a 1-inch margin on the left and another on the right, we have 6.5 inches for content. If the report page is wider than 6.5 inches, it will spill over onto a second sheet of paper when printed. If there is just blank space in the extra area, you will get alternating blank sheets of paper when printed.
On the Page Setup tab of the Report Properties dialog, we can change the report to Landscape if we wish, switch to centimeters, modify the paper size or the margins. To avoid spill-over when printing, make sure that the width of the report plus the right margin plus the left margin is less than the width of the paper size.
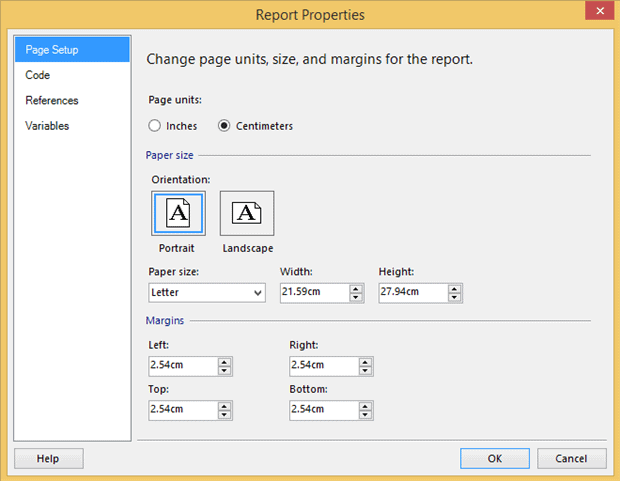
Figure 25
Adding parameters to a report
There are two ways to add parameters to our reports. The first is simply to define parameters in the queries in the dataset, and then these will automatically be available as report parameters. The second way is to manually add report parameters through the Parameters section of the Report Data window.
We can use parameters to filter the data at the source, or for other reasons like giving the end-user control over one of the properties. We could also have a parameter that is used for both functions.
Parameters created by the dataset query
First, we will set up parameters using a dataset query. You can either continue working with the same report or create a new one that is a copy of the original.
To create a copy, right-click on FirstReportMan in the Solution Explorer and select Copy. Then right-click on the project name and select Paste. Rename the new report ParameterReport. Double-click the new report in Solution Explorer to open it in the designer. In the Report Data window, navigate to the Customers dataset and double-click it to bring up the properties. The Dataset dialog box opens and allows us to edit the query for the dataset. Change the stored procedure from spr_CustomerSelectAll to spr_CustomerSelectByState. A parameter called @StateCD should appear in the Parameters folder. This parameter allows us to filter the data from the Customer table by State. Again, the ReportingDemoDatabaseScript.sql script in the code download includes the creation script for spr_CustomerSelectByState.
Switch to the Preview tab to view the report. Instead of the report just running and displaying all the data from the data source, there should be a place for us to enter a value for the @StateCD parameter. Enter “CA” and click the View Report button to see only Californian customers.
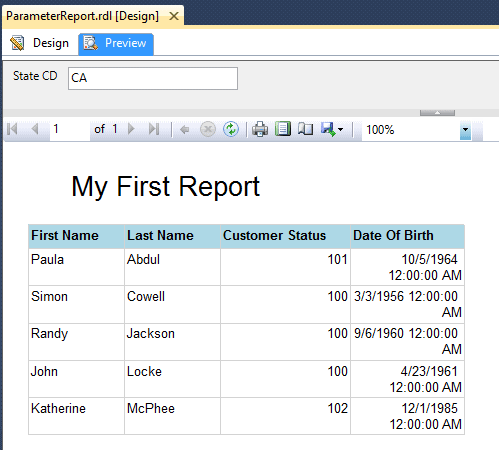
Figure 26
To edit existing parameters, or to add new ones, switch to the Design tab of the Report Designer and expand the Parameters folder. Double-click the StateCD parameter to bring up the properties. First, we are going to make the prompt a little more friendly. On the General page, change the Prompt value to State.
We can also provide a list of possible values for the parameter. Select the Available Values page and from here we can provide either a hard-coded list, or connect the parameter to a dataset. The second method is the generally the best so that we can avoid the need to maintain the list manually.
Close the parameter properties. To connect a parameter to a dataset, we first need to create a new dataset. Using the skills you have learned so far, add a dataset to the report called StateList based on this query: SELECT DISTINCT State FROM Customer ORDER BY State;.
Open the parameter properties once again and select Available Values. Choose Get values from a query. Under Dataset, select StateList. For the Value and Label fields, select State.
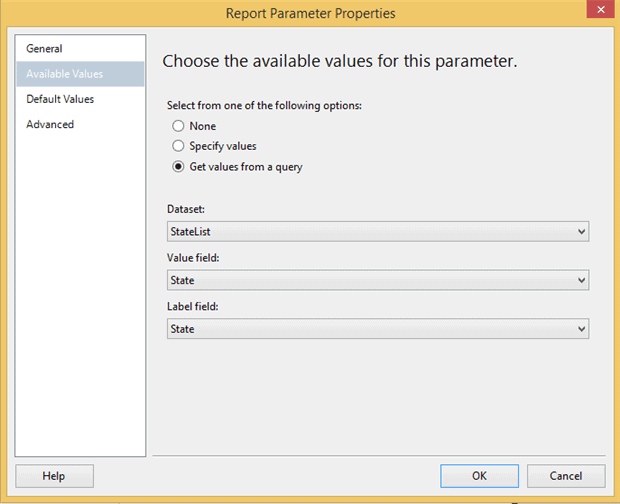
Figure 27
In this case, the Value and Label fields are the same. The Value field is the field that the database needs for the query. The Label field is the field that the end user should see. For example, if we have a list that has an ID and a description, the ID would be the Value field while the description would be the Label field.
Manually created parameters
Tip: Shared data sources, embedded datasets
Generally, data sources are best shared and datasets are best embedded. However, queries to populate parameter lists are good examples of datasets you may want to share instead, since they can often be used for several reports.
Now let’s add a parameter that is not defined in a query and, therefore, must be created manually. In the Report Data window, click Add | New Parameter. Give the new parameter the name ReportTitle, and enter “Report Title” for the Prompt. Its data type should be Text. Click OK.
Back on the Design tab, right-click the report header textbox and choose the Expression option. Remove the original “My First Report” text and select Parameters under Categories. Double-click on the ReportTitle parameter. This text box will now display the value we pass to the ReportTitle parameter. Click OK.
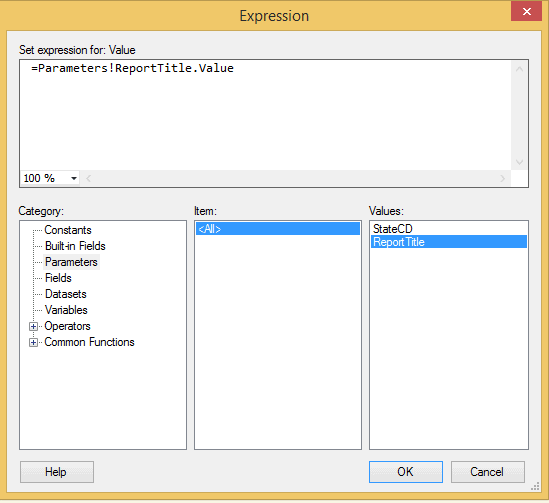
Figure 28
Switch to the Preview tab and try it out.
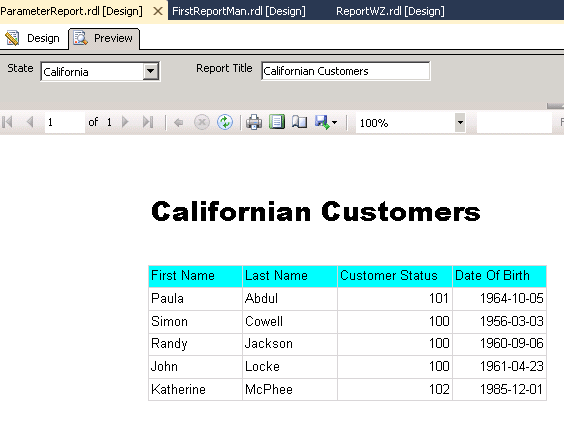
Figure 29
Wrap up
Part 1 covered everything we need to build a basic SSRS report. In the next articles, we’ll get into more advanced options such as grouping, drill-downs, sorting and custom functions. Stay tuned.


Load comments