
At the core of the SQL Server relational database management system (RDBMS) lies the database engine, which is optimized to support thousands of concurrent transactions while ensuring the integrity of the data and the management of resources. Applications accessing data in a well-designed relational database can swiftly retrieve and update the data-that is, as long as the queries used by the application don’t try to aggregate large volumes of information. When such queries do have to be performed, a SQL Server Analysis Services cube often provides a more efficient solution than the typical relational database.
An Analysis Services cube is a multidimensional structure that pre-aggregates data across multiple dimensions. For example, a cube can store a company’s total worldwide sales across product lines and sales regions. For any combination of product line and region (such as the mountain bike product line and North America region), the cube can store the pre-calculated aggregation of the sales total.
Unlike the SQL Server database engine, which supports online transaction processing (OLTP) of data in a relational database, the Analysis Services engine supports online analytical processing (OLAP) of data stored in a multidimensional cube-the main component in an Analysis Services database. An Analysis Services database is a logical collection of objects that include one or more cubes as well as other components that facilitate OLAP operations.
In this article, I discuss the basic components that make up an Analysis Services database and describe how to implement those components. To demonstrate these concepts, I created an Analysis Services project in SQL Server 2008 Business Intelligence Development Studio and named the project AW_sales. The project connects to the AdventureWorksDW2008 sample data warehouse on a local instance of SQL Server 2008. By default, Business Intelligence Development Studio assigns the project name to the database; however, as you’ll see later in the article, you can rename the database when you deploy it to an instance of SQL Server.
To implement an Analysis Services database, you need to take, at a minimum, the following steps:
- Create a data source.
- Create a data source view.
- Create one or more dimensions.
- Create a cube.
- Deploy the database.
The rest of the article covers each of these steps and demonstrates how to carry them out. For the most part, I focus on how to perform these steps and offer some of the why along with my explanations. However, I encourage you to check out SQL Server Books Online for more information about each concept that I describe. In addition, you should also have a basic understanding of data warehouses and how they’re implemented in a SQL Server relational database. For more information about data warehouses, see the article “SQL Server Data Warehouse Cribsheet” (http://www.simple-talk.com/sql/learn-sql-server/sql-server-data-warehouse-cribsheet/).
Creating the Data Source
An Analysis Services data source defines the connection to a specific source of data. For example, it is common for a data source to define the connection to a SQL Server database. However, you can also configure a data source to connect to other sources, such as a Microsoft Access or Oracle database. When you configure a data source, you must specify a provider (such as SQL Server Native Client 10.0) and then supply the information necessary to establish a connection to the data source, using the specified provider.
To create a data source in an Analysis Service project (in Business Intelligence Development Studio), right-click the Data Sources node in Solution Explorer, and then click New Data Source. This launches the Data Source wizard, which walks you through the steps necessary to create a data source. When you create a data source, you must define a data connection (unless one has already been created). To create a connection, click the New button on the Select how to define a connection screen of the wizard, which opens the Connection Manager dialog box. For this article, I used the default provider, Native OLE DB/ SQL Server Native Client 10.0, and connected to a local instance of SQL Server 2008, specifying AdventureWorksDW2008 as the database.
After setting up the connection, you must configure the impersonation information. Figure 1 shows the Impersonation Information screen of the Data Source wizard. For the example project in this article, I use the service account for my data source connection. However, you’ll probably want to use a more secure account for any solutions you implement into production. (See the topic “Impersonation Information Dialog Box” in SQL Server Books Online for more information about setting up security credentials when connecting to a data source.)
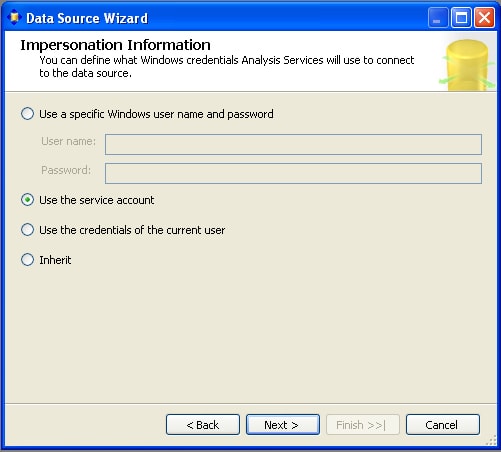
Figure 1: Specifying the impersonation information in for a data source
After you configure the impersonation information, you’ll need to provide a name for the data source. In this case, I named the data source the same as the database-AdventureWorksDW2008. Naming the data source is the last step you need to take to complete the wizard. After you click Finish, the new data source is added beneath the Data Sources node in Solution Explorer.
Creating the Data Source View
The next step in setting up an Analysis Services database is to create a data source view. A data source view provides an abstraction layer between the data source and other components in the database, such as dimensions and cubes. The data source view contains the metadata for objects selected from the data source and the relationships between those objects, providing a logical model of the underlying data source. You can enhance a data source view with elements that extend the data source. For example, you can add calculated columns or provide friendly names for tables and views.
An Analysis Services database can include one or more data source views. To create a data source view, right-click the Data Source Views node in Solution Explorer, and then click New Data Source View to launch the Data Source View wizard. The first step you must take in the wizard is to select a data source on which to base the data source view. For our example project, I selected the data source I created earlier-AdventureWorksDW2008. Next, you must select the tables and views that you want to include in your data source view. Figure 2 shows the Select Tables and Views screen of the Data Source view wizard in which you make your selections.
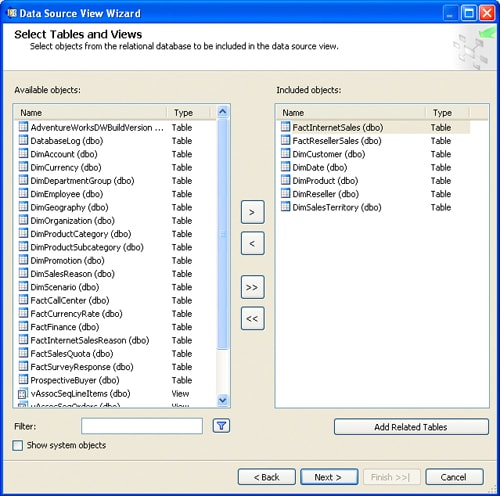
Figure 2: Selecting the tables and views for a data source view
For the purposes of this article, I selected two fact tables (FactInternetSales and FactResellerSales) and five dimension tables (DimCustomer, DimDate, DimProduct, DimReseller, and DimSalesTerritory)-all part of the AdventureWorksDW2008 data warehouse.
After you select your tables and views, you must provide a name for the data source view, or you can accept the default name. (I used the name Sales for my data source view). You’re then ready to complete the Data Source View wizard. When you click the Finish button, Business Intelligence Development Studio creates the data source view and opens a window in the design surface that displays details about your view, as shown in Figure 3.
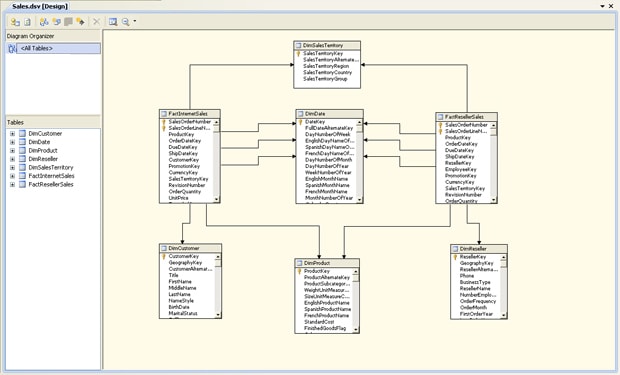
Figure 3: Viewing the tables in a data source view
As you can see in Figure 3, the design surface includes the Diagram Organizer pane, which lists the initial diagram (<All Tables>). The diagram itself is displayed in the main window. Notice that the design surface also include the Tables pane, which lists the tables included in the data source view.
You can add diagrams to your data source view that are based on those tables, and you can use any of the tables in any of the diagrams. For example, I created two diagrams, one based on Internet sales and the other on reseller sales. Figure 4 shows the diagram I created for Internet sales. Notice that it includes only those tables directly related to the FactInternetSales table. As a result, the diagram does not include the FactResellerSales and DimReseller tables.
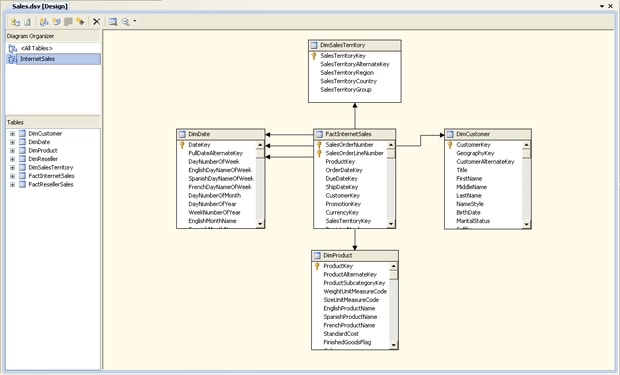
Figure 4: Viewing the InternetSales diagram in the Sales data source view
Diagrams make it easier to work with subsets of objects when the <All Tables> diagram becomes too unwieldy. To add a diagram to a data source view, click the New Diagram button on the design surface menu and enter a name for the diagram. You can then drag and drop database objects into the diagram and arrange them as necessary, as I did for Internet sales and reseller sales (shown in Figure 5).
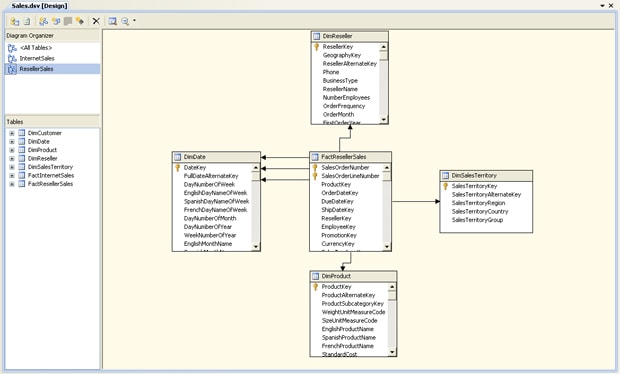
Figure 5: Viewing the ResellerSales diagram in the Sales data source view
In addition to adding diagrams to a data source view, you can add objects that affect the schema, as it’s stored in the data source view. For example, you can define a named query to replace a table. This could be useful if you want to flatten out a snowflaked schema in a data source and present multiple tables as a single table. The results of the query act like any other table in the data source view, even though the query is retrieving data from several tables in the data source. For this article, I will not be going into any of the ways you can modify a data source view, but be sure to check out SQL Server Books Online for additional information.
Creating the Dimensions
Once you’ve created your data source view, you’re ready to create the dimensions. An Analysis Services database dimension is similar to the type of dimension you find in a data warehouse. Each dimension is a collection of related attributes that describe a particular entity or process. For example, your Analysis Services database might include a dimension that defines product information. As a result, each attribute within the dimension should describe one aspect of the product, such as color, size, name, or some sort of identifier.
The attributes within the dimension are bound to columns in a data source view. Each dimension can be used in multiple cubes to provide the dimensional structure necessary to present the aggregated data. To create a dimension, right-click the Dimensions node in Solution Explorer, and then click New Dimension to launch the Dimension wizard. You can base a dimension on an existing table in your data source or generate a new table. Generating a table can be particularly useful if you want to create a date/time table if one does not exist in the source data. However, our data source does include the DimDate table, which provides the date/time functionality we need, so for the purposes of this article, we’ll base all our dimensions on existing tables.
The next step in the Dimension wizard is to specify the data source view and table that will be used for the dimension, as shown in Figure 6.
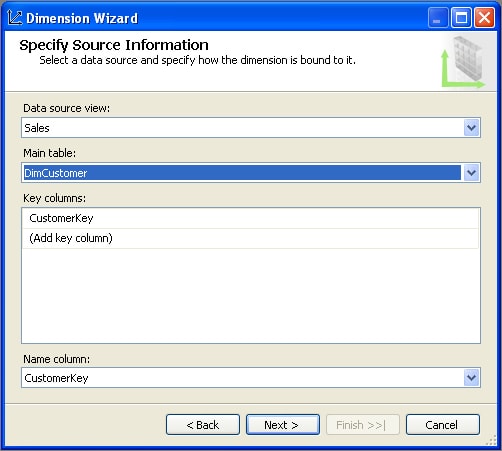
Figure 6: Specifying the source information for the Customer dimension
Notice that I’ve selected the Sales data source view (the only one I’ve created), and the DimCustomer table. The wizard automatically tries to determine the appropriate key column for your dimension. In this case, CustomerKey is the correct column, so I kept it. As for the name column, the key column is selected by default. The purpose of this option is to allow you to display a value to users other than the key value, though for the purposes of this article, I stuck with the default value.
The next step in creating a dimension is to specify the attributes that you want to include in that dimension. Figure 7 shows the attributes I’ve selected. You, of course, can include any attributes from the source data. Keep in mind, however, that you should include only those attributes that are necessary to the cube. For instance, you might decide that address and phone numbers aren’t essential information for your reporting requirements.
Figure 7: Specifying the attributes for the Customer dimension
The final step in creating a dimension is to name it. (I named my dimension Customer.) After you name the dimension and complete the wizard, the dimension information is displayed in the designer surface, as shown in Figure 8.
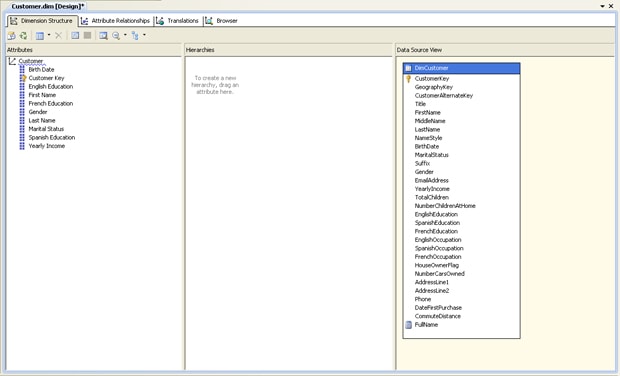
Figure 8: Viewing the Customer dimension in the Dimension Designer
Notice that the information in Dimension Designer includes that attributes and the DimCustomer table from the data source view. In addition, the designer surface shows other details, such as hierarchies and attribute relationship. Although I won’t be covering these features in this article, I plan to cover them in a follow-up article because of their importance to rendering multidimensional data.
That’s all there is to creating a database dimension. For the AW_sales project, I also created a database dimension for each of the other dimension tables in the data source view-DimDate, DimProduct, DimReseller, and DimSalesTerritory-and named the new dimensions Date, Product, Reseller, and Territory, respectively.
Creating the Cube
The fundamental components of a cube are dimensions and measures. A dimension in a cube is referred to as a cube dimension and is an instance of a database dimension, such as those I created in the last section. Measures are the facts that are being described by the dimensions. For example, your cube might include a measure that represents the amount of sales on orders. The measure can then be aggregated along dimensions such as product and territory to provide total sales based on those dimensions.
Measures are grouped together into logical containers called measure groups. The measure groups tie together dimensions within the structure of the cube. Let’s create a cube so you can better see how this works.
To create a cube, right-click the Cubes node in Solution Explorer, and then click New Cube to launch the Cube wizard. When you create a cube, you can base the cube on existing fact tables in the data source, create an empty cube, or generate your own tables, which will be added to the data source (assuming you’ve been granted permission to add the tables). Usually the easiest solution is to use existing fact tables, which is what I did for the AW_sales project.
When you use existing fact tables for your cube, the tables form the basis for your cube’s measure groups. To specify which tables to use, select them in the Select Measure Group Tables screen of the Cube wizard, as shown in Figure 9. As you can see in the figure, I’ve selected the FactInternetSales and FactResellerSales tables from the Sales data source view.
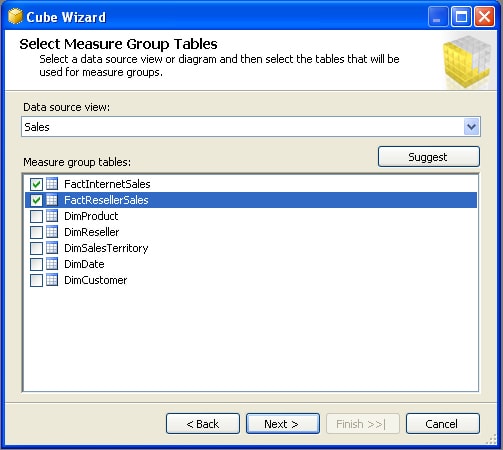
Figure 9: Selecting the measure group tables for the AW_Sales cube
The next step is to specify which measures to include in your measure groups. Figure 10 shows the Select Measures screen of the Cube wizard. As you can see, each measure group is listed with the measures available.
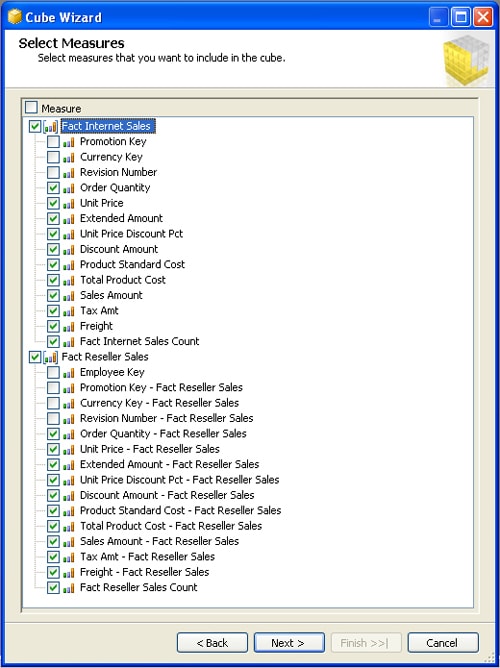
Figure 10: Selecting the measures for the AW_Sales cube
Notice that the list of measures for each measure group includes key columns. For example, the Fact Internet Sales measure group includes the Promotion Key and Currency Key columns. Because the related tables are not included in the data source view, the wizard treats them as potential measures. Consequently, you should deselect these columns, along with any other columns that aren’t necessary. For the AW_sales project, I deselected all the key columns as well as the Revision Number column in each measure group. You can, of course, choose to include any available columns as measures, as long as the values in the column can be aggregated in a meaningful way.
The next step in creating a cube is to select which database dimensions you want to include as cube dimensions, as shown in Figure 11. Because I created the database dimensions specifically for this cube, I left all of them selected.
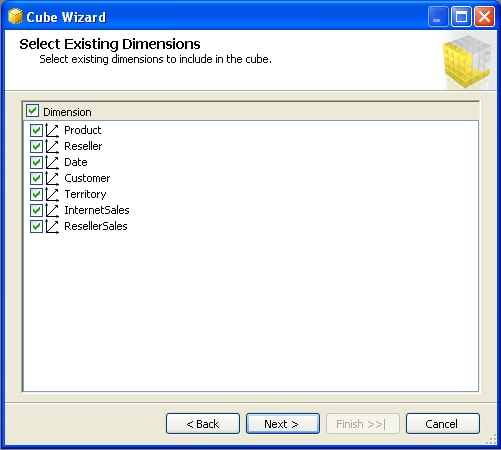
Figure 11: Selecting the dimensions for the AW_Sales cube
After you select the database dimensions to include in your cube, you will be prompted to select any additional dimensions that should be created, based on tables in the data source not already associated with dimensions. In the AW_sales project, the only tables not already associated with dimensions are fact tables, which should not be added as new dimensions.
The final step in creating the cube is to decide on a name. (I chose AW_sales for my cube.) After that, when you complete the wizard, Business Intelligence Development Studio generates the cube and opens it in the designer surface. Figure 12 shows you what the Cube Designer would look like for the AW_sales project.
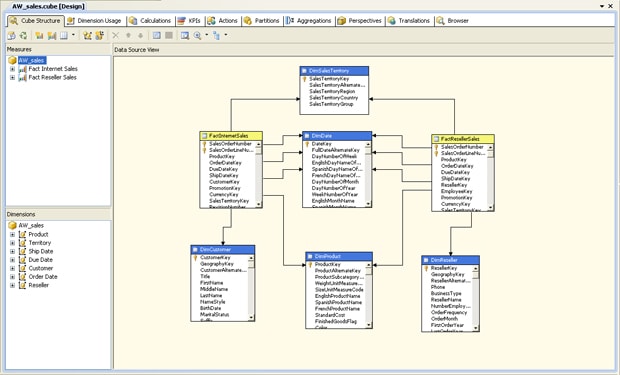
Figure 12: Viewing the AW_Sales cube in Cube Designer
Notice that the Cube Structure tab displays the Measures pane, which allows you to view the available measure groups and their measures. You can also create new measures and measure groups as well as delete them.
Cube Designer also includes the Dimensions pane, which lists the cube dimensions and their attributes. In addition to viewing the dimensions and attributes, you can add and delete them as well as edit their properties. If you review the cube dimensions in Figure 12, you’ll notice that there is no Date dimension. Instead, the Cube wizard created separate dimensions for each relationship from the fact tables to the Date dimension. Rather than one Date dimension, there are the Order Date, Due Date, and Ship Date dimensions. However, as you’ll recall from earlier in the article, cube dimensions are instances of the underlying database dimension. The wizard is clever enough to create separate instances in order to work more easily with the different dates in the cube data.
The main window in Cube Designer displays the data source view on which the cube is based. The other tabs provide details about other components you can add to the cube, although those components are beyond the scope of this article. However, I do plan to discuss them in later articles.
That’s all there is to setting up a basic cube. Once you’ve put all the pieces together, you’re about ready to deploy that database, so let’s move on to the next step.
Deploying the Multidimensional Database
Before you deploy your database, you must ensure that you send it to the correct instance of SQL Server, which means you have to set the deployment properties. To do so, right-click the project name in Solution Explorer (in this case, AW_sales), and then click Properties. Next, navigate to the Deployment properties, and then configure the Server property, as shown in Figure 13. As the figure shows, I’m deploying the database to a local instance of SQL Server.
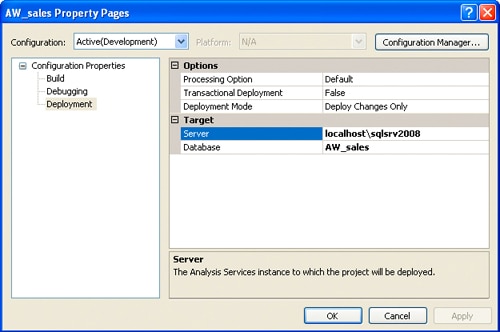
Figure 13: Configuring the deployment properties for the AW_sales database
Notice that you can also provide a name for the database. I’ve kept the name as the default, AW_sales, but you can choose whatever name is appropriate.
After you’ve configured the properties, you can deploy the database to the SQL Server instance. To deploy the database, right-click the project name in Solution Explorer, and then click Deploy. During the deployment process, Business Intelligence Development Studio displays the progress of the deployment process and shows any relevant messages in the Output pane at the bottom of the window. If the database is deployed with no problems, you’ll receive a message saying that the deployment is complete.
You can verify that the database has been deployed by using SQL Server Management Studio to connect to Analysis Services on the specified instance of SQL Server. The database should be listed beneath the Databases node and should include the data source, data source view, dimensions, and cube.
After you’ve deployed the database, you can browse the cube in either Management Studio or Business Intelligence Development Studio. In Development Studio, click the Browser tab of Cube Designer to view the work area available for rendering cube data, as shown in Figure 14.
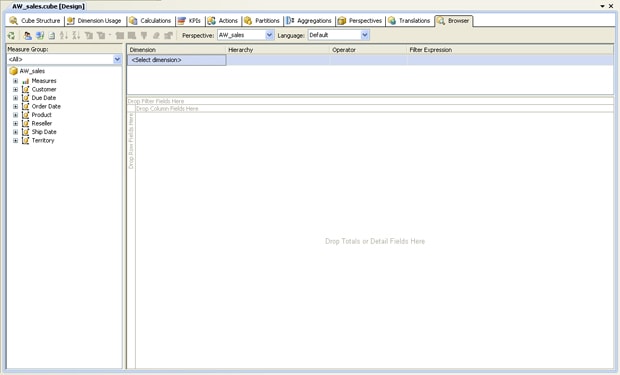
Figure 14: Viewing the Browser tab in Cube Designer
To test the cube, you must drag dimension attributes (fields) and at least one measure to the main window. For example, Figure 15 shows the data I browsed in the AW_sales cube. To display this data, I dragged the Sales Territory Group attribute from the Territory dimension to the Drop Row Fields Here section in the main window. I then added the Calendar Year attribute from the Order Date dimension to the same section. Next, I dragged the English Product Name attribute in the Product dimension to the Drop Columns Fields Here section. Finally, I dragged the Sales Amount measure from the Fact Reseller Sales measure group to the Drop Totals or Detail fields Here section.
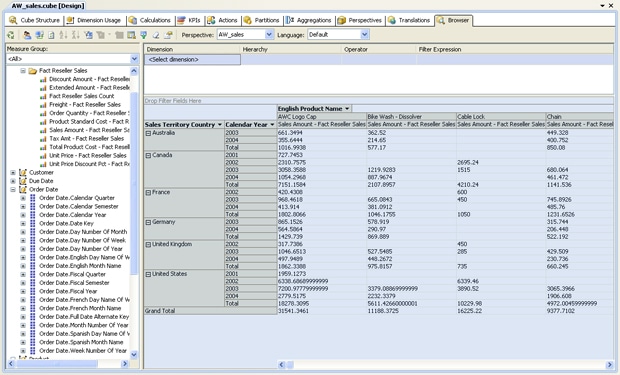
Figure 15: Browsing data in the AW_sales cube
When I added the Sales Amount measure to the display window, Cube Designer automatically displayed the aggregated values. As you can see in Figure 15, not only are individual totals displayed, such as the total sales for AWC Logo Caps in Europe in 2002, but also the rolled-up totals for the entire territory over all years as well as totals for all territories.
Yet this is only a small example of what you can do with data in an Analysis Services cube. Analysis Services supports numerous features that let you drill into the data even further and mine for meaningful patterns of data. However, these features still rely on implementing the basic database structures-the data source, the data source view, the dimensions, and the cube. After you’ve mastered those, you’ll be ready to implement more advanced functionality.


Load comments