
The series so far:
- Power BI Introduction: Tour of Power BI — Part 1
- Power BI Introduction: Working with Power BI Desktop — Part 2
- Power BI Introduction: Working with R Scripts in Power BI Desktop — Part 3
- Power BI Introduction: Working with Parameters in Power BI Desktop — Part 4
- Power BI Introduction: Working with SQL Server data in Power BI Desktop — Part 5
- Power BI Introduction: Power Query M Formula Language in Power BI Desktop — Part 6
- Power BI Introduction: Building Reports in Power BI Desktop — Part 7
- Power BI Introduction: Publishing Reports to the Power BI Service — Part 8
- Power BI Introduction: Visualizing SQL Server Audit Data — Part 9
Power BI Desktop provides a powerful tool for creating reports you can publish to the Power BI service or save to Power BI Report Server. One of the most valuable features in Power BI Desktop is its integration with the R language. You can use R to import or transform data, as well as create visualizations. You can also import prebuilt R-based visualizations into Power BI Desktop, without needing to write or interact with R.
In this article, I explain how to work with R in Power BI Desktop, focusing on the how to perform R-specific tasks, as opposed to diving into the R language. For this reason, the R scripts in the examples are very rudimentary and meant only to demonstrate how you can utilize R in Power BI Desktop. Once you understand these concepts, you can then take advantage of R’s extensive and robust capabilities to analyze, transform, and visualization data. If you’re not familiar with R, a good place to start is with the R Project site.
When working with R in Power BI Desktop, R must be installed on the same Windows computer as Power BI Desktop. You can download and install an R distribution for free from a variety of locations, including the CRAN distribution available from the R Project site and the Microsoft R Open distribution available from the Revolution Analytics site. For the examples in this article, I used the CRAN distribution, version 3.5.0.
You’ll also find it handy to have a separate R integrated development environment (IDE) installed on your system. This allows you to verify your R scripts before running them within Power BI Desktop. An IDE also makes it easier to install R packages that you might need when running R in Power BI Desktop. On my system, I installed the free version of RStudio, which is available from the RStudio site.
When you open Power BI Desktop, Power BI Desktop tries to locate an R installation on your system. You can verify whether the correct installation has been detected by opening the Options dialog box, available by going to File > Options and settings > Options. The following figure shows the Options dialog box with the R scripting section selected, as it appears on my system.
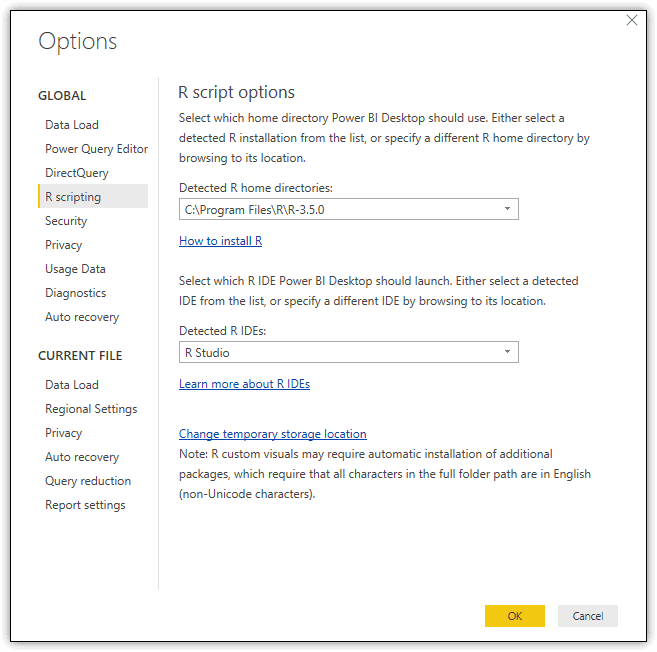
In my case, Power BI Desktop detected both the correct R installation and IDE. If you find the information to be incorrect or missing, you can provide a specific R installation, R IDE, or both.
Associating an IDE with Power BI Desktop applies only when creating R visualizations in Report view. By associating an IDE, you can launch the IDE from within Power BI Desktop and work on the visualization script there.
Using an R Script to Import Data
When using an R script to import data, the script must return at least one data frame that serves as the basis for your imported table. If the script returns multiple data frames, you can choose which ones to include as part of the import process. Power BI will create a table for each imported data frame. One word of warning, however. If a data frame contains a column configured with the complex or vector type, Power BI Desktop will replace the column’s values with errors.
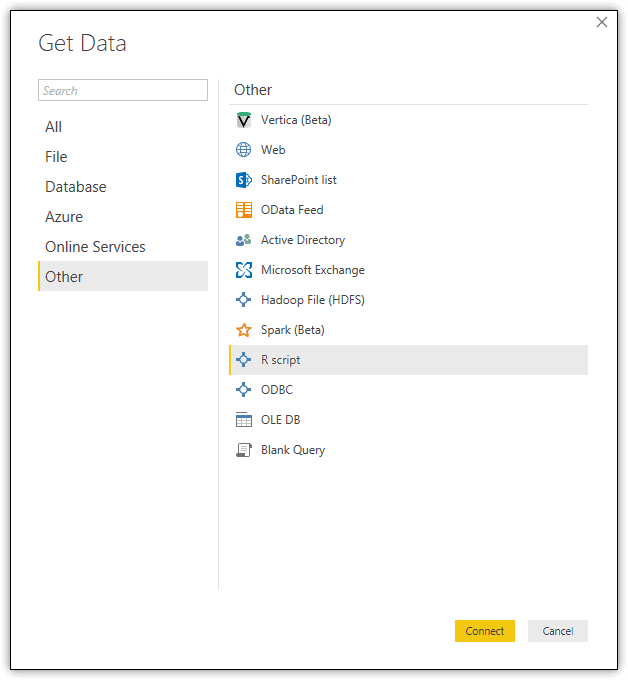
To use an R script to import data into Power BI Desktop, click the Get Data button on the Home ribbon. When the Get Data dialog box appears, navigate to the R script option in the Other category, as shown in the following figure.
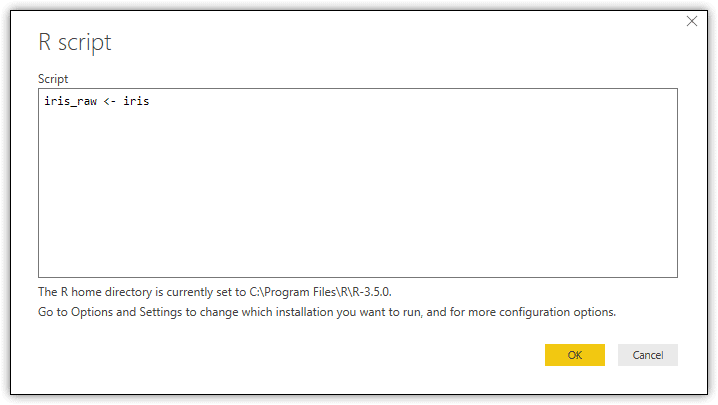
When you click the Connect button, Power BI Desktop launches the R script dialog box, where you can type or paste your R script. For the first example, use the following R script to retrieve data from the iris dataset (included with the CRAN distribution) and assign it to the iris_raw variable:
|
1 |
iris_raw <- iris |
In Power BI Desktop, you must assign the dataset to a variable even if you don’t modify the data frame in any way. If you were to enter only the name of the dataset, as you can do in an IDE, no data frames would be available to import into Power BI Desktop.
Before entering your script into the R script dialog box, you should test it in your IDE to ensure that it runs properly and returns the results you expect. If your script generates an error within Power BI Desktop, it can be very difficult to make sense of it. Plus, you have to start over with the import process.
Once you’re sure that the script is ready to go, you can enter it into the Script textbox, as shown in the following figure.
When you click OK, Power BI Desktop processes the script and then launches the Navigator dialog box, which lets you select which data frames to import we well as review sample data for each data frame. In this case, the R script returns only the iris_raw data frame, so it is the only one available, as shown in the following figure.
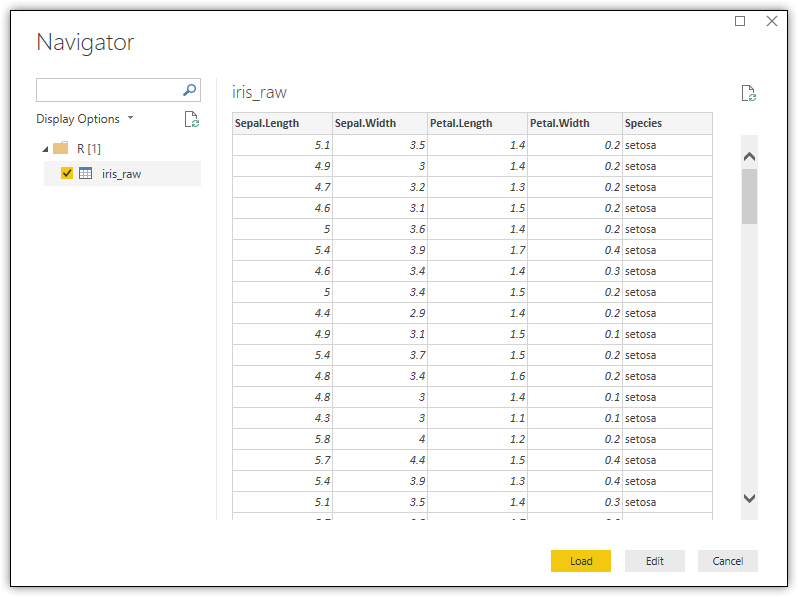
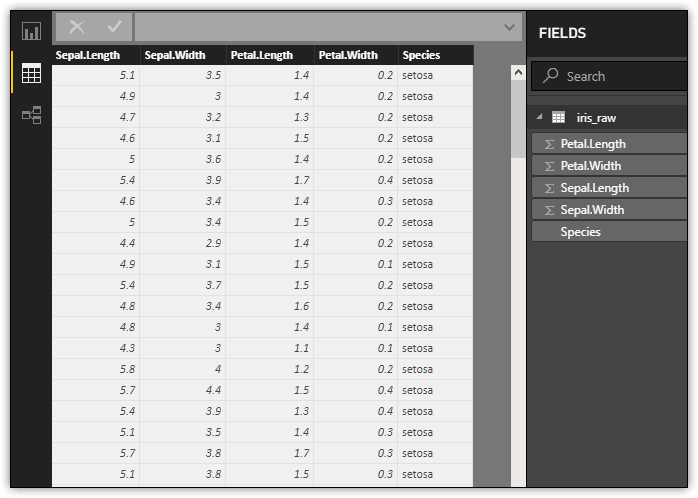
The Navigator dialog box lists the data frames in the Display Options section, under the R[1] folder. You must select the checkbox associated with each data frame you want to import. Once you’ve made your selection, click Load. After Power BI Desktop loads the data, you can view the dataset in Data view, as shown in the following figure.
In some cases, you might want to import data from a file, rather than using one of the built-in datasets. For example, suppose you’ve copied the iris dataset to a CSV file, which you’ve saved to the C:\DataFiles\ folder on your local drive. You can easily pull the data into an R data frame using the following statement:
|
1 |
iris_csv <- read.csv(file="C:/DataFiles/iris.csv", header=TRUE, sep=",") |
The statement uses the read.csv function to read the context of the iris.csv file. The header argument is set to TRUE to indicate that the first-row values should be created as headers (if that’s what you want to do.) The sep argument indicates that a comma is used to separate the data values within the file. You can then use the same process described in the previous example to import the data from the iris_csv data frame.
The R language is very flexible due to the ability to install packages with additional functionality, and there are several that aid reporting and analytics. The dplyr and data.table packages provide useful functions (verbs) for working with data frames. The ggplot2 is useful for visualizations. To use these in Power BI Desktop, they must be installed on your system. You can install these through your IDE, in this case R Studio. Launch R Studio and run these commands:
|
1 2 3 |
install.packages("dplyr") install.packages("data.table") install.packages("ggplot2") |
After the packages are installed, you can then use the library function within your R script to call that package when importing the data. This allows you to use the functions included in the package, such as group_by and summarize. To view a list of the packages that Power BI Desktop supports, see the help topic R packages in the Power BI service.
One of the biggest benefits of being able to use R when importing data into Power BI Desktop is that you can manipulate data as part of the import process. For example, the following script uses the summarize and group_by functions available in the dplyr R package to group and aggregate the data before importing it:
|
1 2 3 4 |
library(dplyr) iris_mean <- summarize(group_by(iris, Species), slength = mean(Sepal.Length), swidth = mean(Sepal.Width), plength = mean(Petal.Length), pwidth = mean(Petal.Width)) |
The group_by function prepares the data for use by another function, which in this case is summarize (also written as summarise). In this example, the summarize function is used in conjunction with the mean function to find the mean for each of the four measures, grouped according to the values in the Species column.
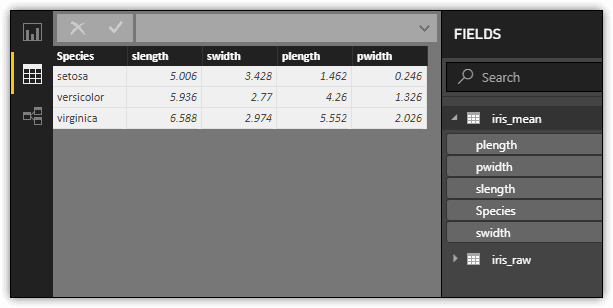
Returning now to the R statement above, notice that the aggregated data is saved to the iris_mean variable. This is the name that is assigned to the dataset when imported into Power BI Desktop, as shown in the following figure.
Of course, you can write far more complex R scripts than the one shown here, but this should give you an idea of how easy it is to use R to import data into Power BI Desktop. And the more adept you are with R, the more powerful this feature becomes.
Using an R Script to Transform Data
There might be times when you’ll want to use R to manipulate a dataset already imported into Power BI Desktop. Query Editor includes the capacity to apply an R script to a dataset in order to transform the data. But before modifying the data, take a look at the following figure, which shows how the iris_raw dataset appears in Query Editor before applying any transformations.
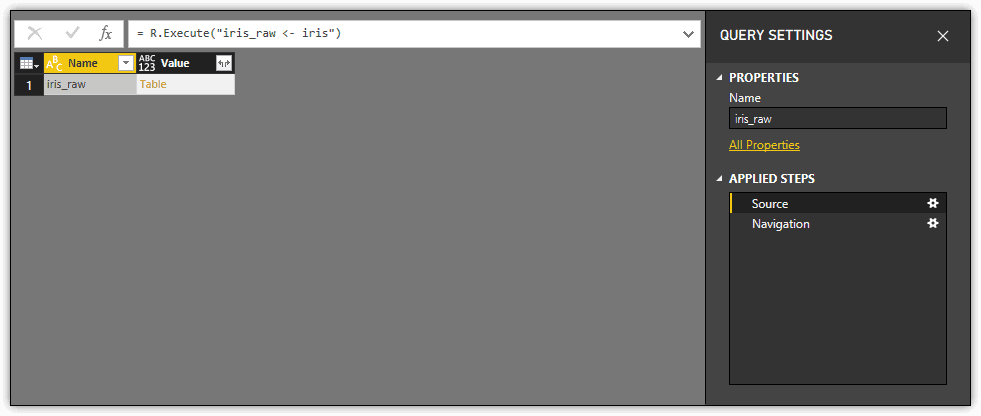
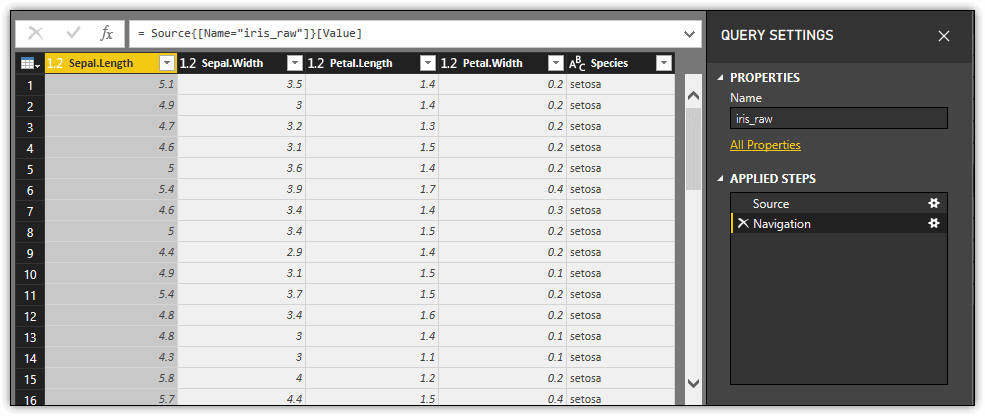
Notice that the Applied Steps section includes two steps: Source and Navigation. In this figure, the Source step is selected and a small table is displayed in Query Editor’s main pane. The table represents the initial import operation, with one row included for each returned data frame. In this case, because there is only the iris_raw data frame, the table includes only one row. The Table value in the Value column represents the data associated with that data frame. Selecting this value results in the second step, Navigation, which is the actual imported data, as shown in the following figure. Whenever you use an R script to import data, Power BI Desktop adds both the Source and Navigation steps.
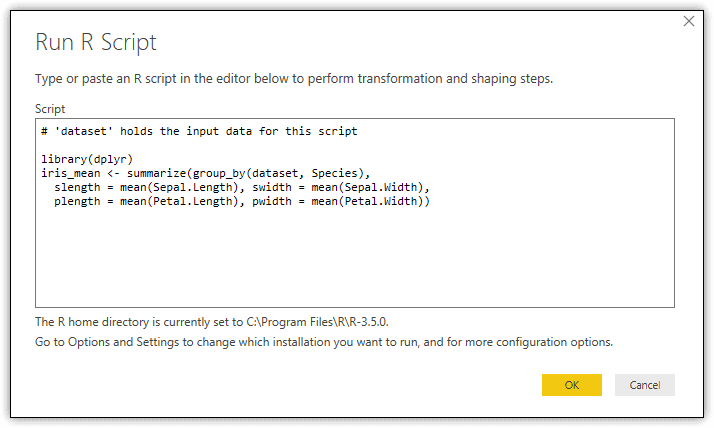
Now take a look at how to run an R script against the iris_raw dataset. To keep things simple, use the same aggregation logic used when importing the iris_mean dataset. The primary difference is that you must use the dataset variable when referencing the dataset, instead of specifying iris, as shown in the following script:
|
1 2 3 4 |
library(dplyr) iris_mean <- summarize(group_by(dataset, Species), slength = mean(Sepal.Length), swidth = mean(Sepal.Width), plength = mean(Petal.Length), pwidth = mean(Petal.Width)) |
To run this or any R script in Query Editor, click the Run R Script button on the Transform ribbon. This launches the Run R Script dialog box, which includes the Script textbox, where you can type or paste your script. The following figure shows the Run R Script dialog box with the above R script included. Notice that Power BI Desktop adds a comment stating that the dataset variable holds the input data. The input data is the active dataset in Query Editor, which in this case is the iris_raw dataset.
After you enter the script and click OK, Query Editor adds two steps to the Applied Steps section: Run R Script and “iris_mean”. These two steps work just like the first two steps, Source and Navigation. The first one reflects the data frames returned by the script, and the second reflects the selected data frame, as shown in the following figure.

As with using R to import data, being able to run an R script against a dataset provides you with a powerful tool for working with the imported data, whether the data was imported from a database system, online service, or text file. After you’ve imported the data into Power BI Desktop, any dataset is fair game.
Using an R Script to Create Visualizations
Another great feature in Power BI Desktop is the ability to use R to create visualizations within Report view. For the most part, this process is as straightforward as using R in other ways, except for one important caveat: R automatically groups and summarizes the data, whether or not you want done, and you cannot override this behavior. Why Microsoft decided to take this approach is a bit of a mystery, especially since it can sometimes give you results you don’t want.
Fortunately, there is a workaround. You can add a column to your dataset that uniquely identifies each row, similar to an IDENTITY column in a SQL Server table. If you’re using an R script to import the data, you can add the column as part of the import process. For example, the following R script adds an identifier column to the iris dataset based on the dataset’s index (row names):
|
1 2 3 4 5 |
library(data.table) iris_id <- iris iris_id <- setDT(iris_id, keep.rownames=TRUE)[] setnames(iris_id, 1, "id") iris_id$id <- as.integer(iris_id$id) |
The script starts by calling the data.table package, which provides functions for working with data frame objects. (Be sure to install the package if you haven’t already done so.) The setDT function, along with the keep.rownames argument, creates the new column based on the index values. Notice that you must first assign the iris dataset to the iris_id variable before using the setDT function. This is because the function makes changes directly to the dataset, which you cannot do with a built-in dataset such as iris.
After creating the column, you can then use the setnames function to change the name of the first column from the default (rn) to the new name (id). The final step is to change the column data type to integer.
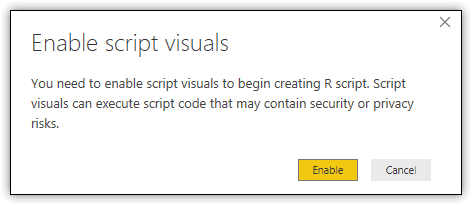
With the iris_id dataset in place, you can use it to create a visualization based on an R script. To add an R-based visualization, go to Report view and click the R button on the Visualizations pane. The first time you do this, you’ll be prompted to enable script visualizations, as shown in the following figure. Simply click the Enable button, and you’ll be good to go.
When you click the R button on the Visualizations pane, Power BI Desktop adds a graphic placeholder to the report and opens the R script editor pane. Before you can do any scripting, however, you need to identify the dataset columns that you’ll be using in the visualization. The easiest way to do this is to drag the columns from the Fields pane to the Values section of the Visualizations pane. Be sure to include the identifier column you created on the dataset. For this example, add the id, Species, Petal.Length, and Petal.Width columns, as shown in the following figure.
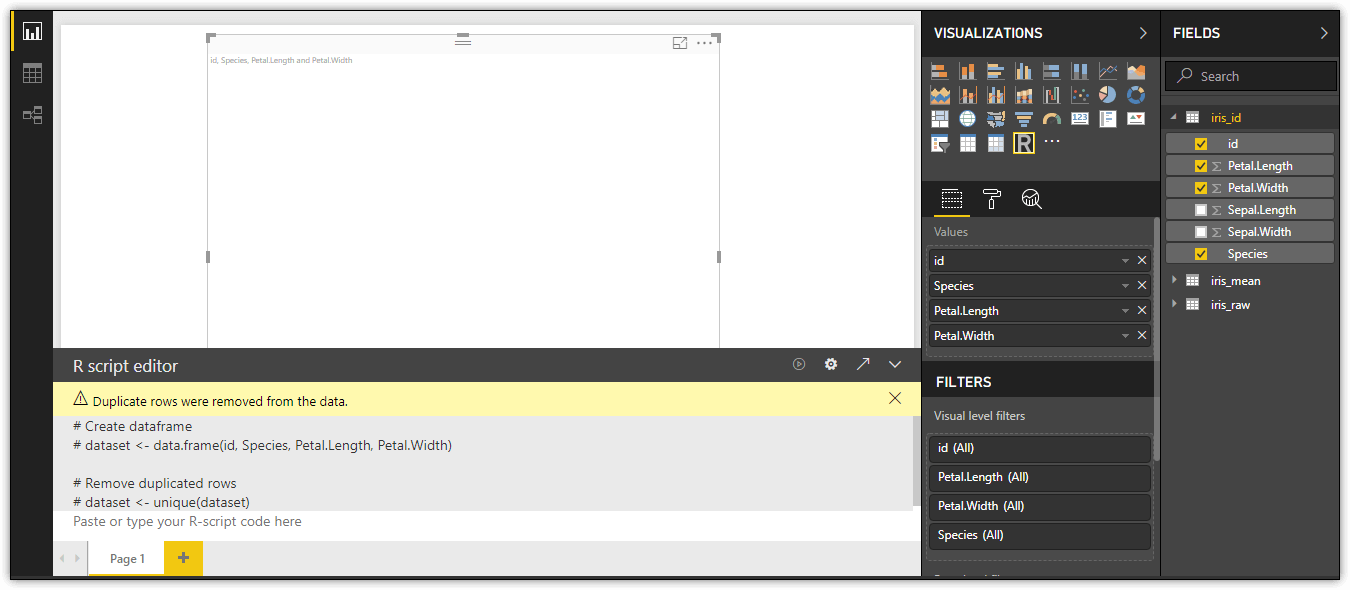
When you add the columns, Power BI Desktop inserts several comments in the R script editor pane. The first two comments indicate that a data frame named dataset has been created, based on the columns you added to the Values section of the Visualizations pane. You must use dataset to reference the source data in your R script.
The second two comments, along with the warning message at the top of the pane, indicate that duplicate rows have been removed from the dataset, which is why you needed to add the identifier column.
Beneath the comments, you can type or paste your R script. For this example, use the following script to create a basic scatter plot:
|
1 2 3 4 5 6 7 |
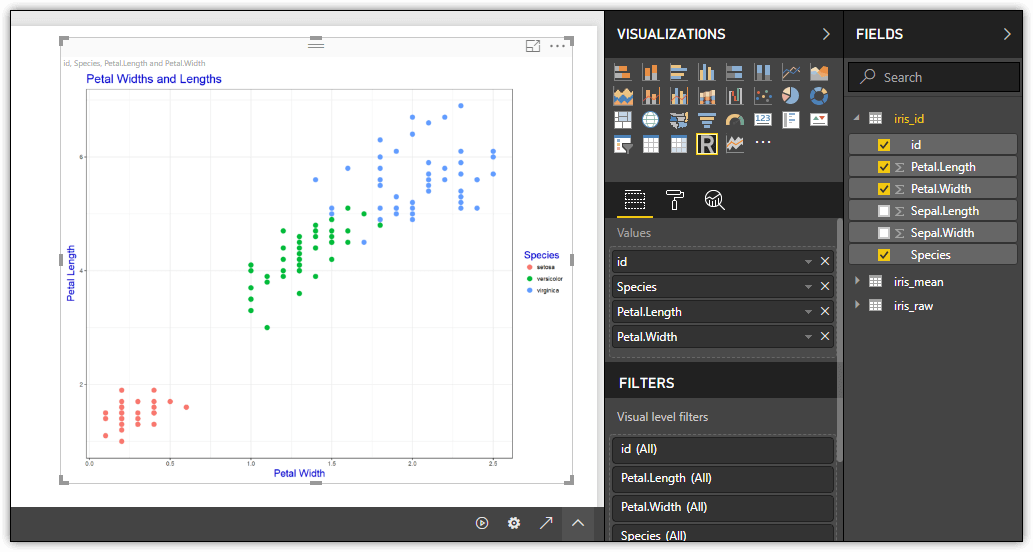
library(ggplot2) ggplot(data=dataset, aes(x=Petal.Width, y=Petal.Length)) + geom_point(aes(color=Species), size=3) + ggtitle("Petal Widths and Lengths") + labs(x="Petal Width", y="Petal Length") + theme_bw() + theme(title=element_text(size=15, color="blue3")) |
The script uses the ggplot function in the ggplot2 package (be sure to install the ggplot2 package if you haven’t already) to create a visualization with the specified colors and labels. Notice that the Petal.Width column is used for the X-axis, the Petal.Length column is used for the Y-axis, and the Species column serves as the basis for the plot colors.
After you define the R script, click the Run script button at the top of the R script editor pane. Power BI Desktop processes the script and displays the visualization in the placeholder added earlier, when you first clicked the R button. The following figure shows how the visualization appears on my system.
You can update an R-based visualization at any time by modifying the R script. After you modify the script, click the Run script button to update the visualization.
If you want to edit the code in your IDE, click Edit script in external R IDE at the top of the R script editor pane. This launches the IDE, which will display an R script that includes the code necessary to connect to the data source you’re using for your visualization. The script will also include any code you already added to the visualization script in Power BI Desktop. You still have to copy-and-paste the bulk of your script back into Power BI Desktop, if you make any changes, but this at least saves you the trouble of trying to set up the data source in the IDE in order to test your script.
Something to keep in mind when adding R-based visualizations to your report is that the Power BI service comes with licensing restrictions. You cannot use R-based visualizations in the Power BI service unless you have a Power BI Pro license.
Importing R-based Custom Visuals
Another fun feature in Power BI Desktop is the ability to import predefined R-based visualizations into your workspace. The visualizations are available through Microsoft’s AppSource gallery, which you can access directly through Power BI Desktop. You do not need to understand R syntax, nor do you need build or run R scripts.
To import a visualization, click the ellipses button on the Visualizations pane in Report view, and then click Import from marketplace. This launches the Power BI Visuals window, shown in the following figure.
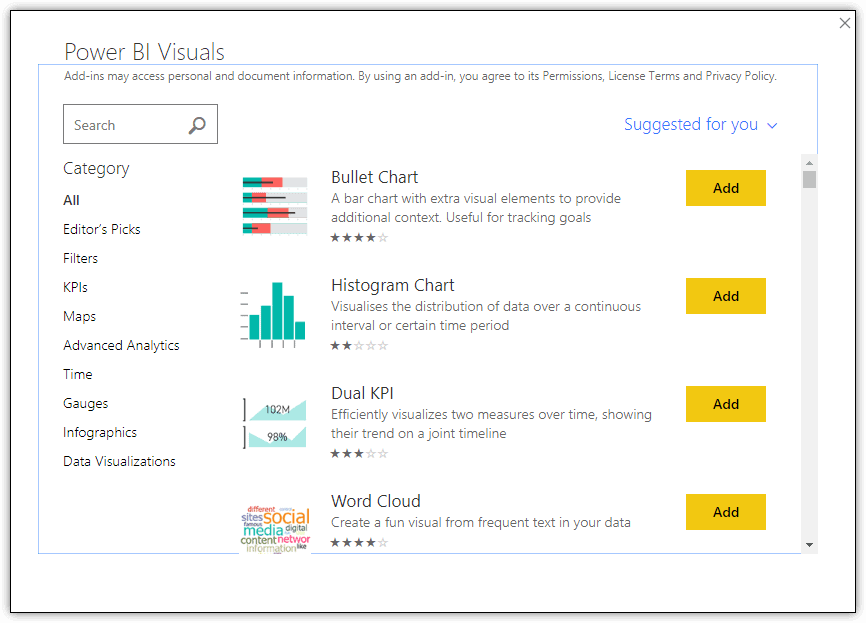
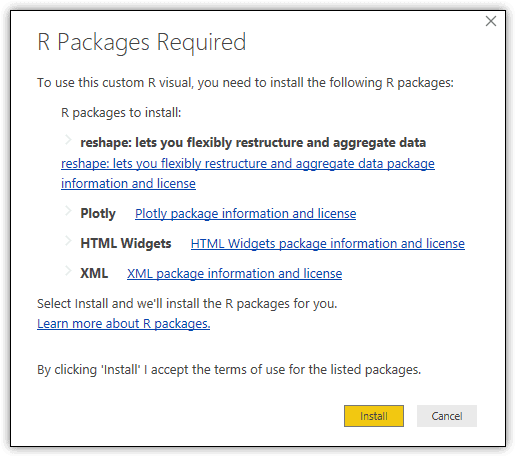
When you locate the visual you want to import, click Add. If the visualization requires additional R packages to be installed, the R Packages Required dialog box appears, listing the packages that need to be added. You can either click Cancel and install the packages manually, or you can click the Install button and let Power BI Desktop install the packages automatically.
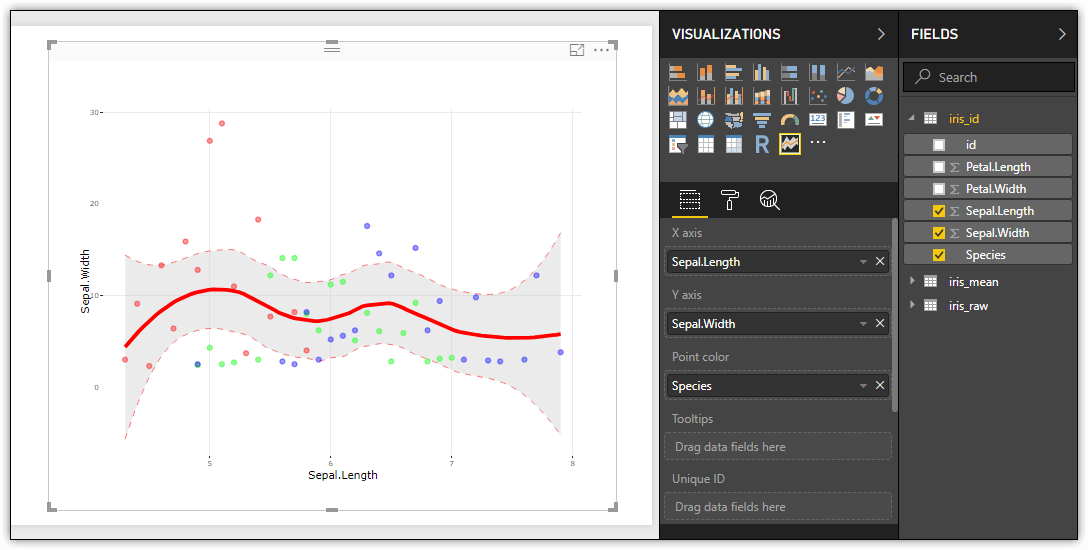
For this example, select the Spline chart visualization. Type Spline in the Search window if it’s hard to find. When it’s added it to Power BI Desktop, the R Packages Required dialog box in the following figure will appear. To take the automatic installation route, click Install.
When you import a custom visualization, Power BI Desktop adds a button to the Visualizations pane specific to that visualization. You can then add the visualization to your report and configure just like you would any of the prebuilt visualizations. The following figure shows the Spline chart visualization. For the data, specify the Species, Sepal.Length, and Sepal.Width columns from the iris_id dataset, as shown in the following figure.
Microsoft provides a number of free and interesting custom visualizations in the AppSource gallery. It’s certainly worth familiarizing yourself with what’s out there so you can create reports that are even more engaging than you can achieve with the built-in visualizations. Best of all, Microsoft has made it exceptionally easy to pull the custom visualizations into Power BI Desktop, so you have little to lose by trying them out.
Making the Most of R in Power BI
The integration of the R language into Power BI Desktop provides a powerful tool for transforming and presenting business intelligence data. R is a comprehensive statistical computing and graphics language that is extensively implemented and has a large and active user community. In Power BI Desktop, you can use R to import and modify data as well as create a wide range of visualizations that provide in-depth insights into the data. Those already well versed in R should find that using R in Power BI Desktop is a simple and straightforward process. Even those less experienced with R could find it well worth the effort to try out the Power BI Desktop R features.
This document contains proprietary information and is protected by copyright law.
Copyright © 2026 Red Gate Software Limited. All rights reserved


Load comments