
The series so far:
- Text Mining and Sentiment Analysis: Introduction
- Text Mining and Sentiment Analysis: Power BI Visualizations
- Text Mining and Sentiment Analysis: Analysis with R
- Text Mining and Sentiment Analysis: Oracle Text
- Text Mining and Sentiment Analysis: Data Visualization in Tableau
- Sentiment Analysis with Python
Text Mining and Sentiment Analysis can provide interesting insights when used to analyze free form text like social media posts, customer reviews, feedback comments, and survey responses. Key phrases extracted from these text sources are useful to identify trends and popular topics and themes. Sentiment scores provide a way to perform quantitative analysis on text data. Combining these techniques, using visually engaging dashboards will help unlock the value of your text data.
This three-article series about Text Mining and Sentiment Analysis will start with exploring Azure Cognitive Services -Text Analytics APIs. In the second article, I’ll discuss various qualitative and quantitative techniques to analyze the data and create compelling visualizations in Power BI. The third and final article of this series will show how to use R to generate a Word Cloud, sentiment scores and NRC sentiment.
NOTE:These articles assume basic familiarity with Power BI and Azure.
Introduction
Have you looked at social media posts, customer reviews and feedback, survey responses to open-ended questions, or pretty much any free form text and wondered about analyzing that data? Maybe you have tried analyzing this type of data with R or Python and wondered if you are using the right lexicon or library for the task. Have you wondered about how to visualize the outcome of such analysis, create Dashboards and share it with relevant people in your company? You can use Power BI and Azure Cognitive services, to perform these tasks – no advance programming expertise or guru level of technical knowledge needed!
The Text Analytics API is a part of Azure Cognitive Services, a collection of machine learning and AI algorithms in the cloud. It provides advanced natural language processing of raw text, and includes four types of analysis:
Sentiment analysis returns a sentiment score between 0 and 1 for each set of text, where 1 is the most positive and 0 is the most negative score. It is useful to find out what customers think of your brand or topic by analyzing raw text for clues about positive or negative sentiment. The analysis models are pretrained using an extensive body of text and natural language technologies from Microsoft. For selected languages, the API can analyze and score any raw text that you provide, directly returning results to the calling application.
Key phrase extraction – extracts a list of important words and phrases, for each document and is used to identify the main points, themes, and topics in your text. For example, for the input text “I had a wonderful trip to Seattle for a conference”, the API returns the main talking points: “wonderful trip”, “Seattle” and “conference”.
Language detection – can recognize a wide range of languages, variants, dialects, and some regional/cultural languages. It detects the language of the input text and returns a single language code (paired with a score indicating the level of confidence) for every document submitted on the request
Named Entity recognition – identifies and categorized various entities in the input text as places, people, organizations, currencies, date/time, etc. Well-known entities are recognized and linked to more information on the web.
Each of these operations may work with different languages. While the services support English for all operations, you will find a full and updated list of languages supported for various Text Analytics operations here.
All Text Analytics API Endpoints (operations) accept raw text data, commonly referred to as a document. The current size limit for each document is 5,120 characters, so you must break down any larger documents into smaller chunks for analysis. The number of requests processed per second or minute (rate limit) depends on your pricing tier. These pricing tiers start from the F0 Free tier (which allows five thousand transactions per month at no cost), going up to the S4 Standard tier (which allows ten million transactions per month for about 5,000 USD and charges 0.50 USD per one thousand transactions over that limit).
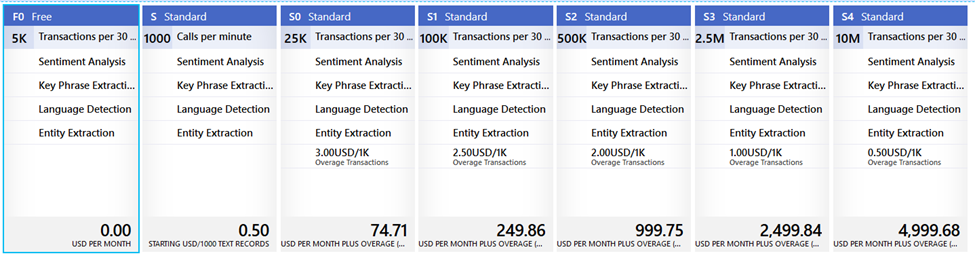
Figure 1. Azure Text Analytics pricing tiers
Please note that your bill will depend on your actual usage, in addition to the selected pricing tier. You can find additional details about Cognitive Services pricing here and details about the data limits for each pricing tier here.
Text Analytics Containers (these are standard Docker containers) allow you to run the Text Analytic APIs in your own environment, to meet your specific security and data governance requirements. These containers will not send any customer data to Microsoft. Only billing information is sent to Azure, using a Text Analytics resource on your Azure account.
Key Phrases and Sentiment Scores
Key Phrases and Sentiment Scores allow performing both qualitative and quantitative analysis on this data. Qualitative data consists of text – words and narratives. Analysis of this data includes extraction of key phrases and counting word frequency, identifying themes and highlighting concepts. While qualitative data analysis can be time-consuming and somewhat subjective, it can help provide a nuanced understanding of the survey participants perspectives. Word Cloud is one of the most popular ways to visualize Key Phrase frequency analysis. The next article in the series will explore the Word Cloud in detail.
Numeric Sentiment Scores are quantitative data points, extracted from the text. Quantitative data is numeric, and the numbers are clear and specific. You can easily aggregate them, apply filters, make charts and graphs and apply statistical techniques to analyze them. You’ll learn how to create several charts using the sentiment scores in the next article of this series. A combination of qualitative and quantitative techniques is quite useful with a well-rounded analysis and visualization of text data coming from Surveys.
Several options are available for using the Text Analytics APIs;
- Evaluate Azure Cognitive services for free, as a Guest with a 7 Day Trial
- Use Azure Cognitive Services for non-production workloads, through your free Azure Account
- Use Azure Cognitive Services for Production workloads, through your existing enterprise Azure account
You can always give it a try from your browser, using this link.
The following four easy steps will help you get set up for using the Text Analytics APIs to generate key Phrases and Sentiment Scores. The data from the Team Health Survey Results from a fictional company will be analyzed in this article
Step One – Set up an Azure Cognitive Services Resource
Assuming you have an Azure subscription/Account, set up Cognitive Services resource using the Azure Portal.
- Sign in to the Azure portal, click +Create a resource. Use the search bar to find text analytics.
- Select Text Analytics from the search results and hit the Create button.
- On the Create screen, enter the required details (please review the pricing details to choose a pricing tier that best fits your needs) and hit the Create button.
- Your deployment will begin and may take a few seconds to complete. Once it’s ready, click to open it and make a note of the Endpoint as well as the Access Keys. You will need them to Integrate Power BI with the Text Analytics Cognitive Service.
Please note that the subscriptions keys are used to access your Azure Cognitive service API and should be treated with the same precautions as you would take for your passwords. Store them securely and do not share them. Azure recommends regenerating these keys regularly for security (like changing your passwords at regular intervals).
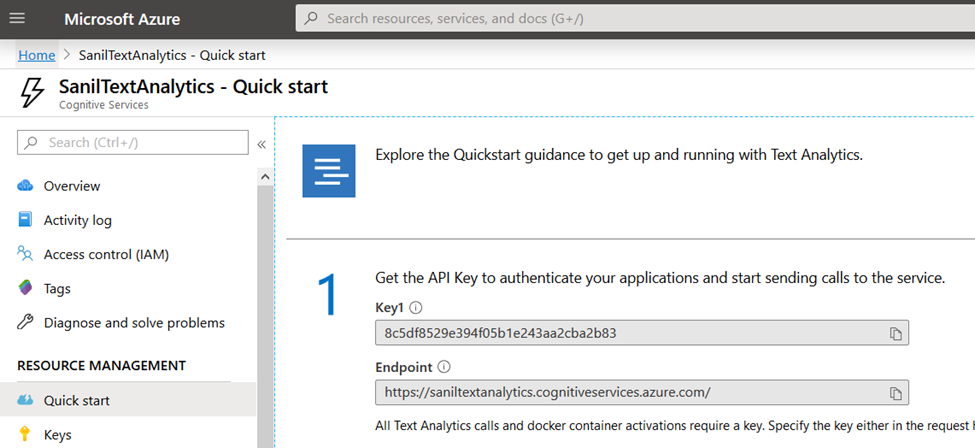
Figure 2. Endpoint and Text Analytics API
Step Two – Loading Data into Power BI Desktop
The Team Health Survey data is in an Excel spreadsheet and has four fields:
- Period (Year & Quarter number)
- Manager (Name)
- Team (Name)
- Response (the free form text responses from the Survey, to the question – How do you feel about your team’s health in this recent quarter)
Here’s a sample of the first few rows:
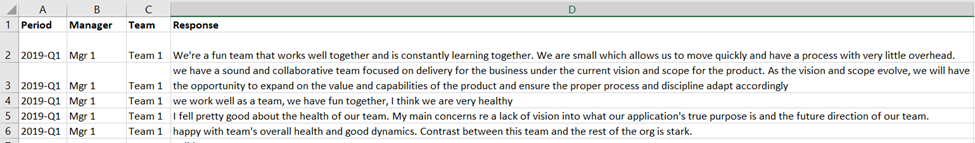
Figure 3. Raw data sample
Launch Power BI Desktop and navigate to the Get Data menu to load the Excel spreadsheet. At this time, you can also perform transformations like changing data types, lengths, precisions, etc. Power BI gives you a preview, using a small sample of the data set. Once loading is complete, you can see the loaded data by clicking on the Data View button on the left edge of the Power BI workspace. If you would like to remove all the extraneous columns, select the four with data, right-click and choose Remove Other Columns.
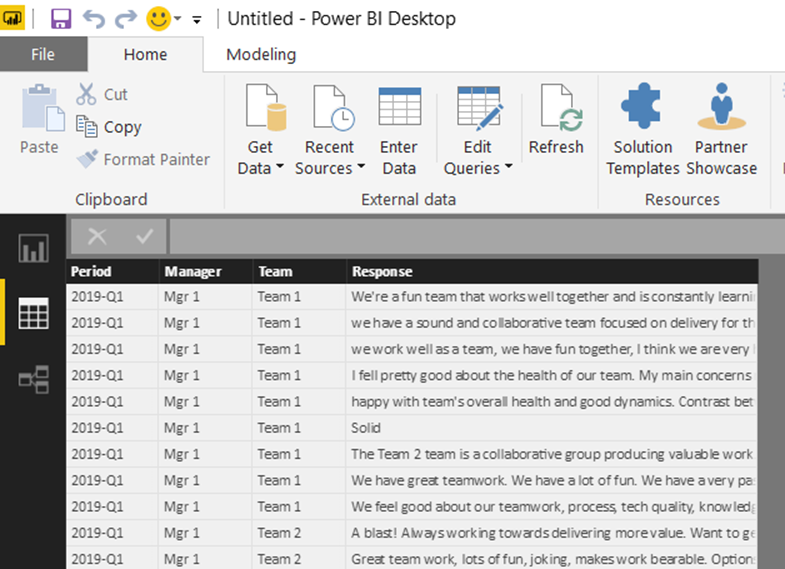
Figure 4. The loaded data
Step Three – Creating Custom Functions in Power BI
In this scenario, no other data preparation/transformation is needed, so the next step is creating the custom functions that will integrate Power BI and Text Analytics. The function receives the text to be processed as a parameter. It converts data to and from the required JSON format and makes the HTTP request to the Text Analytics API. The function then parses the response from the API and returns a response. Power BI Desktop custom functions are written in the Power Query M formula language, “M” for short. You can learn more about it here.
The solution required two functions:
- Key Phrases – which returns a string that contains a comma-separated list of the extracted key phrases.
- Sentiment Score – which returns a numeric score ranging from 0 to 1.
In Power BI Desktop, open the Power Query Editor window by clicking Edit Queries on the Home ribbon. Then click New Source Blank Query found on the Home ribbon. A new query will appear in the list – rename it KeyPhrases.
Open the Advanced Editor found in the Query group of the Home ribbon and replace any existing text with the following code. Remember to use your own API Key and Endpoint.
|
1 2 3 4 5 6 7 8 9 10 11 12 |
// Returns key phrases from the text in a comma-separated list (text) => let apikey = "YOUR_API_KEY_HERE", endpoint = "YOUR_ENDPOINT_HERE/text/analytics/v2.1/keyPhrases", jsontext = Text.FromBinary(Json.FromValue(Text.Start(Text.Trim(text), 5000))), jsonbody = "{ documents: [ { language: ""en"", id: ""0"", text: " & jsontext & " } ] }", bytesbody = Text.ToBinary(jsonbody), headers = [#"Ocp-Apim-Subscription-Key" = apikey], bytesresp = Web.Contents(endpoint, [Headers=headers, Content=bytesbody]), jsonresp = Json.Document(bytesresp), keyphrases = Text.Lower(Text.Combine(jsonresp[documents]{0}[keyPhrases], ", ")) in keyphrases |
After saving the KeyPhrases function, follow the same steps and create a SentimentScore function, using the following code in the Advanced Editor window
|
1 2 3 4 5 6 7 8 9 10 11 12 |
// Returns the sentiment score of the text, from 0.0 (least favorable) to 1.0 (most favorable) (text) => let apikey = "YOUR_API_KEY_HERE", endpoint = " YOUR_ENDPOINT_HERE/text/analytics/v2.1/sentiment", jsontext = Text.FromBinary(Json.FromValue(Text.Start(Text.Trim(text), 5000))), jsonbody = "{ documents: [ { language: ""en"", id: ""0"", text: " & jsontext & " } ] }", bytesbody = Text.ToBinary(jsonbody), headers = [#"Ocp-Apim-Subscription-Key" = apikey], bytesresp = Web.Contents(endpoint, [Headers=headers, Content=bytesbody]), jsonresp = Json.Document(bytesresp), sentiment = jsonresp[documents]{0}[score] in sentiment |
You should now see both custom functions, under Queries on the left-hand side.

Figure 5. Custom Functions in Query Editor Window
Step Four – Invoking the Newly Created Custom Functions
You can now use these custom functions to extract key Phrases and generate a Sentiment Score for each of the text responses and store them as new columns in the Table.
In Power BI Desktop Query Editor window, switch to the TeamHealth_RawText Query and select the Add Column ribbon, then click Invoke Custom Function. The Invoke Custom Function dialog appears. For New column name, enter KeyPhrases. For Function query, select the custom function you created, KeyPhrases. A new field appears in the dialog, text (optional), asking which column to provide as input values for the text parameter of the API. Select Responses from the drop-down menu and click OK.
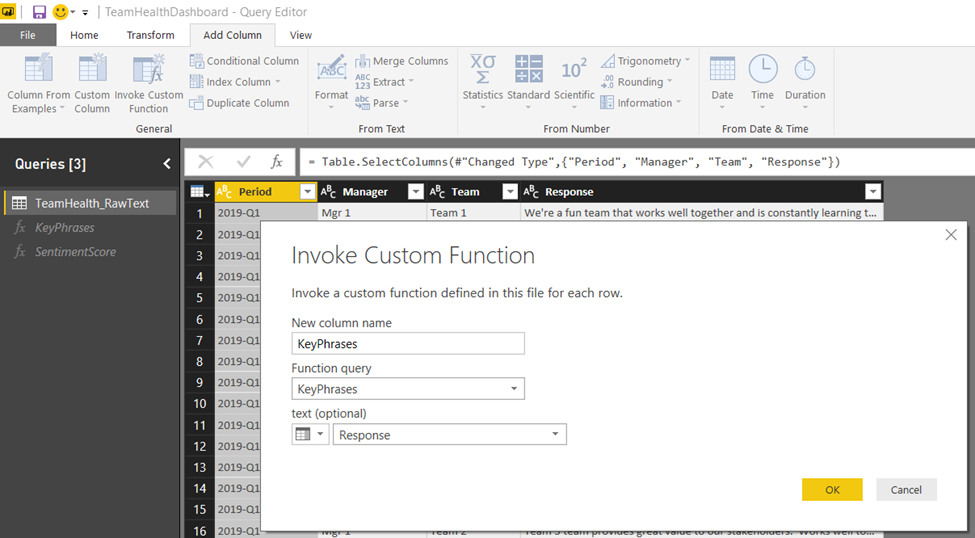
Figure 6. Invoking the KeyPhrases custom function
After you close the Invoke Custom Function dialog, a banner may appear asking you to specify how to connect to the Key Phrases API. Click Edit Credentials, make sure Anonymous is selected in the dialog, then click Connect. Another banner may appear asking you to provide information about your data sources’ privacy. Click Continue and choose Public for each of the data sources in the dialog and Save. Now Repeat these Invoke Custom Function steps for loading another new column: SentimentScore.
You may want to limit the SentimentScore field to two decimal places. Right-click the column and choose Change Type Decimal Number. Then right-click the column and select Transform Round Round… Specify 2 decimal places.
After closing all the dialog boxes, go to the Home ribbon and click Close & Apply. Power BI will need a few minutes to process these queries.
Once all the processing is complete, your Data View will now show the table has been updated with two new fields, that are loaded with KeyPhrases and SentimentScore for each Response text.
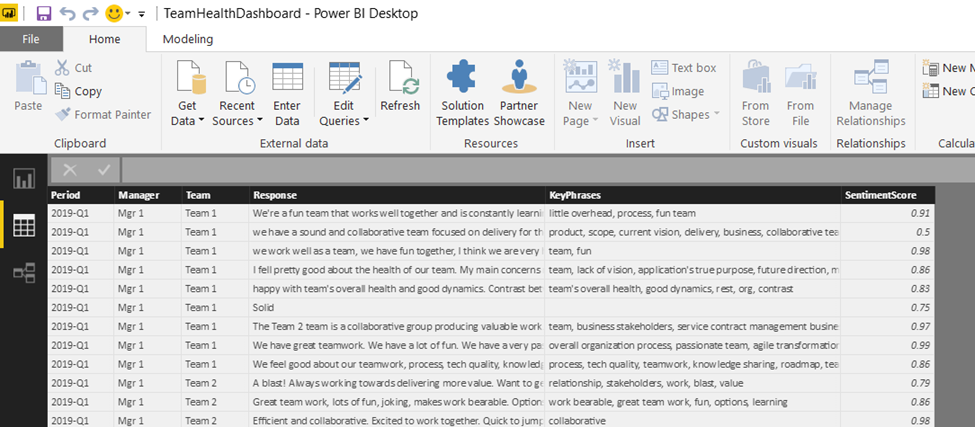
Figure 7. Power PI Data View with KeyPhrases and SentimentScore fields loaded
The data table now updated with KeyPhrases and Sentiment scores is ready for use in further analysis and create impactful visualizations in Power BI.
At this time, you can log into the Azure Portal and review the utilization metrics of your Text Analytics Service. You should see a spike in the chart for Total Calls, around the time Power BI was processing your data by invoking the Text Analytics API.
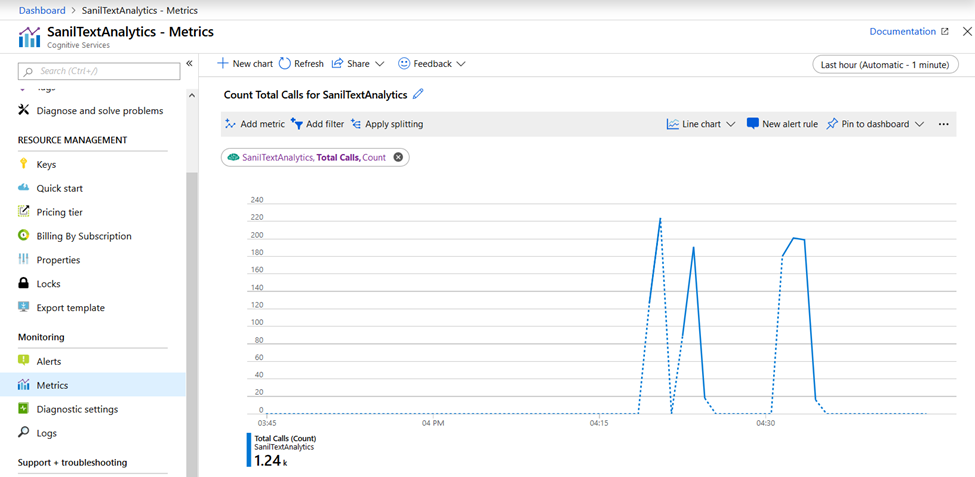
Figure 8. Azure Portal – Utilization Metrics for your Text Analytics Service
Conclusion
This article demonstrated how to do a sentiment analysis using Power BI and Azure Text Analytics. The next article of this three-part series looks at qualitative and quantitative analysis techniques for this data in Power BI. It demonstrates how to create a word cloud, and several statistical charts to help with analyzing this data, extract business value and use Power BI visualizations to narrate a meaningful story about this data.
References:
- Qualitative or Quantitative Data – https://cyfar.org/qualitative-or-quantitative-data
- Quantitative Data Analysis – https://cyfar.org/analysis-quantitative-data
- Azure Cognitive Services Text Analytics – https://docs.microsoft.com/en-us/azure/cognitive-services/Text-Analytics/overview
- Power BI Desktop – https://powerbi.microsoft.com/en-us/desktop/
- Text Analytics with Power BI – https://docs.microsoft.com/en-us/azure/cognitive-services/Text-Analytics/Tutorials/tutorial-power-bi-key-phrases
Load comments