
Profiling .NET application performance
Introduction
Performance is a concern for all but the simplest of applications. Making your applications perform well seems a simple enough ask, but it can be something of a black art. This is where profiling comes in.
Profiling an application allows a developer to glean valuable metrics, such as memory usage of a given object and execution times of specific methods, to provide detailed and valuable insight into how an application is performing. Even with the best design and the best developers, issues related to performance or memory management that are very hard to track down can be introduced, particularly in large, complex systems consisting of multiple layers and deep object graphs.
There are many profiling tools on the market, but this article will concentrate on ANTS Profiler from Red Gate Software (www.red-gate.com). You may also be aware of a free profiling tool available from Microsoft called the CLR Profiler. A brief comparison and summary of the differences in these tools will be presented.
ANTS Profiler and the CLR Profiler
There are many factors that influence the performance of your applications, but the primary factors are efficiency (speed) and memory usage. ANTS Profiler is a general-purpose profiler that measures efficiency and memory usage of any .NET application. Application types supported (as of Beta 2.1) are:
.NET desktop applications, .NET web applications, .NET service, and COM+ server applications.
In contrast, the free CLR Profiler tool offered by Microsoft can only profile desktop and web applications. Also, the CLR Profiler is primarily aimed at profiling memory usage, specifically the .NET-managed heap usage. The CLR Profiler provides no real performance measurement, and the metrics produced by this application squarely target the memory usage and allocation patterns of the managed heap during your applications execution.
While both tools can be classified as profilers, they are clearly aimed at different targets, and there is no reason why they could not be used in conjunction with one another to help determine what is happening with your application.
Let’s profile
After loading, ANTS Profiler presents the user with a fairly simple screen with only a few options, then launches straight into the project wizard.
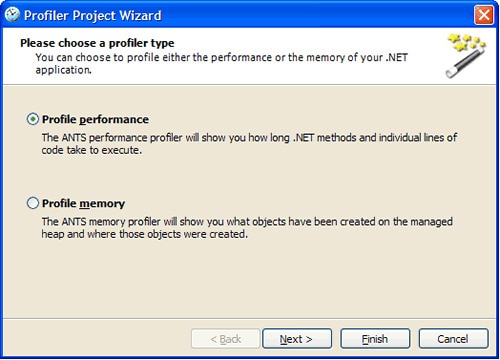
Figure 1
For our initial profiling exercise, we will look at the speed of our application, so we want to profile the performance. Selecting the “Next” button brings up another window to select the type of application we want to profile, as shown below:
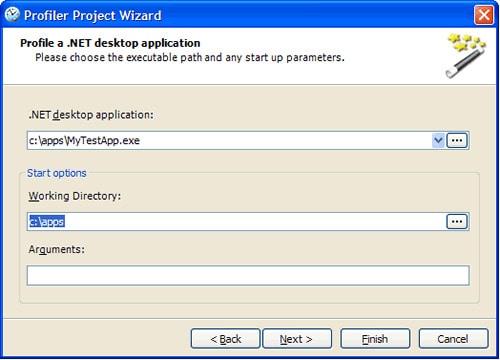
Figure 2
For the purposes of this exercise, we will profile a desktop application. Selecting “Next” shows a window allowing you to select your application to profile and any arguments it may require.
Figure 3
Selecting “Next” from this screen allows you to choose whether you will be profiling all .NET methods, only methods that have source code, or a custom definition/filter so you can fine-tune what is profiled. This is shown below:
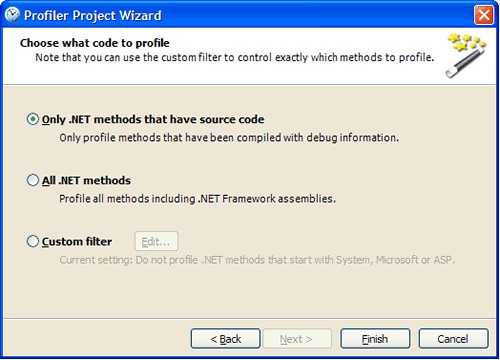
Figure 4
Typically, you will want to profile only .NET methods that have source code (i.e., compiled with debug information), which will usually be only the methods that you have developed. Profiling all .NET methods means you will get a lot more profile information, as all of the methods in the .NET framework assemblies will be included.
The “Custom filter” option allows you to really fine-tune what is profiled and presents you with a more specific view of your application. This option would typically be used after a general profile is completed and you have determined if certain methods need to be examined more closely without any other information.
After you select “Finish,” you will be prompted to profile your application. Selecting “Yes” will launch your application. If you are profiling a console application, let the application run until completion. If you profiling a desktop/Windows form application, perform the functions you want to measure and then end the application.
The application will run slower than it normally would. This is to be expected when an application is profiled; the profiler must insert its “hooks” within the runtime and code to measure each methods execution.
When your application closes, ANTS Profiler will begin collating the profiling data. This is usually a very short process, in the order of a couple of seconds, and you will be presented with a screen similar to the one shown below:
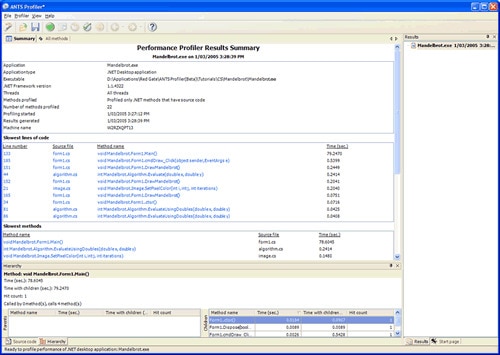
Figure 5
When conducting performance analysis on an application related to efficiency or speed, one of the first things to ask is: “What are the slowest methods being executed?” This will be the first area of improvement to enhance the performance of your application.
As shown in the screenshot above, the middle section of the screen displays a scrollable window that contains general information about the application, and more importantly, sections describing (in descending order), “Slowest lines of code,” “Slowest methods,” and “Slowest methods with children.”
As the name suggests, the “Slowest line of code” section displays the 10 lines of code that took the longest to execute, in descending order. Using this, it’s easy to see at a glance where the worst-performing code is in your application. This section also displays the line number, source file, method and time the process took to execute. Each line is actually a link you can click on to display further details about its execution.
Similarly, the sections with the “Slowest methods” and the “Slowest methods with children” display the 10 slowest methods of execution, and each entry can be clicked on to display further detail at the bottom of the screen. These details are the hierarchy of calls made from the method that was selected, and also the relevant section of source code from the selected method. This is shown below:
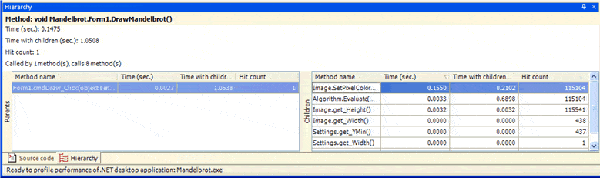
Figure 6
From the screen shot in figure 6 above, it is immediately obvious that once the “cmdDraw_Click” event is fired (which happens to be after the “Draw” button on a form), a number of “child” methods are executed. The child methods, listed to the right in figure 6, are sorted by time, with the child methods taking the longest time at the top of the list.
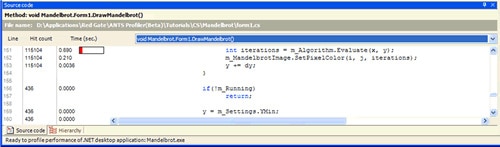
Figure 7
Figure 7 above shows the associated code window that is displayed by clicking on the “Source Code” tab at the bottom of the screen. Here it is clearly visible which method is taking a large amount of time to execute. The red bar indicates the slowest lines in the current source code file. Obviously, parent methods that comprise child methods would indicate a longer time as they are calling up the child methods. What we are doing is drilling down to see what methods are really slowing the application down.
Clicking on the “Algorithm.Evaluate” method in the child window in figure 6 will immediately update this window to look like the figure shown below:
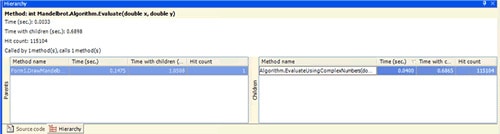
Figure 8
Switching to the “Source Code” window by selecting the “Source Code” tab at the bottom of the screen shows the real performance offender, as shown below:
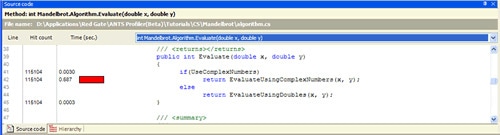
Figure 9
From here, we can see that the method “EvaluateUsingComplexNumbers” is taking a large proportion of time to execute. Selecting the drop-down list presents a list of methods from which we can select as shown below:
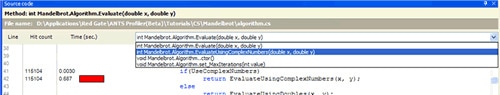
Figure 10
We can drill down into the “EvaluateUsingComplexNumbers” method by selecting it from this drop-down list, and the code window is updated accordingly as shown below:
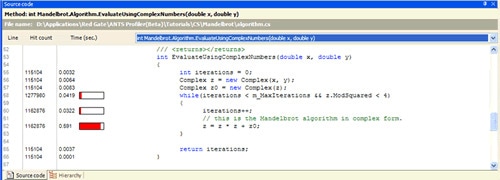
Figure 11
We can see at a glance that a majority of the time is taken performing the computation on line 62. In order to alleviate this particular performance issue, we might want to consider changing the definition of the “z” and “z0” variables from “complex” to “double.”
So far we have been looking at the summary of results presented to us by the profiler. Additionally, we can view the results of all methods that have been profiled, perform sorting on the timing of those methods, and get an overall view of the performance of individual sections of the application, all with links to the relevant source code as shown below:
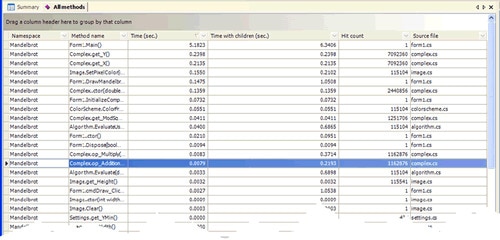
Figure 12
And so…?
So what have we achieved? Within approximately six mouse clicks, we have been able to identify and determine a performance bottleneck within the application, and also determine a possible resolution to the issue. Compare this to manually going through the code to determine where the possible performance issues might be. This typically requires an in-depth knowledge of the application and calls for a great deal of effort to track down what might be the cause or causes.
While I have shown a relatively simple example, imagine the time and effort required in traversing huge amounts of code in a complex application, where the time taken to analyse multiple sections of code could result in weeks or even months of effort.
What about web applications?
Like most profilers, ANTS Profiler can be used for web applications. Exactly the same set of metrics is presented and the same level of ease is present when drilling down and determining where your performance problems lie. The only noticeable difference is the profiler must stop the Internet Information Services (IIS) service so that it can be restarted with the profiling function enabled. This embeds the profiling “hooks” so that the profiler can gather information about the execution of methods within the application.
A browser window is then shown where you can access the application, typically on your local machine, and perform usage scenarios based on what you are trying to measure. Once the browser is closed, the performance data is collected and presented in the views that we have previously discussed.
The results are in
When a profile is generated, whether it is a performance- or memory-related profile, the results are gathered and stored as a set. There can be multiple sets of results generated, each of which is displayed on the right-hand side of the main screen. This is shown in figure 5 at the start of this article. Each set of results can be saved individually and is stored separately from the project that generated them.
Typically a project is set up to define the application location, the type of application (web, desktop, service etc.), and the type of profile to generate (memory or performance). This profiler project can be executed multiple times to generate multiple result sets. As mentioned previously, each of these result sets can be saved independently from the project, allowing easy management of profile metrics, and easy comparison and analysis.
You would typically generate a base or initial profile and perform some degree of optimization and/or modification. Then you would regenerate the profile metrics with your changes to the application, and compare the different result sets to determine if an improvement was made and if there are any areas of concern to address.
My memory ain’t what it used to be
So far we have been concerned with performance profiling. The other main area to profile is memory usage. Memory profiling follows a pattern similar to performance profiling, but requires you to take different steps. The details of memory profiling will be discussed in the next article on profiling.
Conclusion
Application profiling is a valuable tool to determine the efficiency of your application and assist in achieving peak performance and operating efficiency. Using ANTS Profiler as presented in this article, you can quickly gauge exactly where your application takes the longest to execute, and drill down to the actual line of code that is causing the problem in just a few mouse clicks.
This article has presented only a small portion of what can be achieved with ANTS Profiler. The enormous savings in time and effort easily justify the small cost of this product. Without profiling your applications, all performance and efficiency measurements are, at best, close approximations and, at worst, incorrect assumptions.
This document contains proprietary information and is protected by copyright law.
Copyright © 2026 Red Gate Software Limited. All rights reserved
Load comments