
The Platform for the slow train?
When building an application, developers tend to use a plethora of components, libraries and services to make their job easier. Good libraries and services make development more straightforward because they provide a simplified interface to a feature. The advantages of using libraries/services are in the ease, and speed, of development. One disadvantage of libraries/services is that they do not always perform as well as a hand-coded alternative.
As a working programmer I am interested in building applications quickly, but without compromising the performance of the final system. In this article, I’d like to show ways of doing this, using a number of examples from web applications I have built. Towards the end I will describe some techniques I have used to trade-off ease-of-use against performance in my own .NET libraries.
This isn’t supposed to be an official text on performance article (see this 397 page free eBook for a more comprehensive guide), but more of a description of my own journey of exploration into performance issues and the insights and the decisions I came to.
Categories of performance costs
Before we look at the examples, it is worth setting the scene, as performance can be a slippery thing to understand. In this article will refer to ‘cost’ or ‘costs’ in relation to performance. In most cases I use ‘cost’ to mean compute time and/or the elapsed waiting time for a particular feature takes to run to completion. Here are the three performance cost categories to I will focus on in this article.
- First-use costs: This is the compute/elapsed time that happens when the feature is first used. First-use costs happen in lots of libraries. In my world ASP.NET MVC, Entity Framework, etc. all have significant first-use costs because they are setting things up so that the per-use costs are lower.
- Per-use costs: This is the compute/elapsed time you pay on each use of the feature, minus any first-use cost. This is the raw speed of the particular feature. When using libraries we often relate thiscost to the cost of doing the same function ‘by hand’, i.e. where we bypass the library and write our own specific code to do the function.
- Scalability costs: Scalability costs are more complex as they are a combination of the number of ‘typical’ users a web site can support with a given response time. On top of that we have peak demand handling, as when popular tickets go on sale on an online ticketing site.There are many techniques and architectural approaches for handling scalability, but I will not spend any time on these in this article.
All performance is relative…
Before we dive into the example we need to understand that the performance level we need is very dependent on the type of business application we are building, or even what part of the application we are working on. Let me give you some examples.
I have built quite a few applications for conducting geographic modelling to help healthcare providers plan services. This work is confidential so each project is standalone and has only has maybe ten or twenty users. Therefore performance tuning seems overkill. However this modelling application has some heavy visualisation, with maps, layers, drilldown etc. Therefore, even though I have few users, I still need to make the visualisation part very responsive otherwise it would make the visualisation part slow and ‘clunky’.
At the other extreme is building large e-commerce or social sites like Amazon or Facebook. Here the sheer number of users means that the scalability costs need very careful handling, often through complex architectures to provide a good user experience. In fact tests at Amazon in 2007 showed that: ‘every 100 ms increase in load time of Amazon.com decreased sales by 1%’, see this article for a study of the effect of slow web performance.
It is often a balance between performance and development time. In the free EBook by Microsoft called ‘NET Technology Guide for Business Applications‘ they look at the needs of different types of applications from small to medium business applications up to large, mission-critical business applications. This book points out for small to medium-sized business application than productivity and lower costs come much more to the fore, which large applications it is Quality of Service, or what I refer to in this article as scalability costs.
Looking at performance
We’ll run through some example, starting with easier, top-level performance and progressively digging down into the code.
NOTE: In the examples below I will be using milliseconds (ms) as the primary unit of time, which is 1/1000th of a second, as measured on my PC.
Example 1: Overall web site performance
When a web site user presses GO or clicks a menu item, they care a lot about getting a result in a ‘reasonable time’. The ‘reasonable time’ is different for each application: What would be fine for social media apps wouldn’t satisfy a stock trader who’d want ‘instant’ responses. In addition, that ‘reasonable time’ should stay reasonable even when lots of other people are using the site.
There are many of ways of measuring web site performance, but I will start with an overview using a web browser development tool, in this case Chrome Developer Tools. Browser tools like this are really helpful with lots of features. I will only be covering a small part of what they do but you can find more at the link, evaluating network performance.
Example 1a: Per-use performance
For my example I will show you a Network trace from one of my simple example web sites, samplemvcwebapp.net, when I access the ‘Posts‘ page. In this example I am trying to measure the per-use cost, i.e. the system has started and settled down and it is using normal browser caching.
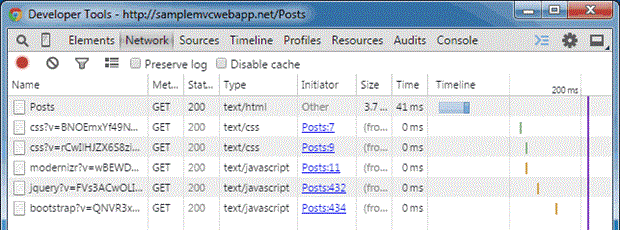
This Network trace above shows the display took just over 200 ms to load (the purple line to the right). The ‘Posts’ page, see top row with name ‘Posts’ on the left took 41 ms to arrive from the MVC application, most of that time the browser was waiting, as shown by the lighter blue part of the timeline.
On first glance, the server side seems reasonably fast – it is a tiny database so it should be. However it did show me that I had left in some CSS and JavaScript files that I was not using, and they were wasting time. This site does not warrant performance tuning as it is only an example site. However for this article I updated the application to improve the CCS/JavaScript download parts and the new Network view from Chrome is below.
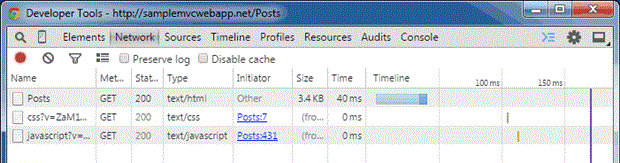
You will see in the new trace that the ‘Posts’ part still takes about 41 ms, but now there is now only one CSS and one JavaScript download. The effect is that the display is ready in about 170 ms, a 30 ms improvement on the previous trace.
Note: For anyone interested in improving web performance on mobiles, which may be working over 3G or even 2G, I would recommend the book ‘Mobile ASP.NET MVC 5‘ by Eric Sowell which has an excellent chapter on the subject.
Example 1b: First-use performance
The example above was for a web site that was live and I had visited it before. This means that a) the web application had started some time ago so there were no first-use costs. It also meant that all of the CSS and JavaScript of the files were already cached by my browser.
However, if I restart the web application and I am the first person to look at the ‘Posts’ page then the timings are very different. Using the same Chrome Network view on the first access to the ‘Posts’ page took 5.5 seconds, instead of the normal 40 ms. Why is that?
In this example application I use a number of libraries that have a first-use cost. Namely Microsoft’s Entity Framework (EF) and the open-source library AutoMapper. I know from experience that these both take some time to set themselves up on first use, especially EF.
The different between these two times, 40 ms (which is 0.04 seconds) and 5.5 second shows how important it is to look at first-use performance separately, as it shows a completely different picture.
There are ways to mitigate this first use cost, such as starting EF and building all the AutoMapper mappings into the MVC App_Start path. However in this example I did not do that so the first-use cost only happens when I access the Posts data, which is the first time EF and AutoMapper are called.
Finding from these results
Looking at the page access times provides an excellent overview of what the users will see and experience. It does not include everything, as it does not take account of the user load, or scalability issues, but is a powerful first tool to look for performance issues in both the server and client parts of the system.
I do not have the space to cover scalability costs in this article, but I would point you to another article I wrote for Simple-Talk called ‘The .NET 4.5 async/await feature in Promise and Practice‘. This looks at improving scalability by using .NET 4.5’s new feature, async/await, which releases resources while waiting to allow other users to use the thread pool.
I used Chrome to look at the page load times, but there are many tools that can look at page access time, such as Glimpse or Azure Application Insight. However I tend to use the Chrome Developer Tool for the following reasons:
- It is really easy to access, just hit F12 when Chrome is running. I use Chrome for debugging JavaScript or CSS style problems so the development tools are often up anyway.
- The overview puts everything into perspective: if the page takes more than 100 ms to load then trimming 0.1 ms off a library is a waste of effort.
- It works on deployed sites, i.e. it does not need anything inside the application to work.
Example 2: Inside the SampleMvcWebApp Posts performance
While Chrome is great for an overview, it cannot show you what is happening inside the MVC application itself. For that you need a more powerful performance profiler. There are a number of these around, from ones inside Visual Studio (features depend on version of VS) and commercial profilers such as dotTrace from JetBrains and RedGate’s ANTS profiler. Here is a good StackOverflow answer that compares profilers.
I got into trouble in one of my other Simple-Talk articles because I didn’t have a profiler and misunderstood how Entity Framework worked in one area. The Simple-Talk Editor took pity on me and gave me a copy of the ANTS profiler which has opened up a whole new world to me.
Let me start with the same example I showed in Chrome above, the listing per-use listing of the Posts. It I wanted to see where the time was going I would need to dig inside the application code. The ANTS profiler allows me to do that. Below is the ANTS trace, edited slightly to fit the page, of the MVC action PostController.Index.
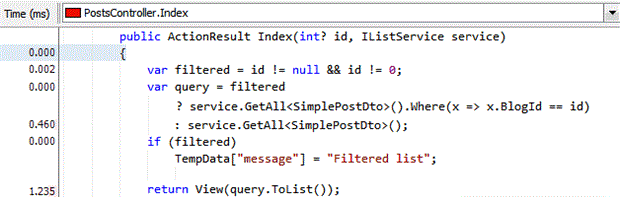
You will see that the service.GetAll method, which is part of my GenericServices library, took 0.46 ms to run. The actual read of the data in the return View took 1.234 ms – this is fast because the data is likely to be in memory.
The Chrome timing for the whole process was 41 ms, so 2 ms for the Index action is pretty small which tells me that spending time improving this part of the application isn’t worth the effort.
Example 3: Tuning SQL calls.
The last example is a simple database access on a small database. To ‘stress test’ my GenericServices library I built an ASP.NET MVC application using and existing Microsoft’s sample database called AdventureWorksLT2012. (You can read all about it in the two-part Simple-Talk article: part1: Data Layer and part2: User Interface).
This had a much more typical database access, with filtering, aggregation, combination etc. I use Microsoft’s Entity Framework (EF), which makes accessing the database much easier. The access in question was a list of customers, with the summed total of all the orders they have placed so that the user could see how much they had bought in the past – see illustration below:
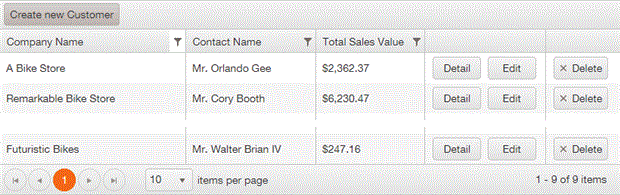
The list above is produced by the Kendo UI Grid component. This takes an IQueryable request and adds paging, sorting and filtering to the query. The Kendo grid makes two database requests: one for the actual data it needs in a page and another to count the total number of items in the list to work out paging. For this example I filtered on Company.Name containing “bike” to make the query more complicated.
Note: You can find a full description of how this list was created in my previous article ‘Using Entity Framework with an Existing Database: User Interface‘. There is also an example web site called SampleMvcWebAppComplex which goes with this article.
I will start with a brief outline of what I did and then show you a table and chart of the performance improvements these steps provided. The four iterations are:
- Original: Find out what I had now. First I had to find out what I had at the start of the process, called ‘Original’ in the table, and whether it needed optimising. For that I used ANTS profiler to look at the two T-SQL commands that EF produced from this LINQ query. The query definitely did not look nice (see table below) as it calculated the sum twice, once to see if it was null or not and then again if it was not null.
- Version1: Check for no sales first. I then changed the code to check is there are any sales first, which removed the double calculation of the sum. This was fine, but I noticed that needed to calculate the ‘HasBoughtBefore’ property twice.
- Version2: Use LINQ ‘let’ command. I swapped to using a different format of LINQ command which allowed me to calculate the ‘HasBoughtBefore’ property only once. This produced an improvement.
- Direct SQL: Comparison with direct SQL commands. Finally Andrew, the Editor at Simple-Talk, provided me with hand-written SQL commands that produced the same output, but in half the time. These provide a useful comparison. However, as I explain below, using them for real would take a lot of development work.
Below are a table and chart with the results. The first three measured by ANTS profiler with the Direct SQL measured by SQL Server Management Studio. The ‘Effort (hr)’ column gives my estimate of the extra development effort needed to investigate and improve each iteration. The ‘Site Link’ links allow you to see the first three in action on the example web site, SampleMvcWebAppComplex.
Note: the Total SQL figures represent the per-use cost of each query. They are approximate as these figures do vary slightly with each access.
| Type | Total SQL | %improve | Effort (hr) | Site link |
| 1. Orginal | 32ms | 0.0 | Link to page | |
| 2. Version1 | 25 ms | ~20% | 1.0 | Link to page |
| 3. Version2 | 20 ms | ~35% | 1.5 | Link to page |
| 4. Direct SQL | 12 ms | ~60% | 10.0 |
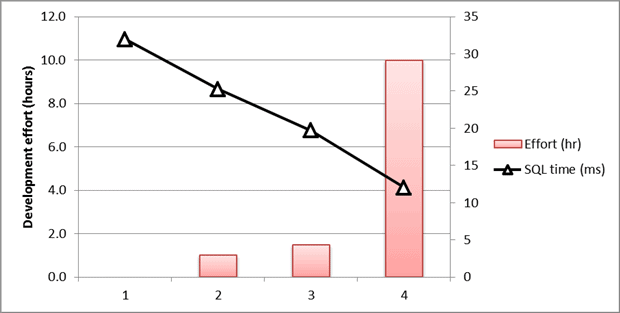
I should explain why the ‘4. Direct SQL’ would have taken so long to develop. Replacing the use of IQueryable would require the writing a custom server binding for the Kendo Grid. This would take the user’s filter, sort and paging requests and turn them into SQL code. This would take quite a considerable amount of development effort – I estimate 10 hours even assuming the filter options available to the user were limited.
Findings from these results
Firstly you will notice that the chart shows an almost exponential rise in effort against a linear improvement in per-use performance. However this does not tell the whole short as I have not looked at the saleability costs. A study of the execution plans in ANTS profiler show that the early commands make very inefficient use of SQL and therefore will not scale well, i.e. the faster commands also have better scalability costs.
I would reiterate that performance is relative. If this is an internal business application then scalability may not be an issue. In fact speed of development most likely is important. However if this is a large-scale application with lots of users then scalability is definitely an issue. Then you will need to spend a lot of development time looking for and removing bottlenecks like this so that the site is responsive.
Note: For those of you using Entity Framework (EF) and do not have a profiler then there is another way of capturing the SQL commands and their timing. In EF version 6 a new command allowing developers to intercept database commands was added which can log the command and its execution time, though it doesn’t allow you to look at the execution plans in order to gauge scalability.
Example 4: Improving the performance of one of my own .NET libraries
My experience is that a good software library has to be easy to use, otherwise it does not speed up development enough to warrant learning how to use it. The problem is that making a library easy to use can add an extra performance overhead. This is the trade-off that nearly every developer faces if they create a library.
I have built a number of libraries to help me in building web applications quickly. In this example I will look at one of my libraries called GenericActions which provides a facade/adapter interface between my business logic and the presentation layer.
In GenericActions the balance comes around the complexity of the Generic type definitions of its services. Without any simplification creating the service is hard for developers and not very easy to use with Dependency Injection. See below for the standard call before simplification:
|
1 2 3 4 |
var service = new ActionService<DtoIn, BizIn, IBizAction, BizOut, DtoOut> (db, new BizAction(db)); var dataIn = new DtoIn(some data here ); var result = service.RunAction(dataIn); |
I therefore added a much simpler service type definition and had the library decode and create the correct Generic type at runtime. This makes the code for using the library much nicer to use, see below:
|
1 2 3 |
var service = new ActionService<IBizAction>(db, new BizAction(db)); var dataIn = new DtoIn(some data here); var result = service.RunAction<DtoOut>(dataIn); |
This is great for the programmer, but it does have a performance impact. Therefore I started to really investigate this performance issue and I felt I had dropped down Alice in Wonderland’s Rabbit hole! The ANTS Performance Profiler really came into its own as I could finally see what was going on inside the .NET code, and it turned out to be a lot more complicated than I thought.
Note: You can read a detailed account of how I use dynamic types with Generics in this article on my blog.
Example 4a: Per-use performance improvements
When I designed the GenericAction library I had some idea of where the performance hot-spots were going to be. I thought it would be around the decoding and creation of the runtime generic and I was partly right.
I used the profiler to show me the per-use ‘hot spots’, i.e. the method calls that took the longest. I then worked on a caching scheme using a private, static ConcurrentDictionary. Having the profiler allowed me to tune the caching scheme, which turned out to be a rather iterative process. Here are the steps I went through before I got to the final algorithm.
- My initial attempt cached all calls, including the simplest state that did not need to create anything. This actually slowed down the simple state, so I moved that outside the cache.
- The cache lookup key was a combination of a number of Types, enums and bool so I initially build a struct for the Dictionary key. However this was surprisingly slow.
- I then swapped to using string.Format to build a string key, which was better.
- string.Format looked a little slow so I changed to using string.Concat, which was faster.
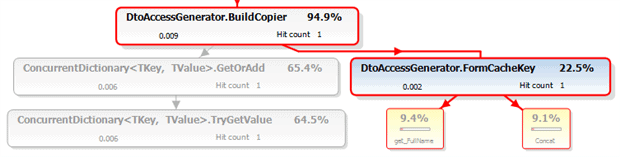
Here is the final call tree for generating an instance of one of my runtime-derived typed generic class that is already in the cache. The times are in milliseconds, so you can see this is pretty fast.
I include performance testing in my Unit Tests, using a simple Stopwatch timing over multiple calls. This allows me to look at difference code options and their performance. Using this technique I could measure the difference between the cache on or off for a repeated call to business logic are:
| Cache OFF | Cache ON | Improvement |
| 0.0367 ms | 0.0179 ms | 205% |
One final point. I had used dynamic in some places where object would have been sufficient, i.e. where I was presenting the data to a MethodInfo.Invoke call. It turns out there was a small, but measurable cost to using dynamic here. Using object instead gave a 10% to 20% improvement. I would not have found this without profiling performance and digging into what was happening.
Example 4b: First-use costs
The area that really got interesting is the first-use costs, which is large – about 400 ms on my system using .NET 4.5.1. It turns out that is due to me using dynamic types to call certain methods in the runtime created generic types, and possibly the set up of my PC (see comment later). The call graph is too big to include as a picture, so here is a PDF call graph of what is happening.
Note: I am not an expert on the Dynamic Language Runtime and I would refer you to Simon Cooper’s series on ‘Inside DLR’ (Dynamic Language Runtime) starting with ‘Inside the DLR – Callsites‘ and then look at ‘Inside DLR – Invoking methods’ which describes the caching of methods.
This first-use cost seemed quite high so I actually forked the project and built a version that uses Reflection’s MethodInfo.Invoke method and compared them. There are a few things I learnt from this exercise:
- While reflection has a much lower first-use cost using the dynamic approach is faster on the per-use cost.
- The first-use cost of using dynamic only happens on the first even use of dynamic in the application, i.e. once for the whole application.
- Dynamic is much easier to use, especially on methods returning a type.
Having spent a lot of time on this issue I then had an update for my system which included a .NET 4.5.2 update. Having installed that update the first-use cost of dynamic seems to have dropped from 400 ms to 5 ms, which is impressive. The .NET 4.5.2 release notes do not say there is a change to DLR so maybe it was just reinstalling the .NET library.
A final warning: architecture matters
Before I leave the subject of performance tuning I need to give a warning. I have read the phase “don’t ‘performance-tune’ too early” a few times and I understand what they are getting at. However if you have picked the wrong approach/architecture for your application at the start then it’s going to be very difficult to speed up at the end.
This isn’t about big, up-front designing but more about spotting the key elements that are going to help you build a relevant, robust and scalable application quickly. That way you won’t find yourself down a blind alley ten sprints into the project, or, worse still, you find the application is just too slow when you start to deploy even with performance tuning. I like a quote from Simon Brown:
“Big design up front is dumb. Doing no design up front is even dumber.”
For .NET web applications there is a mountain of good practice and excellent libraries for everything from logging to application scaling. You should read about different approaches and try to understand how and when you should use these approaches. I would recommend a book called ‘Microsoft .NET: Architecting Applications for the Enterprise‘ for a good overview of different architecture approaches in the .NET world. Also, if you are using Azure then the blog post ‘Scaling Up and Scaling Out in Windows Azure Web Sites‘ or the more recent ‘How to Scale an Application‘ gives a useful overview of scaling options.
My Visual Studio project folder is littered with projects starting with ‘Try…’ where I build a very small test application focusing on the key technology I plan to use. I might spend just a few of hours or a few days on a ‘Try…’ project, but that time may well save me from hitting brick wall weeks or months later.
Conclusions
We are often balancing performance against ease of development when we decide to use certain libraries or services. Part of the skill of the developer is to understand, and if possible to measure, what those trade-offs are in order to make the right decision. A small amount of thought and experimentation at the start of a project can help you pick the right route to a successful and well-performing project.
To show that this is a practical way of tackling performance, I’ve described a range of examples of how I have inspected the performance inside my applications. I started with a high-level view of the web applications, then we looked at database access tuning ending with the more complicated area of tuning your actual code. I hope these examples and links will help you in your own balancing of ease-of-development against the required performance of your final applications.
This document contains proprietary information and is protected by copyright law.
Copyright © 2026 Red Gate Software Limited. All rights reserved
Load comments