
Microsoft introduced two PERCENTILE analytic functions (PERCENTILE_CONT and PERCENTILE_DISC) in SQL 2012. You might be asking yourself how these can be used in earlier versions of SQL. The answer of course is that they cannot. However we will try to offer you equivalent implementations in earlier versions of SQL (plus a few variants), and we’ll show how well my attempts to do so perform against the Microsoft built-in functions in SQL 2012.
Now I am no statistician, but I do believe that statisticians love ranking observations on a population (sample data) and one way that they do that is by determining what “percentile” they fall into. You might want to open the Wiki page in that link in a separate tab or window, because I’ll be referring back to it often. Many of the examples that follow replicate what is shown there. In that page it says that “there is no standard definition of percentile,” so you’ll find various methods listed there that we will attempt to reproduce in T-SQL.
For each percentile ranking method, we will encapsulate the calculation into in-line, Table-valued Functions (iTVFs), which you can add into your toolbox if you’re so inclined and use them at a later date. Our primary goal though is really to reproduce the calculations performed by PERCENTILE_CONT and PERCENTILE_DISC. Microsoft’s documentation on that is a bit sketchy, so we’re assuming that may be a bit of a challenge. And of course, we hope to do this while at the same time improving performance!
Sample Data and the SQL 2012 PERCENTILE Analytic Function Calculations
In order to develop our implementations for percentile ranking, we need some sample data. In this section, we’ll also show you our ultimate goal (desired output), which should be achievable assuming we can precisely replicate the calculations being done in SQL 2012 for its two new analytic functions.
|
1 2 3 4 5 6 7 8 9 10 11 12 13 14 15 16 17 18 19 20 21 22 23 24 25 26 |
-- A TABLE TYPE, introduced in SQL 2008 CREATE TYPE dbo.Percentiles AS TABLE ( Percentile FLOAT ); GO -- A table to hold our sample data CREATE TABLE dbo.PercentileExamples ( Grp INT ,Value INT ); GO INSERT INTO dbo.PercentileExamples (Grp, Value) -- Grp identifiers 1, 2 and 3 are sample data from the Wiki page -- defining percentile: http://en.wikipedia.org/wiki/Percentile SELECT 1, n FROM (VALUES(15),(20),(35),(40),(50)) a (n) UNION ALL SELECT 2, n FROM (VALUES(3),(6),(7),(8),(8),(10),(13),(15),(16), (20)) a (n) UNION ALL SELECT 3, n FROM (VALUES(3),(6),(7),(8),(8),(9),(10),(13),(15),(16), (20)) a (n); |
We have created a TABLE TYPE, which you won’t be able to do in SQL prior to 2008, however we’ll show you later how this can be avoided in earlier versions of SQL. Here’s a link that shows you various ways that TABLE TYPEs can be used: The SQL TABLE Type: Beyond Table-Valued Parameters. Note that we’ve created this table without a PRIMARY KEY for a reason that will become obvious in the section on Performance Testing.
Using SQL Server 2012, we can demonstrate both PERCENTILE analytic functions using a crosstab query to list our percentiles (25%, 50%, 75% and 100%) across columns, using a GROUP BY to aggregate because the analytic functions are designed to be applied and return results to the detail rows of your table’s results set.
|
1 2 3 4 5 6 7 8 9 10 11 12 13 14 15 16 17 18 19 20 21 22 23 24 25 26 27 28 29 30 31 32 33 34 35 36 37 38 39 40 41 42 43 44 45 46 47 48 49 50 51 52 53 |
-- Ultimate goal #1 as calculated by SQL 2012 (PERCENTILE_CONT) SELECT Grp -- A crosstab query to aggregate the results ,[25th Percentile] = MAX([25th Percentile]) ,[50th Percentile] = MAX([50th Percentile]) ,[75th Percentile] = MAX([75th Percentile]) ,[100th Percentile] = MAX([100th Percentile]) FROM ( SELECT Grp -- Calculate percentile rankings of interest (25%, 50%, 75%, 100%) ,[25th Percentile] = PERCENTILE_CONT(0.25) WITHIN GROUP (ORDER BY Value) OVER (PARTITION BY Grp) ,[50th Percentile] = PERCENTILE_CONT(0.50) WITHIN GROUP (ORDER BY Value) OVER (PARTITION BY Grp) ,[75th Percentile] = PERCENTILE_CONT(0.75) WITHIN GROUP (ORDER BY Value) OVER (PARTITION BY Grp) ,[100th Percentile] = PERCENTILE_CONT(1.00) WITHIN GROUP (ORDER BY Value) OVER (PARTITION BY Grp) FROM dbo.PercentileExamples ) a GROUP BY Grp; -- Ultimate goal #2 as calculated by SQL 2012 (PERCENTILE_DISC) SELECT Grp -- A crosstab query to aggregate the results ,[25th Percentile] = MAX([25th Percentile]) ,[50th Percentile] = MAX([50th Percentile]) ,[75th Percentile] = MAX([75th Percentile]) ,[100th Percentile] = MAX([100th Percentile]) FROM ( SELECT Grp -- Calculate percentile rankings of interest (25%, 50%, 75%, 100%) ,[25th Percentile] = PERCENTILE_DISC(0.25) WITHIN GROUP (ORDER BY Value) OVER (PARTITION BY Grp) ,[50th Percentile] = PERCENTILE_DISC(0.50) WITHIN GROUP (ORDER BY Value) OVER (PARTITION BY Grp) ,[75th Percentile] = PERCENTILE_DISC(0.75) WITHIN GROUP (ORDER BY Value) OVER (PARTITION BY Grp) ,[100th Percentile] = PERCENTILE_DISC(1.00) WITHIN GROUP (ORDER BY Value) OVER (PARTITION BY Grp) FROM dbo.PercentileExamples ) a GROUP BY Grp; |
The results returned by these two queries are shown below, where we’ll add the notation here that the 50th Percentile for PERCENTILE_CONT is also known as the median (we’ll get back to that too later).
|
1 2 3 4 5 6 7 8 9 |
Grp 25th Percentile 50th Percentile 75th Percentile 100th Percentile 1 20 35 40 50 2 7.25 9 14.5 20 3 7.5 9 14 20 Grp 25th Percentile 50th Percentile 75th Percentile 100th Percentile 1 20 35 40 50 2 7 8 15 20 3 7 9 15 20 |
We have not yet used our TABLE TYPE – that will come later.
The Nearest Rank Method for Calculating Percentiles
Our referenced Wiki page on percentiles tells us how we can calculate them using the Nearest Rank Method, by first calculating the ordinal rank (in SQL that is):
n = CEILING(P * N) or, alternatively: CEILING(P * N / 100.)
Where N is the number of rows in our group and P is the percentile expressed as either a fraction (like we passed into PERCENTILE_DISC above) or (if divided by 100) the raw percentage. The resulting n is the row to select from our sample data giving us the percentile value.
Using this knowledge we’ll create an iTVF into which we’ll pass a table listing the percentage rankings we wish to calculate.
|
1 2 3 4 5 6 7 8 9 10 11 12 13 14 15 16 17 18 19 20 21 22 23 24 25 26 27 28 29 30 31 32 |
CREATE FUNCTION dbo.PERCENTILE_NearestRankMethod ( @ExamplePErcentiles dbo.Percentiles READONLY ) RETURNS TABLE WITH SCHEMABINDING RETURN -- Nearest rank method WITH SampleData AS ( -- Add a row number within groups to our sample data SELECT Grp, Value ,rn=ROW_NUMBER() OVER (PARTITION BY Grp ORDER BY Value) FROM dbo.PercentileExamples ), RowsInSampleData AS ( SELECT Grp, RowsCount, Percentile FROM ( -- Calculate the row count for each group SELECT Grp, RowsCount=COUNT(*) FROM dbo.PercentileExamples GROUP BY Grp ) a -- Generate a Cartesian product against the desired percentiles CROSS JOIN @ExamplePErcentiles ) SELECT a.Percentile, a.Grp, PercentileValue=b.Value FROM RowsInSampleData a JOIN SampleData b ON a.Grp = b.Grp -- Handle 0th Percentile as the first (lowest value) in our sample data WHERE rn = CASE Percentile WHEN 0 THEN 1 ELSE CEILING(Percentile*RowsCount) END; |
The naming convention for the FUNCTIONs we’ll create in this article are that we’ll append a suffix with the SQL Server version number (either 2000, 2005 or 2012) if they can be run in that version, whilst no suffix means 2008. Also note that the Wiki page is not clear on what is returned for the 0th Percentile, so we’re assuming that this would be the lowest numbered value in our set, as handled in the CASE of the WHERE filter.
Our query using that function, which attempts to replicate one of our goals shown above for SQL 2012, is as follows. It is interesting to note how much simpler it is.
|
1 2 3 4 5 6 7 8 9 10 11 12 13 |
DECLARE @ExamplePErcentiles dbo.Percentiles; INSERT INTO @ExamplePErcentiles (Percentile) VALUES (0.25),(0.5),(0.75),(1.0); -- In SQL 2008 SELECT Grp ,[25th Percentile] = MAX(CASE Percentile WHEN 0.25 THEN PercentileValue END) ,[50th Percentile] = MAX(CASE Percentile WHEN 0.50 THEN PercentileValue END) ,[75th Percentile] = MAX(CASE Percentile WHEN 0.75 THEN PercentileValue END) ,[100th Percentile] = MAX(CASE Percentile WHEN 1.00 THEN PercentileValue END) FROM dbo.PERCENTILE_NearestRankMethod(@ExamplePErcentiles) GROUP BY Grp; |
Here we’ve used the TABLE TYPE we created (Percentiles) to define the desired percentile rankings, and then once again used a crosstab query to aggregate the results to our desired format. These results are:
|
1 2 3 4 |
Grp 25th Percentile 50th Percentile 75th Percentile 100th Percentile 1 20 35 40 50 2 7 8 15 20 3 7 9 15 20 |
Upon close inspection, it appears that we have just replicated the results from SQL 2012’s PERCENTILE_DISC analytic function. Clearly, PERCENTILE_DISC is using the Nearest Rank Method.
While that is one goal down and one to go, let’s go ahead and show how this can be implemented in SQL 2005 and 2000.
Nearest Rank Method in SQL 2005
In SQL 2005 we cannot use the TABLE TYPE. Instead we’re forced to move this out of the FUNCTION and handle it when we call the function instead. So the SQL 2005 version of this function is:
|
1 2 3 4 5 6 7 8 9 10 11 12 13 14 15 16 17 18 19 20 21 22 23 24 25 26 |
CREATE FUNCTION dbo.PERCENTILE_NearestRankMethod_2005 ( @Percentile FLOAT ) RETURNS TABLE WITH SCHEMABINDING RETURN -- Nearest rank method WITH SampleData AS ( -- Add a row number within groups to our sample data SELECT Grp, Value ,rn=ROW_NUMBER() OVER (PARTITION BY Grp ORDER BY Value) FROM dbo.PercentileExamples ), RowsInSampleData AS ( -- Calculate the row count for each group SELECT Grp, RowsCount=COUNT(*), Percentile=@Percentile FROM dbo.PercentileExamples GROUP BY Grp ) SELECT a.Percentile, a.Grp, PercentileValue=b.Value FROM RowsInSampleData a JOIN SampleData b ON a.Grp = b.Grp -- Handle 0th Percentile as the first (lowest value) in our sample data WHERE rn = CASE Percentile WHEN 0 THEN 1 ELSE CEILING(Percentile*RowsCount) END; |
You can see how we’ve simplified the Common Table Expression (CTE) named RowsInSampleData to remove the CROSS JOIN and simply append the input parameter (the current percentile of interest) to that CTE’s return result.
The query to calculate our percentile rankings is now as follows:
|
1 2 3 4 5 6 7 8 9 10 11 12 13 14 |
-- In SQL 2005 WITH Percentiles (Percentile) AS ( SELECT 0.25 UNION ALL SELECT 0.5 UNION ALL SELECT 0.75 UNION ALL SELECT 1.0 ) SELECT Grp ,[25th Percentile] = MAX(CASE b.Percentile WHEN 0.25 THEN b.PercentileValue END) ,[50th Percentile] = MAX(CASE b.Percentile WHEN 0.50 THEN b.PercentileValue END) ,[75th Percentile] = MAX(CASE b.Percentile WHEN 0.75 THEN b.PercentileValue END) ,[100th Percentile] = MAX(CASE b.Percentile WHEN 1.00 THEN b.PercentileValue END) FROM Percentiles a CROSS APPLY dbo.PERCENTILE_NearestRankMethod_2005(a.Percentile) b GROUP BY Grp; |
And we’ll leave it to our intrepid readers to verify that the returned results are indeed the same.
Nearest Rank Method in SQL 2000
To make this work in SQL 2000, there are a number of features introduced in SQL 2005 that we’re using above that we need to dispense with:
- CTEs are not supported, so we’ll need to move that code into derived tables.
- ROW_NUMBER() is not supported, so we need an alternate method to do that.
- iTVFs are also not supported, so we’ll need to either forgo encapsulation of the logic in the function and just do it all at once, or instead use a scalar-valued, user-defined function (I’ll choose the former).
Certainly this is not as easy, versatile or performance-efficient, but we’ll settle for just showing how it is done.
|
1 2 3 4 5 6 7 8 9 10 11 12 13 14 15 16 17 18 19 20 21 22 23 24 25 26 27 28 29 30 31 32 33 34 35 36 37 38 39 40 41 42 43 44 45 |
-- In SQL 2000 SELECT Grp ,[25th Percentile] = MAX(CASE a.Percentile WHEN 0.25 THEN a.PercentileValue END) ,[50th Percentile] = MAX(CASE a.Percentile WHEN 0.50 THEN a.PercentileValue END) ,[75th Percentile] = MAX(CASE a.Percentile WHEN 0.75 THEN a.PercentileValue END) ,[100th Percentile] = MAX(CASE a.Percentile WHEN 1.00 THEN a.PercentileValue END) FROM ( -- Nearest rank method SELECT a.Percentile, a.Grp, PercentileValue=b.Value FROM ( SELECT Grp, RowsCount, Percentile=b.Percentile FROM ( -- Calculate the row count for each group SELECT Grp, RowsCount=COUNT(*) FROM dbo.PercentileExamples GROUP BY Grp ) a CROSS JOIN ( -- Percentile rankings of interest SELECT 0.25 UNION ALL SELECT 0.5 UNION ALL SELECT 0.75 UNION ALL SELECT 1.0 ) b (Percentile) ) a JOIN ( -- Add a row number within groups to our sample data SELECT Grp, Value ,rn= ( -- Not nearly as efficient as ROW_NUMBER() -- but it works SELECT COUNT(*) FROM dbo.PercentileExamples x WHERE x.Grp = b.Grp AND x.Value <= b.Value ) FROM dbo.PercentileExamples b ) b ON a.Grp = b.Grp -- Handle 0th Percentile as the first (lowest value) in our sample data WHERE rn = CASE Percentile WHEN 0 THEN 1 ELSE CEILING(Percentile*RowsCount) END ) a GROUP BY Grp; |
Once again we’ll allow our interested readers to verify that we’ve achieved the results that we seek.
At this time, we have managed to simulate SQL 2012’s PERCENTILE_DISC analytic function using SQL 2000, 2005 and 2008. We will not attempt to show how the other methods we’ll describe shortly for calculating percentiles can be done in SQL 2000, but you should be able to adapt the SQL 2005 versions we’ll show the same way we managed the example above.
Percentile Calculations Using Excel
Referring back to our Wiki page on percentiles, we’re going to skip ahead just a bit to the method they describe as the Microsoft Excel Method for a couple of reasons. First it is slightly easier than the one that precedes it and also because Microsoft Excel now has three methods to calculate percentiles. Let’s look at our sample data in a spreadsheet.
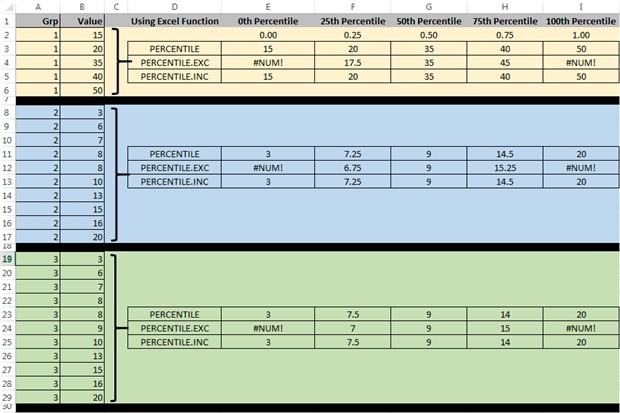
In the Excel documentation for PERCENTILE, it does not really describe the calculation methodology but it is described on the Wiki page. That linked Excel documentation page describes PERCENTILE as an Excel function that has been replaced by the other two: PERCENTILE.EXC and PERCENTILE.INC. By empirical examination, it appears that PERCENTILE and PERCENTILE.INC calculate the percentages the same way, although the description for PERCENTILE suggests it may not be as accurate as the newer replacement. For our purposes, we will assume they are the same and use the Wiki page’s description of the Microsoft Excel Method as our route to implementation.
The methodology described on the Wiki page also includes calculating a ranking, but slightly differently:
n = P * (N - 1) + 1 or, alternatively P / 100. * (N - 1) + 1
Once again this depends on whether you express P (the percentile) as a fraction or a percent.
For the 0th percentile, the calculation simply uses the lowest value in the list. For the 100th percentile, the calculation uses the largest value in the list. For anything in between, the formula uses an interpolation formula based on the integer part of n and the fractional part. If n has no fractional part the result returned is a value from the set.
If you look at the first worked example the Wiki provides, they’re using our Grp=1, but for the 40th percentile. So, with five rows in Grp=1, n is calculated as:
n = 0.4 * (5 - 1) + 1 = 2.6
This indicates that the 40th percentile falls between the second and third rows in Grp=1, and is calculated as:
40th Percentile = 20 + 0.6 * (35 - 20) = 29
Note that 0.6 is that fractional part of n, and this can be calculated using the T-SQL modulo operator as n%1.
Calculating Percentile Rankings Using T-SQL for Excel PERCENTILE and PERCENTILE.INC
Once again we’ll begin our exercise by creating an iTVF that is supported by SQL 2008, hence no suffix on the name. The major complication here is that we need to “look ahead” to determine the next row for those cases where the fractional portion of n is not zero.
Some time ago I wrote an article entitled “Creating a Date Range from Multiple Rows Based on a Single Date,” which in a similar vein attempts to retrieve data from adjacent rows. In there, I did a performance comparison and the results showed that a self-JOIN on an artificially created ROW_NUMBER() was probably a reasonably good choice. So we’ll do the same here.
|
1 2 3 4 5 6 7 8 9 10 11 12 13 14 15 16 17 18 19 20 21 22 23 24 25 26 27 28 29 30 31 32 33 34 35 36 37 38 39 40 41 42 43 44 |
CREATE FUNCTION dbo.PERCENTILE_INC_Excel ( @ExamplePErcentiles dbo.Percentiles READONLY ) RETURNS TABLE WITH SCHEMABINDING RETURN -- Excel PERCENTILE and PERCENTILE.INC built-in functions' method WITH SampleData AS ( -- Add a row number within groups to our sample data SELECT Grp, Value ,rn=ROW_NUMBER() OVER (PARTITION BY Grp ORDER BY Value) FROM dbo.PercentileExamples ), RowsInSampleData AS ( SELECT Grp, RowsCount, b.Percentile -- Calculate the rank - integer portion first ,[rank] = FLOOR(b.Percentile*(RowsCount-1)+1) -- Calculate the rank - fractional part ,[rank_dec] = (CAST(b.Percentile AS DECIMAL(15,10))*(RowsCount-1)+1) % 1 FROM ( SELECT Grp, RowsCount=COUNT(*) FROM dbo.PercentileExamples GROUP BY Grp ) a CROSS JOIN @ExamplePErcentiles b ) SELECT a.Percentile, a.Grp, PercentileValue= CASE [rank_dec] -- No decimal portion to [rank] WHEN 0 THEN b.Value -- When [rank] is not an integer, use the current row ELSE b.Value + -- Plus the interpolation piece CAST([rank_dec] AS FLOAT) * (c.Value - b.Value) END FROM RowsInSampleData a JOIN SampleData b ON a.Grp = b.Grp LEFT JOIN SampleData c ON a.Grp = c.Grp AND c.rn = b.rn + 1 -- Filter once again needs to handle the case where Percentile is zero WHERE b.rn = CASE Percentile WHEN 0 THEN 1 ELSE [rank] END; |
Some notes on what we’ve done here:
- The CAST of Percentile to DECIMAL(15,10) that appears in the RowsInSampleData CTE is required because FLOAT isn’t allowed with the modulo operator (%) that appears in the same line
- Both [rank] (the integer part) and [rank_dec] (the fractional part) is calculated within the RowsInSampleData CTE.
- We’ve used a CASE on [rank_dec] in the main query to either just pick a value from the list when the calculated rank has no fractional part, or locate the next row and use the interpolation formula if it does have a fractional component.
- The WHERE filter has been modified to return the row number that corresponds to [rank].
- Much of the remainder of the function is quite similar to what we did for the Nearest Rank Method. Some of it, like the SampleData CTE is identical.
Our Wiki page has two worked examples for the Excel method:
- The 40th percentile for Grp=1.
- The 75th percentile for a group that consists of 1, 2, 3 and 4 as the elements.
So in the code that follows, we’ll add the 0th and 40th percentiles, and also the additional group so we can check our calculation against the Wiki page.
|
1 2 3 4 5 6 7 8 9 10 11 12 13 14 15 16 17 18 19 20 21 |
-- Add a group for second worked example in Wiki INSERT INTO dbo.PercentileExamples (Grp, Value) VALUES (4,1),(4,2),(4,3),(4,4); -- Createe the table for percentiles of interest DECLARE @ExamplePErcentiles dbo.Percentiles; -- Populate the table of percentiles to calculate INSERT INTO @ExamplePErcentiles (Percentile) VALUES (0.00),(0.25),(0.4),(0.5),(0.75),(1.0); -- In SQL 2008 SELECT Grp ,[0th %tile] = MAX(CASE Percentile WHEN 0.00 THEN PercentileValue END) ,[25th %tile] = MAX(CASE Percentile WHEN 0.25 THEN PercentileValue END) ,[40th %tile] = MAX(CASE Percentile WHEN 0.40 THEN PercentileValue END) ,[50th %tile] = MAX(CASE Percentile WHEN 0.50 THEN PercentileValue END) ,[75th %tile] = MAX(CASE Percentile WHEN 0.75 THEN PercentileValue END) ,[100th %tile] = MAX(CASE Percentile WHEN 1.00 THEN PercentileValue END) FROM dbo.PERCENTILE_INC_Excel(@ExamplePErcentiles) GROUP BY Grp; |
This results set is produced.
|
1 2 3 4 5 |
Grp 0th %tile 25th %tile 40th %tile 50th %tile 75th %tile 100th %tile 1 15 20 29 35 40 50 2 3 7.25 8 9 14.5 20 3 3 7.5 8 9 14 20 4 1 1.75 2.2 2.5 3.25 4 |
We’ve highlighted the two values in bold red which correspond to the worked methods on the Wiki page and can see that they match. In bold blue we’ve highlighted values we can check against our Excel spreadsheet example, and can see that these match as well.
Furthermore, we see that these results are 100% identical to the results we got above when we showed Goal #1, meaning we managed to recreate the SQL Server 2012 PERCENTILE_CONT calculation on our first attempt! Sweet!
In retrospect, it is not particularly surprising that Microsoft would seek congruence between the methods employed for percentile ranking between two of its products.
Calculating Percentile Rankings Using SQL 2000/2005 for Excel PERCENTILE and PERCENTILE.INC
The only incompatibility with SQL 2005 in our PERCENTILE_INC_Excel function is passing in the table-valued parameter. To make it work, simply change that to a single FLOAT parameter, and then use the same technique we used in the Nearest Rank Method to generate the percentiles of interest outside of the function.
We’ve included a PERCENTILE_INC_Excel_2005 function in one of the resources files for you to play with.
To make it work in SQL 2000, you’ll need to exclude the functional encapsulation and just do the whole thing as a single query, just like we did for the Nearest Rank Method. All of the code in the function is already compatible with SQL 2000 except for ROW_NUMBER(), and we’ve already shown you a way to handle that.
Resource Files and Additional Validation
Because my editor would probably seriously chide me for adding to the length of this article, especially since I already achieved both of my originally stated goals, I will abstain from writing about the other methods described in the Wiki article for calculating percentiles, however I’ll do a quick summary of my findings:
- Linear Interpolation between Closest Ranks Method – I was able to reproduce this calculation and a function is provided in the resources file.
- Weighted Percentile Method – This method doesn’t apply to our scenarios because along with the Value component in the table, there must be an associated weight for each. So no function is provided.
- NIST Method – This calculation is equivalent to PERCENTILE.EXC in Excel, for which a function is provided in the resources. Perhaps I should have said PERCENTILE.EXC is implemented using the NIST method, as NIST stands for National Institute of Standards and Technology.
Among the goodies you’ll find in the attached resources files are some functions (all iTVFs with names in blue) to do those calculations, which I have tested and believe to be correct. Certainly they work for the examples provided on the Wiki page. It was just too much fun for me to not go that extra mile for you!
In those resources files, you will find the following SQL scripts with their contents described here:
- TABLE TYPE and Sample Data Setup.sql – A script that creates the TABLE TYPE, the example TABLE we’ve been using and populates that sample table with the four groups of data we’ve been working with.
- Nearest Rank Method.sql – A script that creates the two functions described for calculating percentiles using the Nearest Rank Method, and then runs the sample code for using them along with the non-function version usable in SQL 2000. Functions created by this script:
- PERCENTILE_NearestRankMethod – Identical to above.
- PERCENTILE_NearestRankMethod_2005 – Identical to above
- Percentile by Excel Method.sql – A script that creates functions that calculate percentiles the way that Excel does, and then runs the sample code for using them. Functions created by this script:
- PERCENTILE_INC_Excel – identical to above.
- PERCENTILE_INC_Excel_2005 – described but not shown above.
- PERCENTILE_INC_Excel_2012 – not described above but it uses SQL 2012’s LEAD analytic function to retrieve the next row for interpolation instead of a self-JOIN (results shown in the section on Performance Testing).
- Other Percentile Methods.sql – A script to create the two functions below and run them to produce some sample results.
- PERCENTILE_EXC_Excel – Included here because this appears to be equivalent to the NIST method described on the Wiki page. In cases where the Excel function is unable to interpolate, my iTVF returns NULL. Note that because it does a self-JOIN, it would be possible to construct a SQL 2012 equivalent using LEAD that might be faster, but I’ve left that for interested readers.
- PERCENTILE_INT_BetweenClosestRanks – Included and as described on the Wiki page. Note that because it does a self-JOIN, it would be possible to construct a SQL 2012 equivalent using LEAD that might be faster, but I’ve left that for interested readers.
- Performance Testing Setup in SQL 2012.sql – A script that will add data to our sample table to allow you to reproduce the results in the Performance Testing results section.
- Additional Testing and Validation.sql – A script described below in this section.
- Performance Test Runs in SQL 2012.sql – Run this to actually test the performance for the various cases we’ll describe.
- Performance Test of Interpolation Methods.sql – This is the second set of performance tests described below.
- Performance Test on Median.sql – A final performance test harness for use in SQL Profiler to examine performance on an equivalent, basic query to calculate median.
I wanted to be sure that I was correctly reproducing the SQL 2012 PERCENTILE_CONT and PERCENTILE_DISC calculations correctly, and I was concerned that the sample data I was using was quite small. So after I created the performance test harness using script #05, I also did some additional testing against all of that additional data to make sure I was arriving at the correct values for different percentiles. That’s done in script #06, but only for functions PERCENTILE_NearestRankMethod (vs. PERCENTILE_DISC) and PERCENTILE_INC_Excel (vs. PERCENTILE_CONT). Note that if you try running this validations script, it takes a few minutes so please be patient.
Initially I did find some discrepancies in PERCENTILE_INC_Excel vs. PERCENTILE_CONT, but those seem mostly to do with the inaccuracy of the FLOAT data type being returned. ROUNDing the results eliminated most of them, indicating that the results are probably “close enough.”
Keep in mind that the Wiki page on percentiles also says that “all definitions yield similar results when the number of observations is very large,” so what that means is that you’re probably pretty well off using any of the methods for large sets of sample data. In that case, I’d use the one that performs the best.
Performance Testing – SQL 2008 Functions vs. SQL 2012 Built-in Analytic Functions
To do our performance testing, we’re going to add rows to our PercentileExamples table until we have an approximately one million (1M) row test harness. The new data will be comprised of 1,000 additional groupings, which each have somewhere between 500 and 1,500 sample points in them. Note that the Tally table we’re using is SQL 2008 compatible but to run the additional testing you’ll need to be using SQL 2012.
|
1 2 3 4 5 6 7 8 9 10 11 12 13 14 15 16 17 18 19 20 21 22 23 24 25 26 27 28 |
WITH Tally (n) AS ( SELECT TOP (1500) ROW_NUMBER() OVER (ORDER BY (SELECT NULL)) FROM (VALUES(0),(0),(0),(0),(0),(0),(0),(0),(0),(0)) a(n) CROSS JOIN (VALUES(0),(0),(0),(0),(0),(0),(0),(0),(0),(0)) b(n) CROSS JOIN (VALUES(0),(0),(0),(0),(0),(0),(0),(0),(0),(0)) c(n) CROSS JOIN (VALUES(0),(0),(0),(0),(0),(0),(0),(0),(0),(0)) d(n) ) INSERT INTO dbo.PercentileExamples (Grp, Value) SELECT Grp=4+a.n, Value=1+ABS(CHECKSUM(NEWID()))%1000 FROM Tally a -- A random number between 500 - 1500 to use as row count per group CROSS APPLY (SELECT 500+ABS(CHECKSUM(NEWID()))%1000) b ([values]) -- Generate the rows for each group CROSS APPLY ( SELECT n FROM Tally WHERE n <= b.[values] ) c -- 1000 groups WHERE a.n <= 1000; SELECT FinalRowCount=COUNT(*) FROM dbo.PercentileExamples; -- Results (rows of sample data) 993336 |
The actual number of rows returned in the COUNTing select will be different each time you create this sample data, but should be near enough to the desired 1M rows in each case.
Borrowing a page from SQL MVP Aaron Bertrand in his article Best Approaches for a Grouped Median, we’ll perform our testing using three indexing schemes:
- No INDEX (our initial PercentileExamples TABLE is a heap), which is why we initially created the table without a PRIMARY KEY
- A CLUSTERED INDEX on Grp and Value
- A NONCLUSTERED INDEX on Grp and Value
Prior to testing against 1M rows of data, I like to run a little preliminary testing to separate the good solutions from the bad. As it turned out, all the functions I planned to test looked pretty decent. But since I’ve seen cases where using SQL 2012’s LEAD function does a better job when you need to combine data from two adjacent rows, I built an alternate function that will work in SQL 2012 that uses LEAD instead of the self-JOIN I had to use in PERCENTILE_INC_EXCEL. That function (PERCENTILE_INC_EXCEL_2012) was noted above as included in the resources files.
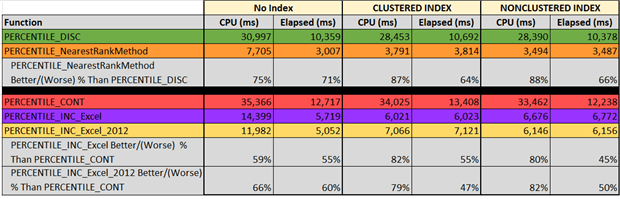
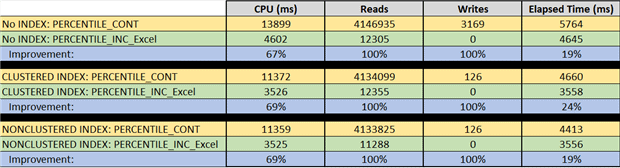
From the tabular results above, we see that:
- PERCENTILE_DISC – My solution (
PERCENTILE_NearestRankMethod) was 64-71% faster in elapsed time than PERCENTILE_DISC for the three INDEXing scenarios. - PERCENTILE_CONT – Both of my solutions were faster in elapsed time than PERCENTILE_CONT, ranging from 45-55% (for
PERCENTILE_INC_EXCEL) and 47-60% (for PERCENTILE_INC_EXCEL_2012), withPERCENTILE_INC_EXCEL_2012being the fastest in two out of the three INDEXing scenarios. - All of my solutions were easier on CPU usage, with improvements ranging from 60-88%.
- The methods that required interpolation (retrieval of data from adjacent rows) were generally slower than those that did not.
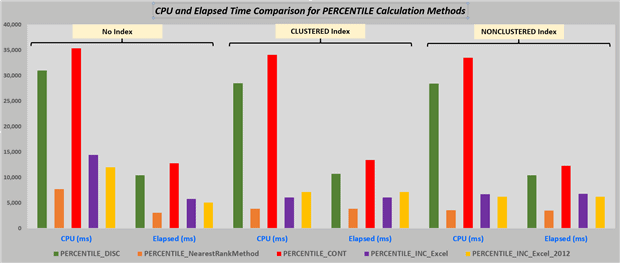
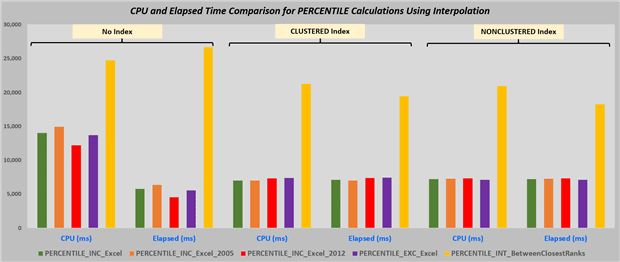
Graphically, the chart below clearly tells the same tale, where PERCENTILE_DISC (in green) and PERCENTILE_CONT (in red) were always quite a bit higher (slower or more resource intensive) than my competing iTVF solutions.
We also wanted to see how comparable the times were for all the iTVFs that used interpolation methods to achieve the percentile calculations, even if some of these functions weren’t described in detail in the article. So we ran all of the following functions against our big test table (~1M rows) and captured the timings. These were:
PERCENTILE_INC_ExcePERCENTILE_INC_Excel_2005PERCENTILE_INC_Excel_2012PERCENTILE_EXC_ExcelPERCENTILE_INT_BetweenClosestRanks
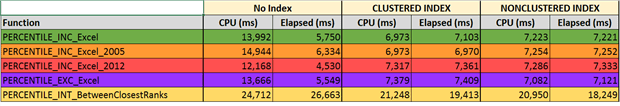
From these results you can see that all methods except Interpolation Between Closest Ranks are pretty much on par. Oddly enough, due to parallelism the SQL Query Optimizer chose to introduce into the heap (no index) case, most of those results (except for PERCENTILE_INT_BetweenClosestRanks) seem just a bit faster than if any INDEXing is present.
A Note on Calculating the Median
In the article by Aaron Bertrand that I linked to earlier, he compares the performance of a number of methods for calculating the median. One of those is PERCENTILE_CONT(0.5), which did not fare particularly well in any of his tests. Since my PERCENTILE_INC_EXCEL_2012 did a little better, one day perhaps I’ll run it through a test harness including the top solutions tested by Aaron to see if it is at least competitive in this arena.
Just to be fair here, the knowledgeable readers that have looked at my section on performance testing above may feel that I haven’t really compared apples to apples, because of my summarizations using crosstab queries. Because PERCENTILE_CONT(0.5) appends the median to every row in the selected table, a slightly different query is required to organize my results in that same manner. Comparing those two queries looks like this.
|
1 2 3 4 5 6 7 8 9 10 11 12 13 14 15 16 17 18 19 20 |
-- Query to add median to every row of our sample table -- PERCENTILE_CONT SELECT Grp, Value ,[Median] = PERCENTILE_CONT(0.50) WITHIN GROUP (ORDER BY Value) OVER (PARTITION BY Grp) FROM dbo.PercentileExamples ORDER BY Grp, Value; DECLARE @ExamplePErcentiles dbo.Percentiles; INSERT INTO @ExamplePErcentiles (Percentile) VALUES (0.50); -- Query to add median to every row of our sample table -- PERCENTILE_INC_Excel JOINed to sample table SELECT a.Grp, b.Value, [Median]=PercentileValue FROM dbo.PERCENTILE_INC_Excel (@ExamplePErcentiles) a JOIN dbo.PercentileExamples b ON a.Grp = b.Grp ORDER BY b.Grp, b.Value; |
The first 15 rows of both queries will reveal the median for groups 1 and 2:
|
1 2 3 4 5 6 7 8 9 10 11 12 13 14 15 16 |
Grp Value Median 1 15 35 1 20 35 1 35 35 1 40 35 1 50 35 2 3 9 2 6 9 2 7 9 2 8 9 2 8 9 2 10 9 2 13 9 2 15 9 2 16 9 2 20 9 |
The questions then is, do the performance comparison results from before still hold for this case?
We’ve used a test harness suitable for running in SQL Profiler this time, so we could capture IOs easily. The story we see is essentially the same – improvements across the board. The most drastic improvements are to CPU and IO counts.
Conclusion
I would be remiss in my conclusion if I did not give credit to Microsoft for introducing these new analytic functions in SQL 2012. Even though they can apparently be improved upon with respect to their speed, they represent a more generalized tool than what I have done for the simple reason that my iTVFs are all table-specific, while the analytic functions can be used on any table at any time. And as I’ve said before in various places that “well-focused code that solves only a specific problem is probably going to be a whole lot faster than more generalized code that solves a wider variety of problems.” Credit is also appropriate for using the same Excel algorithm for PERCENTILE_CONT that they used in T-SQL.
We were able to replicate pretty closely the percentile calculations performed by both of the SQL 2012 analytic functions, and developed iTVFs that seem to perform better over large sample data sets. Not mentioned above but were you to use these iTVFs to filter the results selected out of the large set of sample data using a WHERE clause on Grp, you should see your results returned more or less instantaneously. This is a result of the “in-lining” of the code for the iTVF. We also provided functions showing how this could be done in SQL versions earlier that 2008, and even included a few samples for those cases for you to work with.
Many of the percentile calculation methods require interpolation of some sort between rows in our SQL table, and it wasn’t particularly surprising that these cases were more performance intensive than when no interpolation was required.
I’d like to thank you for your interest in statistics and percentiles, particularly if you’ve gotten this far!
This document contains proprietary information and is protected by copyright law.
Copyright © 2026 Red Gate Software Limited. All rights reserved
Load comments