
Understanding data flow
In the 1970s, programming changed completely. This radical change was later called the “Structured Revolution” and it began with a famous article by Edsger Dijkstra. (Dijkstra, Edsger W. A Case against the GO TO Statement (EWD-215) (PDF). E.W. Dijkstra Archive. Center for American History, University of Texas at Austin). In this paper, he also observed that people are better able to recognize static relationships and not things that develop over time. I’ll get back to that point in just a little bit, but now back to ‘those thrilling days of yesteryear’ in IT.
Suddenly ‘structured’ meant ‘good’, and in consequence everything had to be structured, including analysis and design.
The flowcharts of the pioneering days
Before this paradigm shift, we used flowcharts. These were standardized in ANSI X3.5, making it one of the earliest IT standards. (http://standards.globalspec.com/std/1713332/ansi-x3-5) It was deprecated in 1970, but you’ll still see arrows (flows) and diamonds (decisions) and boxes (actions) being used in non-IT illustrations. They add a certain feel of science to magazine articles that are trying to help you make some kind of purchasing decision, decide what kind of whatever you are in a quiz, and so forth. The reason we don’t use them anymore is that we had no idea what was flowing in them. It could have been data or it could have been control or could’ve been a weird mix of both. They didn’t decompose in a structured, hierarchical fashion. The number of possible symbols was quite large because it mixed both physical devices (tapes, punchcards, hard disks, etc.) and logical actions (sorting, merging, procedure calls, etc.)
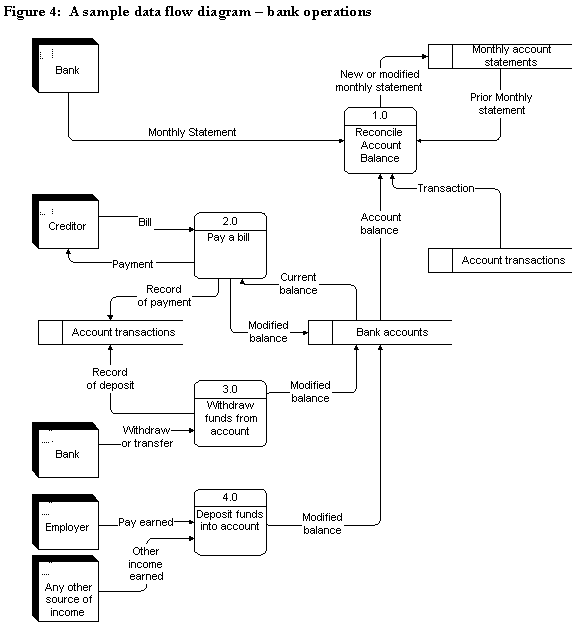
The Data Flow Diagram
Early pioneers like Ed Yourdon, Chris Gane and Trish Sarson and others replaced the old flowcharts with Data Flow Diagrams (DFD). The Gane and Sarson version was marketed by a branch of McDonnell Douglas known as IST. The system consists of just four symbols; square was used for sources and destinations of data outside the system, arrows for the flow of the data, round cornered rectangles for processes in the system, and open ended rectangles for data storage. This is a very abstract, high-level model of the system. (see http://faculty.babson.edu/dewire/Readings/dfddiag.htm).
The analogies used to explain it were “water in pipes” or “electric circuits” because like any network model, they had to obey certain laws. Processes were no longer restricted to just inputs or only outputs. Data was transformed in a logical (not necessarily physical) way by a process. No references to explicit devices were made in the diagrams. There were rules about balancing all of this. The term “structured” was based on the idea that a process could itself be broken into another DFD, in a hierarchical fashion.
It’s really a good technique and I hope someone is still teaching it. However, for purposes of this article, we care about the abstract view of data. The data that was flowing in the arrows (“pipes”) was referred to as data in motion and the data that went to the data stores, was referred to as data at rest.
Dynamic data and Complex Event Processing.
Somewhere along the way we stopped thinking about the difference between moving data and static data. Thinking about rates and time has always been difficult for humans. Consider the simple exercise: you can convert the cars in your fleet to improve their fuel economy. One option is to change the currently 10 miles per gallon vehicles to 20 miles per gallon, or convert the currently 20 miles per gallon vehicles to 50 miles per gallon. If you just do a quick static analysis, saving 30 miles per gallon looks impressive. However, doubling the efficiency of a vehicle can get you more efficient use of fuel.
Classic SQL databases are static. By that I mean their data sits in the tables and waits for query. This assumes that all the parts you need to do a query are already there, sitting on the warehouse shelf. But there are other models of data. In particular, streaming databases such as Azure Stream Analytics and StreamInsight assume the data is always changing and flowing like water in a pipe. In these products. We don’t worry about volume and transaction time so much, but are concerned with flow rate, speed and velocity. We want to go and continue the analogy of water and pipes, there’s a difference between filling a bathtub at the rate of 10 L per minute versus a drainpipe that flows the rate of 100 L per minute. There’s also differences between the tap on that bathtub versus the narrow nozzle and water pressure of an industrial pressure cutter.
Static vs Dynamic Constraints: The Coffee Shop analogy
The other thing about a traditional RDBMS is we assume the constraints are always in effect when you query. If you don’t want some of them you have to explicitly turn them off and take your chances. The streaming data model, we might not have all the data arriving at the database the same time, so you have to sit and anticipate. This is called complex event processing (CEP), and it assumes that as the data comes in, Events change how the data is as handled. In an article by Gregor Hohpe (http://www.enterpriseintegrationpatterns.com/docs/IEEE_Software_Design_2PC.pdf), He used a coffee shop analogy. Some coffee shops are synchronous; a customer walks up to the counter, places an order for a coffee and a pastry. The clerk behind the counter puts his pastry in the microwave, pours a cup of coffee and listens for ring of the microwave while putting the cup of coffee on the tray. When he hears the bell, the pastry is put on the same tray and it is handed over to the customer. Now it’s time to take the payment from the customer before the tray is released. Basically, each customer is a single thread whose order is assembled step-by-step.
Another way to run a coffee shop would be asynchronous. We had a cash register clerk who takes the order and the payment and then moves on to serve the next customer. The order ticket is then passed on to the kitchen. The “pastry guy” heats the pastry. At the same time a barista pours a cup of coffee. Once the complete order is assembled on the tray, the customers are either called to a pickup window or the server runs it out to this table where he is writing his Great American Novel on his laptop.
Some events in this flow are expected. For example, the barista might yell out “hey, were low on cups!” This event would trigger someone to bring more paper cups the storeroom, or check the kitchen for clean cups in the Hobart (commercial dish washing machine). The basic pattern is “detect ® decide ® respond”, which is not the same as the ordinary CHECK() constraint used with static data. Nor is this quite like a trigger. Triggers are set off by insertions or updates, not by exceptional things.
There is an expected routine behavior of either model for a coffee shop. We simply assume that, for most of the time, the stream of data that is coming in follows this predictable pattern. Now let’s throw a monkey wrench into the system. A robber runs into the coffee shop, waves a gun and demands everybody’s money. If this becomes routine expected behavior, it would be time to close as a coffee shop and go to a better neighborhood. But this has now triggered a whole series of events that involve police reports, and recovery from theft. The customers also have insurance claims and other things that they might want to file, but they’re not really part of the core coffee shop operation. Our goal is get the business back on the normal path after the exceptional event.
Static vs Dynamic Data
Dynamic constraints are only part of the problem. The data itself is moving so it can be hard to track or work with. The “missing dollar” or “bellhop” puzzle is a classic example of trying to follow a simple transaction when the data is moving.
Three people check into a hotel room. The clerk says the bill is $30, so each guest pays $10. Later the clerk realizes the bill should only be $25. To rectify this, he gives the bellhop $5 to return to the guests. On the way to the room, the bellhop realizes that he cannot divide the money equally. As the guests didn’t know the total of the revised bill, the bellhop decides to just give each guest $1 and keep $2 as a tip for himself. Each guest got $1 back, so now each guest only paid $9, bringing the total paid to $27. The bellhop has $2. And $27 + $2 = $29 so, if the guests originally handed over $30, what happened to the remaining $1?
|
1 |
SUM = $9 (Guest 1) + $9 (Guest 2) + $9 (Guest 3) + $2 (Bellhop's tip) |
The misdirection in this riddle is at the end of the description, where a bunch of unrelated totals are added together, and the listener assumes these numbers should add to 30. It sounds reasonable on the face of it. The trick here is to realize that this is not a sum of the money that the three people paid originally, as that would need to include the money the clerk has ($25). This is instead a sum of a smaller amounts the people could have paid ($9 * 3 people = $27), added with the additional money that the clerk would not have needed had they paid that smaller amount ($27 paid – $25 actual cost = $2). Another way to say this is, the $27 already includes the bellhop’s tip.
To add the $2 to the $27 would be to double-count it. So, the three guests’ cost of the room, including the bellhop’s tip, is $27. Each of the 3 guests has $1 in his pocket, totaling $3. When added to the $27 revised cost of the room (including tip to the bellhop), the total is $30.
To obtain a sum that totals to the original $30, every dollar must be accounted for, regardless of its location. Thus, sum is really:
|
1 2 |
SUM = $1 (Guest #1 pocket) + $1 (Guest #2 pocket) + $1 (Guest #3 pocket) + $2 (bellhop's pocket) + $25 (hotel cash register) |
This sum does indeed come out to $30. It’s based on where the money stopped moving, and not trying to count it while it was flowing in the system. Did you notice that in the first attempt, we never mentioned the hotel’s cash register? They were too busy looking at the money moving among the people (dynamic flows) and not the static store of money back at the front desk.
Commercial Products for Streaming Data
You can find products from IBM (SPADE), Oracle (Oracle CEP), Microsoft (StreamInsight), and Azure Stream Analytics. There are smaller vendors, such as StreamBase (stream-oriented extension of SQL) and Kx (Q language, based on APL) as well as Open Source projects (Esper, stream-oriented extension of SQL).
Broadly speaking, the languages are either ‘SQL-like’ and close to natural language, or they are ‘C-like’ and therefore cryptic. All of them have syntax to declare streams of data, and use a model of “dipping a bucket” into the stream as it goes past. These buckets of data can then have queries applied to them, and be passed along other programs for further processing.
We can use a statement to declare dynamic variables that get their values from a stream. Think of a ladle dipping into a stream. The syntax include the source of the data and how often it’s refreshed.
There are many more features to work with the streams. The products can reorder streams. Obviously with fresh data arriving, this very often cannot be a guaranteed sort.
Since this is a Microsoft-oriented website, you might want to look “StreamInsight Server Concepts” (https://technet.microsoft.com/en-us/library/ee391434(v=sql.110).aspx). The product is a server in a .NET model. The query uses LINQ as the query specification language:
|
1 2 3 |
var filtered = from e in inputstream where e.Value > 95 select e; |
As you can see, it looks like “broken SQL”, so it’s not too much of a shock when you have to work with it.
Concluding Thoughts:
Complex events and steaming databases do not yet have idioms, conventions and a standard language. But we are living in a world where the speed of processing is reaching the speed of light. The real problem is having to anticipate how to respond to complex events before they actually happen. There is no time to take action after or during the event.
This document contains proprietary information and is protected by copyright law.
Copyright © 2026 Red Gate Software Limited. All rights reserved


Load comments