In a perfect world,
SQL Server would
include a single tool
that would not only
automatically collect
all the important
performance data
DBAs need to identify
and fix performance
issues
Traditionally, SQL Server has included a lot of tools to help DBAs identify and troubleshoot performance problems, such as Profiler, System Monitor, the Database Engine Tuning Engine, Management Studio, DMVs, T-SQL commands, and so on. Some of these tools provide the ability to log historical activity, while others don’t. And even if the tool you use does logging, it is still an awkward process to capture the logged data and analyze it. Other tools didn’t even permit any kind of logging, such as monitoring DMVs, unless you write your own logging solution. This mishmash of different tools and data collection methods makes it difficult for DBAs to easily identify and fix a wide variety of performance problems.
In a perfect world, SQL Server would include a single tool that would not only automatically collect all the important performance data DBAs need to identify and fix performance issues; it would store the data in a single format, in a single location, and include advanced reporting that allowed DBAs to easily interpret the data so they could identify relevant solutions.
While SQL Server 2008 doesn’t include the perfect performance collection and analysis tool, it does provide a new feature called the Performance Data Collector, and it is a good first step toward this ideal tool.
In a nutshell, the Performance Data Collector is designed to help DBAs these ways:
- Act as a Central Data Repository: Part of the Performance Data Collector is what is called the Management Data Warehouse (MDW). It is used to store all of the data collected in one central location. It can store the data from a single SQL Server instance, or from multiple instances. While the focus of the MDW in SQL Server 2008 is for storing performance-related data, in future versions of SQL Server, expect it to be used to store virtually any data you want to collect from SQL Server, such as Extended Events, audit data, and more. The MDW is extensible, so if you are up to the task, you can store your own data in the MDW.
- Collect Selected SQL Server Performance Data: While the MDW is used to store performance data, the actual collection of data is performed by what are called Data Collection Sets. SQL Server 2008 comes with three built-in Data Collection Sets: one is to collect Disk Usage information; another is used to collect Query Statistics, and the third is used to collect a wide variety of Server Activities. According to Microsoft, these three Data Collection Sets collect the essential data needed to identify and troubleshoot most common SQL Server performance problems. If you don’t think the data that is collected is enough, you can create your own custom Data Collection Sets.
- Display Performance Reports: Data stored inside a data warehouse is not very useful unless you can get at it. SQL Server 2008 includes three built-in reports, including Disk Usage Summary, Query Statistics History, and Server Activity History. Each of these reports allow you to examine the history of a single SQL Server instance, one at a time In addition, each of the reports allow you to drill down into sub-reports, giving you an even more detailed view of what is going on in your server. If you think the built-in reports are incomplete, or if you want to report on custom-collected data, or produce reports that include information from multiple SQL Server instances, then you can create your own custom reports using the SQL Server Business Intelligence Development Studio, or with any of the various Reporting Services tools.
The Performance Data Collector is fully supported by the Enterprise and Standard editions of SQL Server 2008. Out of the box, it only works only on SQL Server 2008 instances, and is not backwards compatible with previous versions of SQL Server.
How to Configure the Performance Data Collector
Once you complete the initial installation of SQL Server 2008, the Performance Data Collector is not configured by default. To configure it and turn it on, you have to go through two steps.
- The first step is to use the “Configuration Management Data Warehouse” wizard to create the MDW database using the “Create or Upgrade a Data Management Warehouse” option. While this database can be stored on any SQL Server, ideally you should create it on a SQL Server instance designated specifically for this purpose. By doing this, you will help to reduce the overhead the Performance Data Collector puts on your production servers. One central MDW can hold the data for many SQL Server instances.
- The second step is to enable the Performance Data Collector. To do this, you again use the “Configuration Management Data Warehouse” wizard, but this time you select the “Setup Data Collection” option, which allows you to select the server and MDW database where you want the performance data to be stored. Once the wizard completed, the Performance Data Collector is enabled and data begins collecting almost immediately.
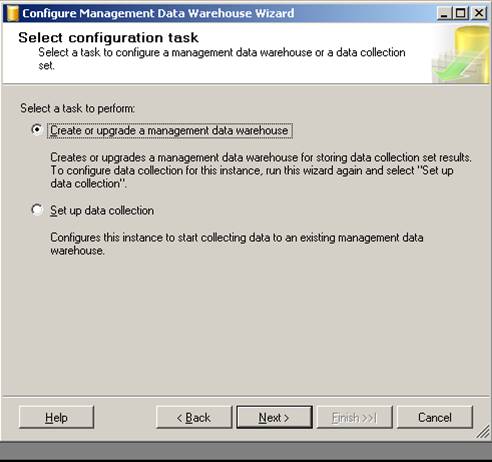
Figure 1: The Configure Management Data Warehouse Wizard is used to create the MDW, and to configure, setup, and enable the data collection components of the Performance Data Collector.
If you want to enable the Performance Data Collector on multiple instances of SQL Server 2008, you will have to run the wizard once for each 2008 instance you want to monitor, each time pointing to the server where the central MDW database is located.
How the Performance Data Collector Works
When the Performance Data Collector is first set up, it does a lot of behind the scenes work. For example, it creates SSIS package that will be used to collect data and then to move it to the MDW. It will also create a series of scheduled jobs that will be used to execute jobs on a regular basis. And it will add new tables to the MSDB database to store logging and other configuration information.
The easiest way to find out how the Performance Data Collector works is to follow the flow of data from the source, all the way to the MDW, where it is stored. To keep this example short and simple, we will focus only on the Server Activity Data Collector.
The Server Activity Collection Set is designed to collect two different types of data: DMV snapshots and performance counters that are useful for monitoring SQL Server’s overall performance. The best way to see this is to check out the Server Activity Properties screen.
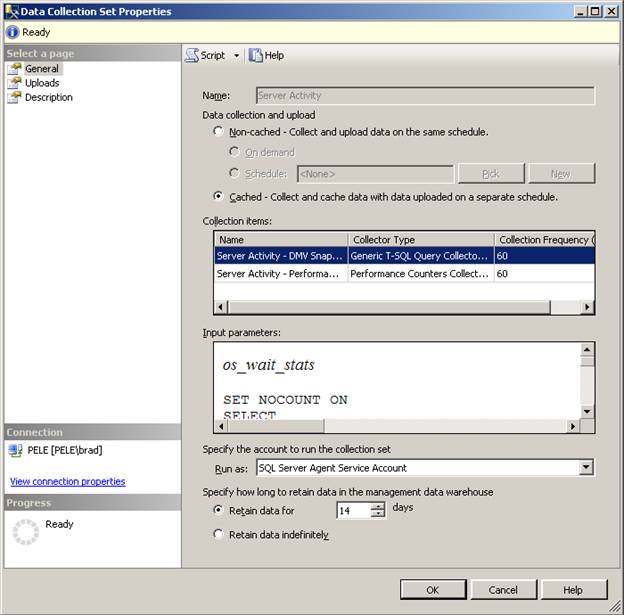
Figure 2: Each Data Collection Set has its own properties screen. The Server Activity – DMV Snapshot collection item is highlighted.
In figure 2, under “Collection Items,” there are two types of data the Server Activity Data Collection Set gathers. The first one, “Server Activity – DMV Snapshots,” is designed to literally take snapshots of specific DMVs every 60 seconds (see this under Collection Frequency). The Transact-SQL code it uses to collect this data is shown under “Input Parameters.” Obviously, you can’t see much of the code on this screen, but if you were to scroll down the window, you will see exactly what information is being selected from which DMVs.
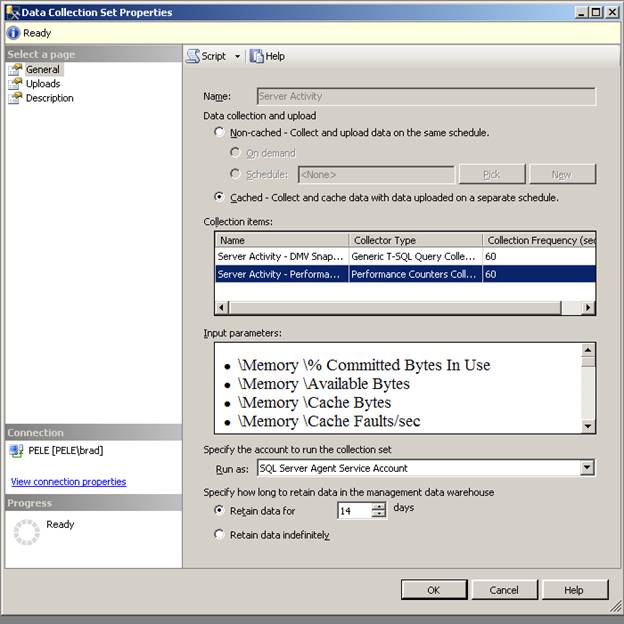
Figure 3: The Server Activity – Performance Monitor Counters collection item is highlighted.
In figure 3, the “Server Activity – Performance Counters” collection item is selected. Below it, in the “Input Parameters” screen, you see some of the Performance Monitor counters that are collected every 60 seconds. Like the DMV Snapshots, this is a snapshot of specific counters at a point in time.
Now that we have a basic idea of what type of data is collected by the Server Activity Collection Set, exactly how does the Performance Data Collector gather this information and store it in the MDW?
Data collection is scheduled as part of a SQL Server Agent job. When a job is run, it starts what is called the Data Collector Run-Time Component (dcexec.exe) that is used to load and execute SSIS packages. In this particular example, what happens is that the DMV and Performance Monitor counter snapshots are collected every 60 seconds by an SSIS package, then this information is cached (stored) in a local folder on the SQL Server instance being monitored. Notice that the option, “Cached – Collect and Update Data on the Same Schedule option,” is selected on the properties page above.
Then, every 15 minutes, a different SQL Server Agent job and SSIS package executes, collecting the data stored in the local cache and moves it to the MDW. Below, you can see another part of the properties page that allows you to control how often uploads occur.
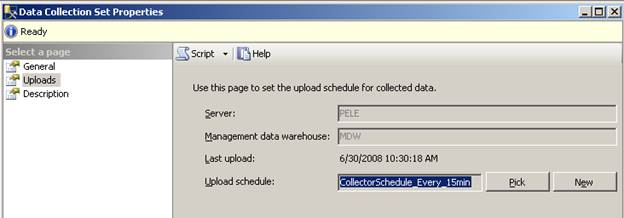
Figure 4: The Uploads option of the Server Activity Properties Page is used to designate how often data is moved from the local cache to the MDW.
Once the data is moved to the MDW, then it can be reported on using one of the three built-in reports, or any custom reports you create.
The Data Collector offers two different ways data can be collected and moved to the MDW: Cached and Non-Cached. The Cached option is what I described above, where one job and SSIS package is used to gather the data and store it in a local cache, and then a second job and SSIS package runs and moves the data from the local cache to the MDW. This option helps to reduce the overhead of the Data Collector by reducing how often data is moved between the monitored instance and the MDW.
The Non-Cached option, which is used by the Disk usage Data Collection Set, works a little differently. Instead of using two steps to move data to the MDW, it collects and uploads the data in one step. This option incurs slightly more overhead than the Cached method, but if not used too often, using it won’t make much impact on SQL Server’s performance.
Another feature of the Data Collector is that older data is automatically purged from the MDW based on a default schedule, or one you set. In figures 2 and 3, under “Specify how long to retain data in the management data warehouse,” you can see that data is only retained for 14 days for Server Activity data.
One question that you may be asking yourself is how much overhead will the Performance Data Collector take. While this will depend on the load of your server, and your server’s hardware, using this option will add about 4% to CPU utilization, in addition to collecting about 250-300 MB of data each day, and this is for the default Data Collection Sets only. If you create your own Data Collection Sets, then the overhead will be greater.
Reports Available from the Performance Data Collector
The Performance Data Collector includes three built-in reports, one report for each of the default Data Collection Sets. While we don’t have enough time to take a detailed look at each, let’s take a quick look at each report from a high-level perspective. Even though I won’t show it here, you can drill into each report for more detail.
The first report we will look at is the Disk Usage report.
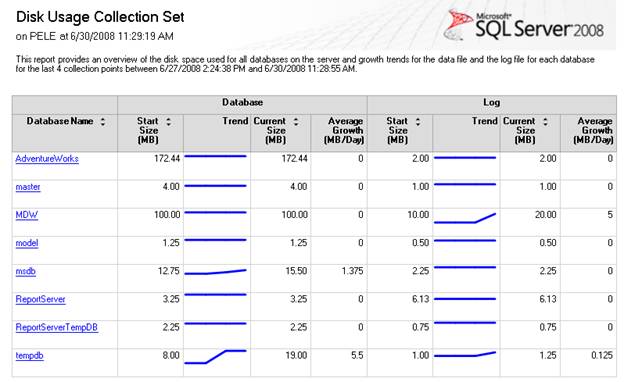
Figure 5: The Disk Usage Collection Set report tracks disk space over time.
This reports tracks disk space usage for your MDB and LDF files, providing both actual figures, along with displaying simple trend lines. This information can help you be more proactive as a DBA, as you can use this data to prevent yourself from running out of disk space at inopportune times. If you click on any of the databases, you will get a sub-report showing more details on how data is allocated in each database, among other information.
The next report is the Query Statistics History report.
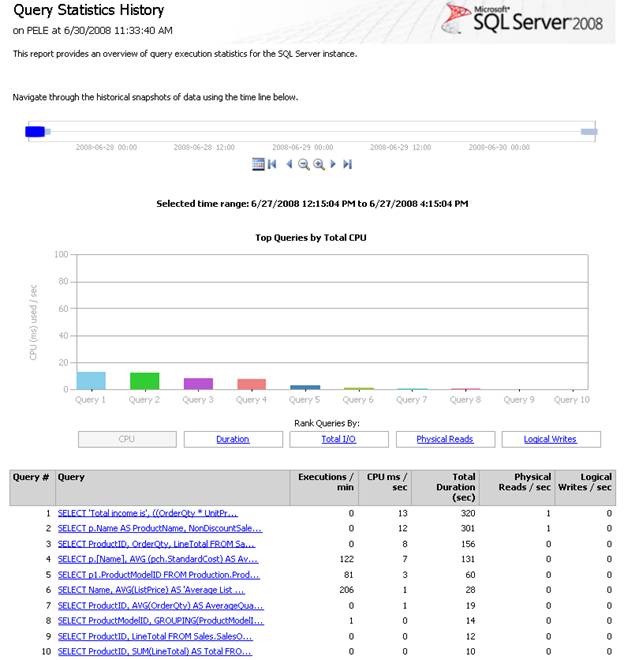
Figure 6: Use the Query Statistics History report to help you identify queries that use a lot of SQL Server resources.
While there is not a lot of activity shown in the above example, what you see are the top 10 queries that use the most CPU resources over the time range that has been selected. (Note: you can go back onto history as much as 14 days-by default-to view this data). You have the option to sort this data by CPU usage, Duration, Total I/O, Physical Reads, and Logical Writes. Once you have identified the most resource-consuming queries, you can drill down into each one, which provides you additional detailed information about the query, including its entire code and a graphical execution plan.
The third report is the Server Activity History report.
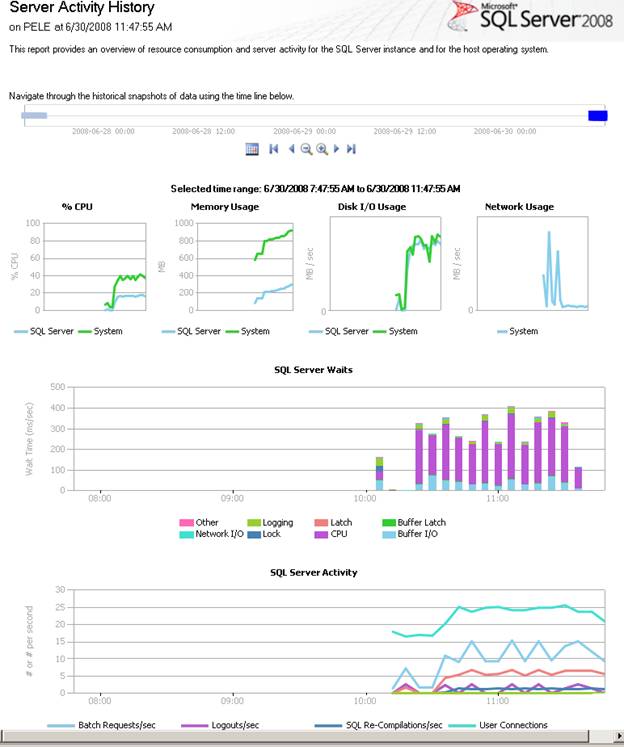
Figure 7: The Server Activity History report includes both Performance Monitor Counters and wait state information from DMVs.
Of all the reports, this one provides the greatest range of data. You can not only track basic hardware resources, such as CPU usage, memory usage, Disk I/O usage, and network usage, you also can view the most active SQL Server wait states; plus SQL Server activity, such as Logins/Second, Transactions, User Connections, and so on. You can drill down into almost any information on the screen, providing even more detail.
Summary
In this article, we have learned that the SQL Server 2008 Performance Data Collector allows us to creates a central repository to store performance data; that it includes three built-in Data Collection sets that can be used to collect and store performance data; and that we can use any of the three built-in reports to access the stored data in order to help us to identify and troubleshoot SQL Server performance-related problems.
One thing I want to emphasize is that you will want to test this option before you decide to turn it in for your production servers. The reason for this is that you must first evaluate whether this tool provides you with the information you want, and second, if you are willing to accept the overhead that goes along with using it. If you say yes to both, then go ahead and install this on your new SQL Server 2008 production servers.
This is taken from Brad’s book, ‘Brad’s Sure Guide to SQL Server 2008’, which is published by Simple-Talk publications. You can obtain a free copy from here


Load comments