
SQL Server includes a set of configurable options known as trace flags. You can use trace flags to set server characteristics and control different types of operations. SQL Server offers a wide range of trace flags that let you modify the platform’s default behavior to meet specific requirements. Trace flags can help you when performing such tasks as testing stored procedures, diagnosing performance issues, or debugging complex computer systems. Microsoft Support might also recommend using certain trace flags to address behavior that’s impacting specific workloads. This article explains how to enable SQL Server trace flags.
Introducing SQL Server trace flags
You can turn trace flags on or off manually, or you can add them to SQL Server’s startup parameters, so they’re enabled whenever you launch the service. Trace flags can be enabled at the global, session, or query scope, depending on the individual trace flag. The scope determines the extent of a trace flag’s impact on server connections:
- Global trace flags are enabled at the server level and impact every server connection. Trace flags configured as startup parameters are always enabled at the global scope.
- Session trace flags are specific to the connection in which they were enabled and have no impact on other connections. When the session ends, the trace flag no longer applies.
- Query trace flags are specific to the query in which they are enabled. They have no impact on other queries, even within the same session.
When you enable a trace flag manually, you must choose the specific scope. Some trace flags are available at all three scopes, while others are limited to only one or two.
You might come across SQL Server documentation that refers to only two types of trace flags—global and session—leaving query trace flags out of the discussion. The way in which SQL Server Management Studio (SSMS) references query trace flags in its execution plans also suggests only two types of trace flags, as you’ll see later in this article. However, query trace flags do exist, but how you enable them is much different from global and session trace flags.
SQL Server supports a wide range of trace flags, with each one labeled numerically. Many of them are documented, but many are not. Microsoft fully supports documented trace flags when used in a production environment. Those recommended by Microsoft Support are also supported. You can learn about the documented trace flags in the T-SQL reference topic DBCC TRACEON – Trace Flags. To learn about undocumented trace flags, you’ll need to tap into the SQL Server community to see what other developers and DBAs have to say.
Before enabling a trace flag, you should fully understand what it does, how it works, and its potential impact on your system. For example, trace flag 7470 enables additional computations for memory grants required by sort operators. If you were to view details about this trace flag in DBCC TRACEON – Trace Flags, you would discover that it supports all three scope levels but that it applies only to specific SQL Server versions. You would also find a link to a related Microsoft Support article, as well as a warning about the memory impact on concurrent queries.
Before implementing any trace flag in a production environment, carefully review all Microsoft information and recommendations and learn what you can from other reliable sources. Microsoft recommends that you thoroughly test any trace flags that you plan to implement in a production environment before enabling them in that environment. Trace flags can have unpredictable consequences and should be deployed with care.
Working with global trace flags
SQL Server provides several T-SQL statements for working with global and session trace flags. To demonstrate how these statements work, we’ll start with global trace flags.
As already noted, you can enable a global trace flag manually or by configuring the server’s startup parameters. You can use a DBCC TRACEON statement to enable it manually, specifying the trace flag number and the argument -1 to indicate that the trace flag is global. For example, the following DBCC TRACEON statement enables trace flag 2301 at the global level:
|
1 2 |
DBCC TRACEON (2301, -1); GO |
Trace flag 2301 implements advanced optimizations that help boost decision support queries executing against large data sets. When you run this statement, the database engine returns the message shown in Figure 1 (but with the appropriate timestamp).
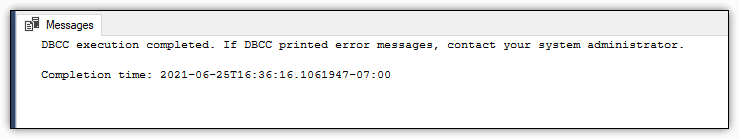
Figure 1. Standard message returned by DBCC TRACEON
If you want the statement to return only a basic message (and not the information about errors), you can include the WITH NO_INFOMSGS option:
|
1 2 |
DBCC TRACEON (2301, -1) WITH NO_INFOMSGS; GO |
Now the statement returns the message shown in Figure 2.
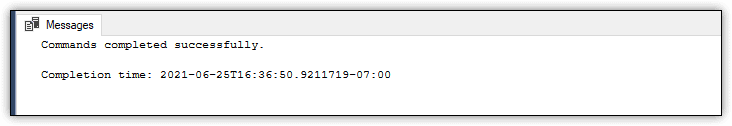
Figure 2. Simplified message returned by DBCC TRACEON
Whether or not you include the WITH NO_INFOMSGS option, you should use DBCC TRACEON only when users and applications are not running queries concurrently against the platform.
After you enable a trace flag, you can verify its status by running a DBCC TRACESTATUS statement, specifying the trace flag number and the value -1 to indicate that the trace flag is global, as shown in the following example:
|
1 2 |
DBCC TRACESTATUS (2301, -1); GO |
The statement returns the results shown in Figure 3.
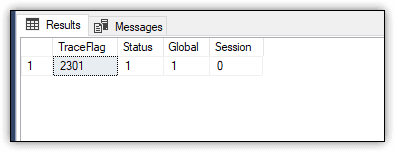
Figure 3. Viewing the status of a global trace flag
The results returned by a DBCC TRACESTATUS statement include four columns:
- TraceFlag. Trace flag number.
- Status. If 1, the trace flag is enabled. If 0, the trace flag is not enabled.
- Global. If 1, the trace flag is enabled at the global level. If 0, the trace flag is not enabled at the global level.
- Session. If 1, the trace flag is enabled at the session level. If 0, the trace flag is not enabled at the session level.
As with the DBCC TRACEON statement, you can also include the WITH NO_INFOMSGS option with a DBCC TRACESTATUS statement to return a simplified message
To disable a trace flag at the global level, you can use a DBCC TRACEOFF statement, again specifying the trace flag number and the value -1 to indicate that the trace flag is global, as shown in the following example:
|
1 2 |
DBCC TRACEOFF (2301, -1); GO |
Be sure that you include the -1 argument, or the trace flag will remain enabled. To verify that the trace flag has been disabled, you can run the same DBCC TRACESTATUS statement you ran before:
|
1 2 |
DBCC TRACESTATUS (2301, -1); GO |
This time, the Status, Global, and Session columns should each show a value of 0.
As with the DBCC TRACEON and DBCC TRACESTATUS statements, you can also include the WITH NO_INFOMSGS option with a DBCC TRACEOFF statement to return a simplified message
In some cases, you might want to enable multiple trace flags at the same time. You can still use a single DBCC TRACEON statement. For example, the following statement enables trace flags 715 and 2301 at the global level:
|
1 2 |
DBCC TRACEON (715, 2301, -1); GO |
You can then check the status of the trace flags in much the same way:
|
1 2 |
DBCC TRACESTATUS (715, 2301, -1); GO |
This time, the DBCC TRACESTATUS statement returns two rows, one for each specified trace flag, as shown in Figure 4.
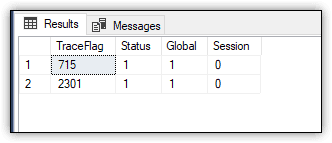
Figure 4. Viewing the status of multiple global trace flags
You can take the same approach to disable the two trace flags:
|
1 2 |
DBCC TRACEOFF (715, 2301, -1); GO |
Again, you can verify that the trace flags have been disabled by running the DBCC TRACESTATUS statement.
When you use a DBCC TRACEON statement to enable trace flags at the global level, they remain enabled until you manually disable them or until you restart the SQL Server service. However, you might want the trace flag to be enabled automatically when the service gets restarted. In this case, you can add the trace flag as a startup parameter, using the -T switch and specifying the trace flag number, as in the following example:
|
1 |
-T 2301 |
To add a trace flag as a startup parameter, you can use SQL Server Configuration Manager, taking the following steps:
- Launch SQL Server Configuration Manager.
- Ensure that SQL Server Services is selected in the left pane.
- In the right pane, right-click the SQL Server service instance and then click Properties.
- Go to the Startup Parameters tab.
- In the textbox, type the -T switch command and then click Add. The parameter is added to the Existing parameters list, as shown in Figure 5.
- Click OK.
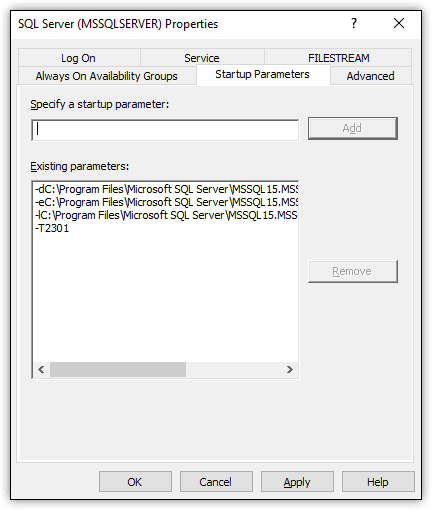
Figure 5. Adding a trace flag to the startup parameters
After adding a trace flag as a startup parameter, you must restart the service for it to take effect. You can then verify that the trace flag has been enabled by once again running a DBCC TRACESTATUS statement.
If you want to remove a trace flag from the startup parameters, select it in the Existing parameters list, click Remove, and click OK. You must again restart the service for your change to take effect.
Working with session trace flags
Enabling and disabling session trace flags work much the same as global trace flags, except for two notable differences. You can’t add a session trace flag as a startup parameter, and you don’t include the -1 argument when running the DBCC TRACEON and DBCC TRACEOFF statements. For example, to enable trace flag 2301 at the session level, you can use the following DBCC TRACEON statement.
|
1 2 |
DBCC TRACEON (2301); GO |
As you can see, you need only specify the trace flag number. The same goes for checking the trace flag’s status:
|
1 2 |
DBCC TRACESTATUS (2301); GO |
The DBCC TRACESTATUS statement should now return a Global value of 0 and a Session value of 1, just the opposite of a global trace flag, as shown in Figure 6.
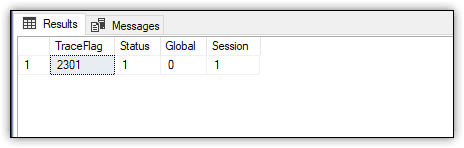
Figure 6. Viewing the status of a session trace flag
Because the trace flag was enabled at the session level, it is available only to the current connection, and it is enabled only for as long as the connection exists. If you were to run the same the DBCC TRACESTATUS statement from a different connection, the Status, Global, and Session columns would each show a value of 0.
To disable a trace flag at the session level, you can run a DBCC TRACEOFF statement from the same connection used to enable that trace flag, as in the following example:
|
1 2 |
DBCC TRACEOFF (2301); GO |
As before, you can verify the trace flag’s status by running a DBCC TRACESTATUS statement, which should now return a value of 0 for the Status, Global, and Session columns.
Working with query trace flags
The approach you take with query trace flags is different from global and session trace flags. You do not use the T-SQL statements you saw earlier and instead add the QUERYTRACEON query hint to your statements. The query hint is limited to Query Optimizer trace flags, representing only a small portion of the documented trace flags.
To help demonstrate query trace flags, let’s start by enabling a few global and session trace flags, which we’ll use for comparison purposes in just a bit. The following DBCC TRACEON statements enable two global trace flags (692 and 715) and one session trace flag (2301):
|
1 2 3 4 |
DBCC TRACEON (692, 715, -1); GO DBCC TRACEON (2301); GO |
As you saw earlier, after you enable these or any other trace flags, you can verify their status by running the necessary DBCC TRACESTATUS statements. I did not mention that you can run the statements without specifying the specific trace flags, making it easier to determine which trace flags are currently enabled, no matter how many have been enabled or whether or not you enabled them.
If you take this approach, be aware that it’s not always clear whether to use the -1 argument. According to SQL Server documentation, running a DBCC TRACESTATUS statement without any arguments returns “all the trace flags that are enabled for the current session.” On the other hand, including the -1 argument returns “all trace flags that are currently enabled globally.” But if you run the following statements together, you’ll quickly see that the results don’t correspond to the documentation:
|
1 2 3 4 |
DBCC TRACESTATUS (); GO DBCC TRACESTATUS (-1); GO |
Figure 7 shows the results returned by the two statements. As you can see, the statements generate identical results. Omitting the argument returns trace flags enabled at the global level, and including the argument returns trace flags enabled at the session level. By all appearances, it makes little difference whether or not you include the -1 argument.
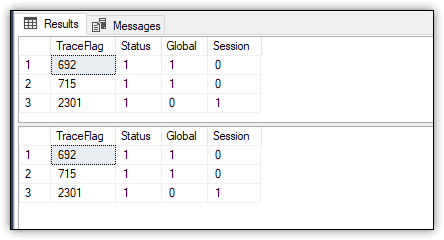
Figure 7. Running basic TRACESTATUS statements
After running a number of a DBCC TRACESTATUS statements with and without the -1 argument, I could find no differences in the results. And it appears that I’m not alone in my observations. According to Jason Brimhalls’ article Capture the Flag – The Trace Flag, “The -1 parameter does not return the appropriate result set and that is reproducible…The use of that parameter value still returns session flags as well.” I’ll leave it up to you to determine which approach to take.
In the meantime, let’s return to the query trace flag and how to use the QUERYTRACEON query hint. The following SELECT statement retrieves data from the WideWorldImporters sample database:
|
1 2 3 4 5 6 7 8 |
USE WideWorldImporters; GO SELECT so.OrderDate, sol.StockItemID, sol.Description, SUM(sol.UnitPrice * sol.Quantity) AS Total FROM Sales.OrderLines sol INNER JOIN Sales.Orders so ON sol.OrderID = so.OrderID GROUP BY so.OrderDate, sol.StockItemID, sol.Description OPTION (QUERYTRACEON 1211); |
The statement includes an OPTION clause that specifies the QUERYTRACEON query hint, which specifies trace flag 1211. If you run the SELECT statement in SSMS, you can use the Actual Execution Plan feature to verify that the trace flag has been applied to the statement.
After you run the statement, go to the Execution plan tab, right-click the SELECT component, and click Properties. In the Properties pane, expand the TraceFlags node to view the trace flags that were enabled when you ran the SELECT statement. You should see information similar to what is shown in Figure 8 (outlined in red).
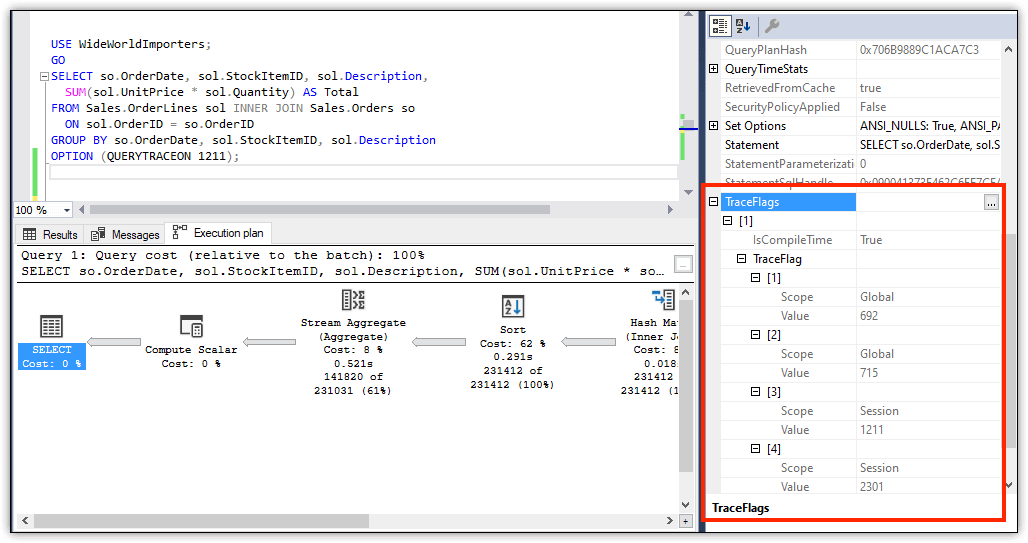
Figure 8. Viewing trace flags through the execution plan
As expected, trace flags 692 and 715 show a global scope, and trace flag 2301 shows a session scope. Trace flag 1211 also shows a session scope, even though it was deployed as a query trace flag. To verify this, you can run the following DBCC TRACESTATUS statement:
|
1 2 |
DBCC TRACESTATUS (1211); GO |
When you run this statement, the Status, Global, and Session columns should each show a value of 0, indicating that 1211 was not enabled as a global or session trace flag.
Despite the interface terminology, it’s apparent that trace flag 1211 was deployed at the query level, which means that it has no impact outside the SELECT statement itself. You can verify this by rerunning the SELECT query, but without the OPTION clause. This time, trace flag 1211 should not show up in the execution plan.
In the meantime, the other trace flags are still enabled, but you can disable them by running the following DBCC TRACEOFF statements.
|
1 2 3 4 |
DBCC TRACEOFF (692, 715, -1); GO DBCC TRACEOFF (2301); GO |
As with other trace flags, you can also run a DBCC TRACESTATUS statement to verify that the trace flags have been disabled. If no trace flags are enabled, you’ll receive a generic DBCC message stating that the execution is complete.
SQL Server trace flags
Trace flags can provide you with valuable tools when working with SQL Server, but you shouldn’t use them lightly. You might enable a trace flag to improve query performance for one application, only to discover it brings another application to its knees. You should also be aware that there is no way of knowing when Microsoft might remove a trace flag from a future release, so be sure to verify that the trace flags you’re using are still supported when moving to a new SQL Server version, especially if you’ve added trace flags as startup parameters. This issue aside, you might still find trace flags useful to your current operations, but be sure you fully understand how they work and what impact they might have before deploying them into production.
If you like this article, you might also like Introduction to SQL Server Security.
This document contains proprietary information and is protected by copyright law.
Copyright © 2026 Red Gate Software Limited. All rights reserved


Load comments