
One of the daily tasks for any DBA is looking for errors across the database server environment – login failures, job failures, service restarts, resource warnings, disk-subsystem problems.
PowerShell provides two primary log sources: the Windows Event Viewer (where Windows-level events including SQL Server service starts/stops and some SQL Server-originated entries appear), and the SQL Server Error Log (where SQL Server instance-level errors, warnings, informational messages, and login audit events appear).
This article covers reading and filtering both of these primary log sources, and is appropriate for DBAs moving from manual SSMS-based log browsing to scripted, repeatable log analysis. PowerShell code and practical examples are provided alongside the instructions.
“I know I’m searching for something
Something so undefined
that it can only be seen
by the eyes of the blind
in the middle of the night.”
Billy Joel
Contents
- Reading the Windows Event Viewer 2
- Get-EventLog examples.
- Getting entries from the Windows Error Log into Excel 3
- Listing the last day that an entry was made in the Application Event Log
- Listing the System Event Log for the past two hours. 4
- listing the Event Log between two time-periods. 4
- Filtering the error log by the Error types. 5
- Reading errors from just one particular source. 6
- Reading all messages containing a specific string. 6
- Selecting events according to a variety of conditions. 6
- Selecting the event logs of a number of servers and instances?.
- Get-EventLog examples.
- Reading the SQL Server Error Log. 7
- Applying Filters to the SQL Error Log. 13
- Summary. 22
Introduction
One of the everyday tasks of any DBA is to look for errors in your database server environment. With SQL Server, we have two major sources of information for doing this: the SQL Server Error Log and the Event Viewer.
When a problem occurs in SQL Server, ranging from a logon failure to a severe error in database mirroring, the first place to look for more information is the SQL Server Error Log. Similarly, if we have a problem related to physical hardware, the disk for example, we will look in the Event Viewer.
Both the SQL Server Error Log and the Event Viewer are designed to be used via their respective graphic user interface. This is fine for one or two servers, but painfully slow for the average DBA who has to read and filter information in many servers. Even when you’re focusing down on a problem with a single busy server, the added weight of the graphical tool in terms of resources can slow troubleshooting down considerably. It is very important in the day-to-day life of a DBA to have a mechanism to read and filter error messages quickly and unintrusively; a technique for “mining errors”.
This is where PowerShell comes in handy. With a relatively simple script, you can read, and filter out just those error messages that you need in a multi-server environment and moreover, format the output to make the information stand out. In this article we will show how to do this, and, if required, include warnings or any other type of event, using the SQL Server Error Log in both an Online and Offline mode as well as messages in the Windows Event Viewer.
Reading the Windows Event Viewer
We are going to want to check the server logs automatically for problems or warnings. If, unlike us, you have the time to routinely ‘remote’ into each server in turn, then the Windows Event Viewer is the classic way of reading this information.
The official documentation states: “Windows Event Viewer is a utility that maintains logs about program, security, and system events on your computer. You can use Event Viewer to view and manage the event logs, gather information about hardware and software problems, and monitor Windows security events.” In other words, the event viewer collects the information about the health of your system.
Every process that starts within the Windows OS opens a communication channel with the OS informing it of its most important actions and events. This means, for example, that if the disk subsystem has a problem or if a service stops, this fact will be viewable in the Windows Event Viewer. In the same way, every SQL Server error message with a severity of 19 or greater is logged in both the SQL Server Error Log and the Event Viewer. Therefore, it’s important to have a mechanism to constantly monitor/read the Event Viewer, especially remotely, so you can find information about problems and take any necessary action; perhaps to even prevent a system crash.
PowerShell has a built-in cmdlet to make it easier to access information recorded in Event Viewer, but before we use it, let’s discuss some basic concepts that will help us to understand how to use it better.
The Event Viewer is a repository for the event logs. With the Event Viewer we can monitor the information about security, and identify hardware, software and system issues. There are three basic Event Logs:
- System Log: Stores the events related to the Operational System, as a problem with a driver.
- Application Log : Stores the events related to the Applications and programs
- Security Log : Stored the events related to security, as invalid logon attempts
You can also create a custom event log. There are several third-party tools that have their own event log.
The built-in PowerShell cmdlet to access the Event Viewer is Get-EventLog. Figure 7 shows the output when using Get-EventLog to read the application event log:
|
1 |
Get-EventLog -LogName Application |
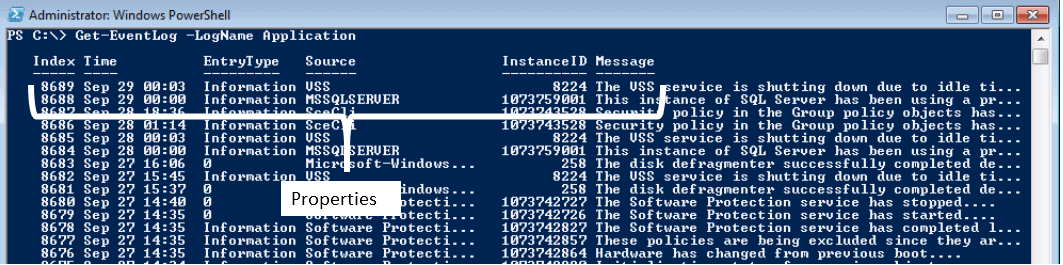
Figure1 – Properties from Get-EventLog
The Get-EventLog cmdlet has a parameter that allows you to read the Events remotely by passing in the name of the Server. Here we are using Get-EventLog to read the Security log on server ObiWan:
|
1 |
Get-EventLog -ComputerName ObiWan -LogName Security |
Get-EventLog examples
Getting entries from the Windows Error Log into Excel
Two weeks ago your company bought a monitoring software for the SQL Server Servers called ContosoMonitor and installed the agent on all servers. This morning you realize that The Servers are not sending monitoring messages. In the installation manual says that every event is recorded by the software in the local Event Viewer, at the Application log but with a specific source named ContosoMonitor. You decide to check the Event Viewer for all servers and look for errors from the installed agents, again exporting the output to an Excel spreadsheet with the Servers split into worksheets . You open a PowerShell session from your desktop and type :
|
1 2 3 4 5 6 7 8 |
Get-Content c:\temp\Servers.txt | ForEach-Object { #A Get-Eventlog -ComputerName $_ -LogName Application -EntryType Error -After (Get-Date).adddays(-1) | Sort-Object Time -descending | Export-Xls c:\temp\ContosoMonitorError.xlsx -AppendWorksheet -WorksheetName $_ #B } #A - Loop in the Servers inside the file Servers.txt #B - Filter the Event log in the current server of the loop, sorting by descending Date Time and exporting to a xlsx splitting the servers in worksheets |
To perform this operation using the Event Viewer GUI, You will need to connect to each Server and filter the Event Viewer by GUI, export to CSV file…etc. It is a painful process that will leave us wishing we could do it with two command lines of PowerShell. Let’s talk a little more about the PowerShell solution.
In order to read the Event Viewer, PowerShell has a built-in Cmdlet called Get-EventLog. There are some parameters in the Get-EventLog that can perform the filtering operation without needing an additional Where-Object and using it is faster than using the pipeline. Let’s take a look.
Note You can check out a complete help by typing Get-Help -full Get-EventLog
Listing the last day that an entry was made in the Application Event Log
This is just a matter of using the -after parameter and subtracting 1 day from the actual date :
|
1 |
Get-EventLog -ComputerName Obiwan -LogName Application -After ((Get-Date).adddays(-1)) |
Listing the System Event Log for the past two hours
To do this we also use the Get-Date methods, but use the -Before Parameter:
|
1 |
Get-EventLog -ComputerName Obiwan -LogName System -Before ((Get-Date).addHours(-2)) |
Listing the Event Log between two time-periods
To do this, we can join the parameters -after and -before as well. Imagine if we need list all Securities event logs in the last day, but for the 3 hours ago from the current date/time:
|
1 |
Get-EventLog -ComputerName Obiwan -LogName Security -After ((Get-Date).adddays(-1) -Before ((Get-Date).addHours(-3)) |
This Table shows the parameters to filter by date/time:
|
Parameter Name |
Description |
|
After <Datetime> |
Gets only the events that occur after the specified date and time. Enter a DateTime object, such as the one returnedby the Get-Date cmdlet. |
|
Before <Datetime> |
Gets only the events that occur before the specified date and time. Enter a DateTime object, such as the one returned by the Get-Date cmdlet. |
Get-EventLog has a parameter to filter the event type according to whether they are errors, warnings, information or Audit States, There are also parameters to specify the source of the error and filter by the contents the message itself. This table describes these parameters:
|
Parameter Name |
Description |
|
EntryType <string[]> |
Gets only events with the specified entry type. Valid values are |
|
-Message <string> |
Gets events that have the specified string in their messages. You can use this property to search for messages that contain certain words or phrases. Wildcards are permitted. |
|
-Source <string[]> |
Gets events that were written to the log by the specified sources. Wildcards are permitted. |
Filtering the error log by the Error types
If we were looking at the Application Log for the ObiWan Server :
|
1 |
Get-EventLog -ComputerName Obiwan -LogName Application -EntryType Error |
Reading errors from just one particular source
If you want to filter by the Source of the all event types. See that wildcards are allowed , so we can use for example , *sql* to filter all events from SQL Server.
|
1 |
Get-EventLog -ComputerName Obiwan -EntryTpe Error -LogName Application -source '*sql*' |
Reading all messages containing a specific string
We can filter by the contents of the message itself. Imagine if you want to filter the word ‘”started” in the message property :
|
1 |
Get-EventLog -ComputerName Obiwan -LogName Application -Message '*started* ' |
Selecting events according to a variety of conditions?
You can combine the selection of several properties. you may want to filter only the Event Log Application, type Error and source SQL Server in the last day :
|
1 |
Get-EventLog -ComputerName Obiwan -LogName Application -EntryTpe Error -Source '*sql*' -After ((Get-Date).adddays(-1)) |
You may need to query not only the Error entry type, but also Warning. In the table above we see that the EntryType is a STRING[] type and this means that I can pass an array with ‘Error,Warning’ to the -EntryType parameter :
|
1 |
Get-EventLog -ComputerName Obiwan -LogName Application -EntryTpe 'Error,Warning' -Source '*sql*' -After ((Get-Date).adddays(-1)) |
This technique also applies to the -Source Parameter.
Selecting the event logs of a number of servers and instances?
Get-EventLog does not accept pipeline input,so I cannot use "ObiWan" | Get-EventLog.
However, , the-Computername parameter is a STRING[] type, so I can use it with an array. If you want to perform the above operation on the ObiWan and QuiGonJinn Servers it is just, as the -EntryType and -Source parameters, use the comma between the names of the servers:
|
1 |
Get-EventLog -ComputerName @('Obiwan' ,'QuiGonJinn') -LogName Application -EntryType Error -Source '*sql*' -After ((Get-Date).adddays(-1)) |
Even better, using a txt file with the name of the servers, you also can do it with the Get-Content Cmdlet
|
1 |
Get-EventLog -ComputerName (Get-Content 'c:\temp\MyServers') -LogName Application -EntryTpe Error -Source '*sql*' -After ((Get-Date).adddays(-1)) |
Reading the SQL Server Error Log
Not only does the SQL Server error log write error information but it also records some information about successful operations, such as recovery of a database; and it also includes informational messages, such as the TCP port that SQL Server is listening on. The SQL Server Error Log is simply a repository of events. All these events are logged in order to assist in troubleshooting a potential problem and also to provide key information about the sequence of steps leading up to the problem.
You can view the SQL Server Error Log using SQL Server Management Studio (SSMS). As it is a plain text file you can view it in any text editor From TSQL you can view the results of executing the xp_readerrorlog extended stored procedure. By default, the error log is stored at ...…
Program Files\Microsoft SQL Server\MSSQL.n\MSSQL\LOG\ERRORLOG.
The current file is named ERRORLOG, and has no extension. The previous files will be named ErrorLog.1, ErrorLog.2…etc. and the SQL Server retains backups of the previous six logs. Figure 1 shows a view for the SQL Server Error Log by the SSMS log viewer.
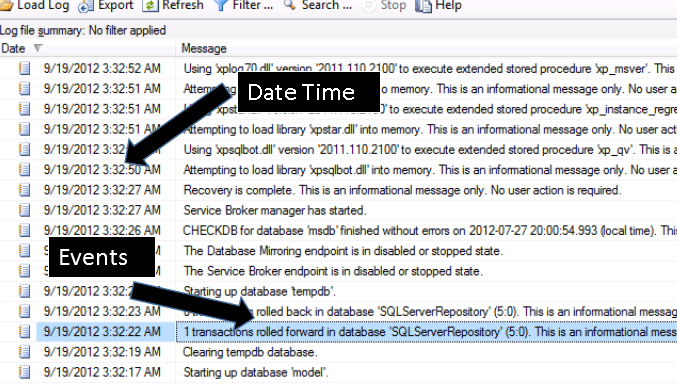
Figure 2- SQL Server Error Log in SQL Server Management Studio
The SSMS user interface works when the SQL Server instance is online, but even works with offline instances in SQL Server 2012 or 2014
The advantage of using PowerShell to read the SQL Server Error Log is that you can filter only the errors and format the output for later reference, for example, writing it to a CSV file or storing it in a SQL Server Table. We’ll use this technique in some of our DBA checklists in a subsequent article.
Accessing SQL Error logs in Online SQL Server Instances
When the SQL Server Instance is online, we can use the SQLPSX Get-SqlErrorLog function to read the Error Log. This is part of SQLPSX, but for your convenience I have a stand-alone version that doesn’t need SQLPSX installed. Let’s start by using the Get-Help cmdlet with the -full parameter to see how this function works:
|
1 2 3 4 5 6 7 8 9 10 11 12 13 14 15 16 17 18 19 20 21 22 23 24 25 26 27 28 29 30 31 32 33 34 35 36 37 38 39 40 41 42 43 44 45 46 47 48 |
PS C:\> Get-Help Get-SqlErrorLog -Full NAME Get-SqlErrorLog SYNOPSIS Returns the SQL Server Errorlog. SYNTAX Get-SqlErrorLog [-sqlserver] <String[]> [[-lognumber] <Int32>] [<CommonParameters>] DESCRIPTION The Get-SqlErrorLog function returns the SQL Server Errorlog. PARAMETERS -sqlserver <String[]> Required? true Position? 1 Default value Accept pipeline input? true (ByValue, ByPropertyName) Accept wildcard characters? -lognumber <Int32> Required? false Position? 2 Default value Accept pipeline input? false Accept wildcard characters? <CommonParameters> This cmdlet supports the common parameters: Verbose, Debug, ErrorAction, ErrorVariable, WarningAction, WarningVariable, OutBuffer and OutVariable. For more information, type, "get-help about_commonparameters". OUTPUTS System.Data.DataRow Get-SqlErrorLog returns an array of System.Data.DataRow. -------------------------- EXAMPLE 1 -------------------------- C:\PS>Get-SqlErrorLog "Z002\sql2k8" This command returns the current SQL ErrorLog on the Z002\sql2k8 server. RELATED LINKS Get-SqlErrorLog |
As we can see in the help text we’ve gotten via the Get-Help cmdlet, we can pass in the SQL Server Instance name and the number of the log file, and the default of 0 corresponds to the current log. The -sqlserver parameter is mandatory. The SQLPSX version doesn’t accept pipeline input, so if you use this version you need to use foreach loop statment or foreach-object cmdlet from an array of the SQL Server instance names . So to list all events in SQL Error Log in the SQL Server Instance R2D2, using either version of Get-SqlErrorLog, we can use the form:
|
1 |
Get-SqlErrorLog -sqlserver R2D2 |
Or using foreach loop statment :
|
1 2 3 |
$Servers = Get-Content c:\teste\Servers.txt ForEach ($Server in $servers) { Get-SqlErrorLog -sqlserver $Server } |
And foreach-object cmdlet
|
1 2 3 4 |
Get-Content c:\teste\Servers.txt | ForEach-Object { Get-SqlErrorLog -sqlserver $_ } |
Note If you want performance, avoid the pipeline and the foreach-object cmdlet approach. Use the foreach loop statment. We will discuss this approach in later articles.
Figure 3 illustrates the output:
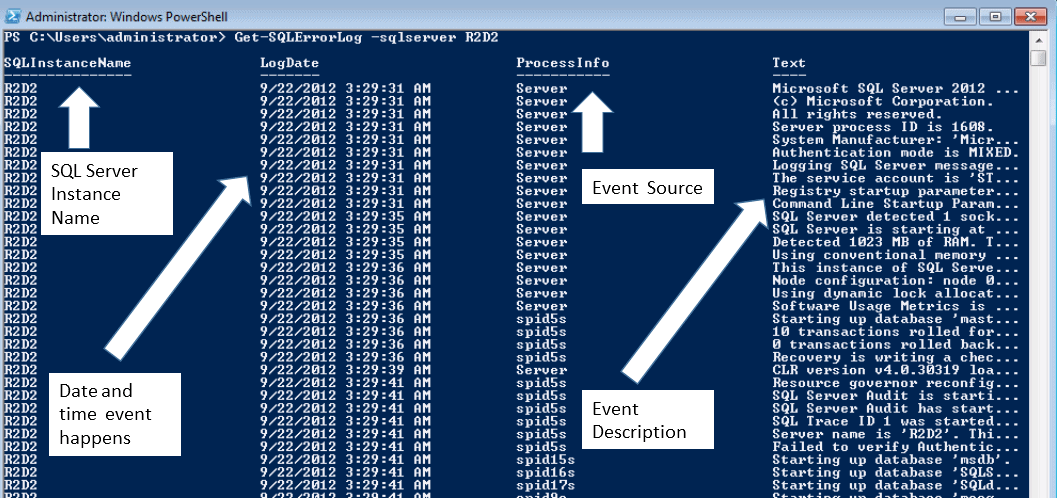
Figure 3- Get-SQLErrorLog output
Because the event description is truncated to fit the screen in this format, we can improve the formatting by piping the output to the Format-List cmdlet, as shown in Figure 3:
|
1 |
Get-SqlErrorLog -sqlserver R2D2 | Format-List |
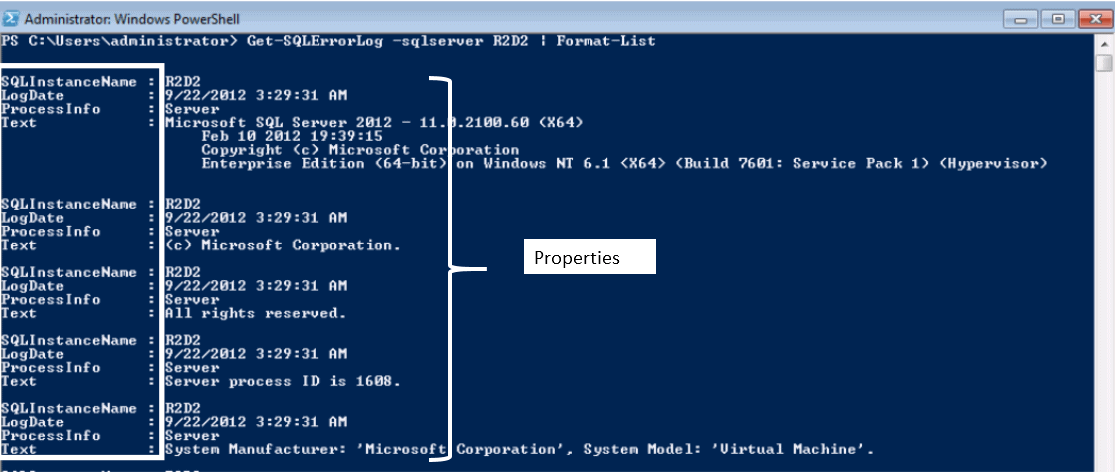
Figure 4- Get-SQLErrorLog output piping to Format-List
In the same way, if we want to list the SQL Server Error Log events in log file number 2, we can just use the -lognumber parameter:
|
1 |
Get-SqlErrorLog -sqlserver <SQLInstanceName> -lognumber 2 |
Accessing SQL Error logs in OffLine SQL Server Instances
SQL Server 2012 introduced a new feature that allows the Error Log to be read even if the instance is offline. SQL Server has two WMI providers, for Server Events and for Computer Management.Two new WMI classes have been added to the Management provider: the SqlErrorLogFile and SqlErrorLogEvent classes.
To access these two classes you need to connect to the … Root\Microsoft\SqlServer\ComputerManagement11
… WMI namespace. Unlike the WMI for Server Events that has a namespace to each instance, the provider for Computer Management covers all SQL Server instances on the machine. You will need to specify the correct instance within the WQL (WMI Query Language).
The account under which the script runs needs to have read permissions, locally or remotely, on the Root\Microsoft\SqlServer\ComputerManagement11 WMI namespace. It also needs permission to access the folder that contains the SQL Server Error Log File.
The SqlErrorLogFile WMI class contains information about the log file itself as we can see in the table 7.1:
|
Property |
Description |
|
ArchiveNumber |
The number of the file. Corresponds to the extension of the ERRORLOG file, as 0,1,2…etc. |
|
InstanceName |
SQL Server Instance Name |
|
LastModified |
Date and time the file was last modified, using WMI date/time format |
|
LogFileSize |
The size of the log file in bytes |
|
Name |
Name of the file, ERRORLOG.X |
This WMI Class is interesting if you want to know about the physical log file, but this is not our focus. Because we want the event descriptions and information, we need to use the SqlErrorLogEvent WMI Class. Table 7.2 shows the properties from the SqlErrorLogEvent class:
|
Property |
Description |
|
FileName |
Name of the SQL Server Error Log file, ERRORLOG.1,.2,.3..etc |
|
InstanceName |
SQL Server Instance Name |
|
LogDate |
Date and time the event was recorded in the LOG File. Using WMI date/dime format |
|
Message |
The event message |
|
ProcessInfo |
Source of the Event (SPID) |
To access the SQL Server Error Log for the default SQL Server instance in the Server R2D2, let’s use the Get-WMIObject cmdlet:
|
1 |
Get-WmiObject -computername R2d2 -Class "SqlErrorLogEvent" -Namespace "Root\Microsoft\SqlServer\ComputerManagement11" |
Figure 5 display the cmdlet’s output :
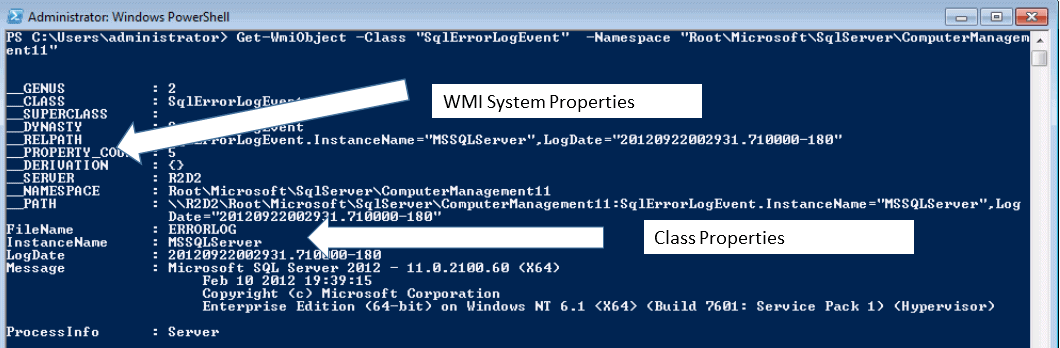
Figure 5- Get-WMIObject Output in the SQLErrorLogEvent Class
You’ll see that, as well as the error log date and message, we’re also being distracted by some irrelevant information. As we can see in Figure 4, there are some properties that start with “__”. They are called WMI System Properties and are in every WMI Class. Unfortunately the Get-WMIObject cmdlet does not provide a parameter to suppress them in the output. An alternative is to select the properties you want to show, piping the output from Get-WMIObject to the Select-Object cmdlet :
|
1 2 |
Get-WmiObject -Class "SqlErrorLogEvent" -ComputerName R2D2 -Namespace "Root\Microsoft\SqlServer\ComputerManagement11" | Select-object Filename,InstanceName, Logdate,Message,ProcessInfo |
But we still have a problem. The LogDate is incomprehensible. Unlike the Get-SQLErrorLog where the property LogDate is a System.DateTime type that uses the OS date/time format, the LogDate property in the WMI Class is a System.String and has its own format. You can read more about this in “Working with Dates and Times using WMI” at Microsoft Technet. Figure 6 illustrates this:
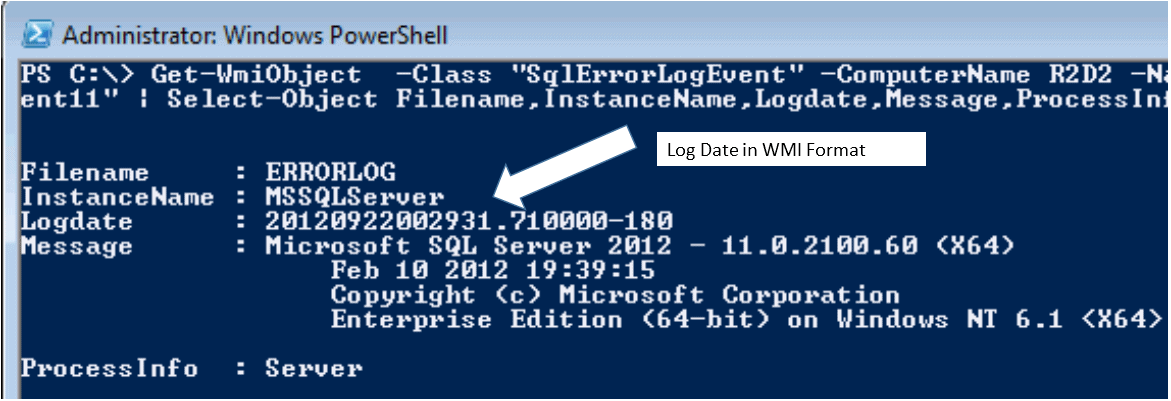
Figure 6- Get-WMIObject Output using Select-Object and displaying the LogDate in a WMI format.
This means that we need to convert the WMI date/time format to the system date/time format. Fortunately WMI has a method to perform this operation called ConvertToDateTime. We can just use it in the Select-Object step:
|
1 2 3 4 5 6 |
Get-WmiObject -Class "SqlErrorLogEvent" -ComputerName R2D2 -Namespace "Root\Microsoft\SqlServer\ComputerManagement11"| Select-object FileName, InstanceName, @{Expression={$_.ConvertToDateTime($_.LogDate)};Label = 'Logdate'}, Message, Processinfo |
Uhaa!!! Now we have a friendly-view format to the Logdate property, as the Figure 7 shows :
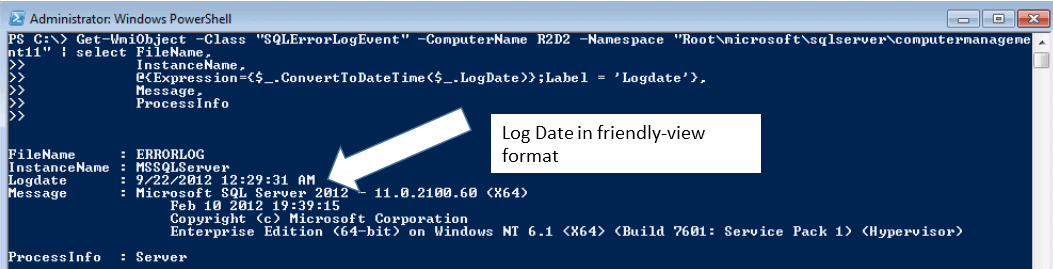
Figure 7- Get-WMIObject Output using Select-Object and displaying the LogDate property in a user-friendly format
This has now given us a way of gathering information about a SQL Server instance even if SQL Server is offline. We have accessed the log remotely in PowerShell by using WMI. This greatly increases our chances of solving a problem server even if the instance is offline.
Applying Filters to the SQL Error Log
If SQL Server does not start, or users have problems logging in, then you really have to search for possible errors. It is a good practice to check for errors and warnings just to be proactive and look for problems before they happen.. So far we saw how to read the events in the SQL Error Log and the Windows Event Viewer, but, as a DBA, we are interested on filtering these events, to look for specific errors and warnings or events that happen at a specific time. This covers how we filter the log messages.
SQL Error Log in Online SQL Server Instances
Imagine the situation, where you have been informed that two hours ago the SQL Server ObiWan, part of a simple active/passive cluster, was refusing connections from an XPTO. The Server in question is extremely busy and therefore it is likely to be a bad idea to use a resource-intensive graphic-user interface to diagnose it. You need to find out about what may have happened by filtering the Error Log looking for any error messages from two hours ago. You need to urgently inform your boss of the problem once you have enough information to be able to give an estimate of how long it will take to fix the problem. But the use of SSMS is out of the question. In fact we not only have to read the Error Log from two hours ago, but the filter the information looking for specific errors, but let’s approach the problem in stages.
PowerShell can easily work with date/time intervals because we can directly use the Get-Date properties. We already covered the Get-Date cmdlet in article 2, but let’s take a look a bit more deeply on it.
As everything in PowerShell is an object with its properties and methods, Get-Date returns an instance of System.DateTime and this class has a method named Adddays. If you don’t know about this method, Figure 8 display the output of only the methods that start with “ADD” (using the PowerShell cmdlet Get-Member) because it is all the matters to us now.
|
1 |
Get-Date | Get-Member |
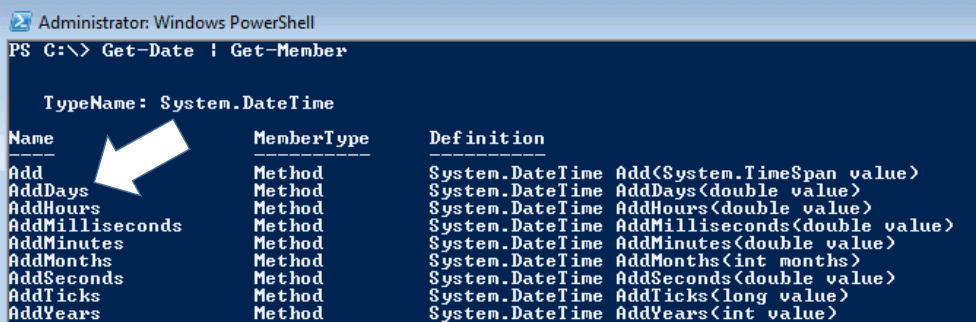
Figure 8 – Only the methods that start with “ADD” from the Get-Date cmdlet
In section 7.1, “Reading the SQL Server Error Log”, we saw that this function returns the properties SQLInstanceName ,LogDate, ProcessInfo and Text . To filter by date/time we will use the LogDate property and to list the SQL Error Log in the last five days we’ll just use the Where-Object cmdlet , filtering the LogDate property using Get-Date and a negative number of the days, in this case, -5 , in the Adddays method :
|
1 2 |
Get-SqlErrorLog -sqlserver ObiWan | Where-object { $_.logdate -ge ((Get-Date).adddays(-5)) } |
But if we want the events from the last 24 hours only? Just use the AddHours method:
|
1 2 |
Get-SqlErrorLog -sqlserver ObiWan | Where-object { $_.logdate -ge ((Get-Date).adddhours(-24)) } |
The process to filter for Errors is similar, but we will need to pipe to the Where-Object Cmdlet to filter the errors but in this case we will use the Text property to look for strings that signify an error:
|
1 2 3 4 5 6 7 8 9 |
Get-SqlErrorLog -sqlserver ObiWan | Where-object { ( $_.text -like '*Error*' ` -or $_.text -like "*Fail*"` -or $_.text -like "*dump*"` -or $_.text -like '*IO requests taking longer*'` -or $_.text -like '*is full*' ` ) -and ($_.text -notlike '*found 0 errors*')` -and ($_.text -notlike '*without errors*')` } |
You can see the difficulty that we’ve had to ‘code around’, can’t you? Although the Event Viewer has a property that specifies whether the event is an Error, Warning or Information message, the Get-SQLErrorLog does not return this information and the error messages are embedded within in the message itself. The warnings sometimes contain text which contains the word ‘error’ but which aren’t actually error events. We don’t want to see those. This means that we need to filter “Error” but exclude “found 0 errors “or “without errors” and include some messages that do not have the “error” inside it, but characterizes an error or warning, as “is full” or “IO request taking longer”
‘In this example the trick is to use the operators -or and -and to filter exactly what you need. We can, however, produce neater code by using a RegEx string.
PowerShell works very well with Regex and, generally speaking, most of the string comparisons can be turned to a Regex Expression. It isn’t easy to understand the Regex patterns, but the result is clear code, without a bunch of the -and/-or operators. The same filter conditions used in the example above can be rewritten as:
|
1 2 |
Get-SqlErrorLog -sqlserver ObiWan | Where-object {$_.Text -match '(Error|Fail|IO requests taking longer|is full)' -and $_.Text -notmatch '(without errors|found 0 errors)' } |
We see how to filter by date/time and by errors/warnings separately, but most of the time we prefer to have both type of events together so we just put the two together. In the next example, we filter by errors/warnings in the last 24 hours on ObiWan SQL Server Instance, the code is:
|
1 2 3 |
Get-SqlErrorLog -sqlserver ObiWan | Where-object { ( $_.logdate -ge ((Get-Date).addhours(-24)))` -and $_.Text -match '(Error|Fail|IO requests taking longer|is full)' -and $_.Text -notmatch '(without errors|found 0 errors)'} |
Now if you are checking for errors on all the servers that you’re responsible for, you will want to perform the same process, but for more than one SQL Server Instance. In our case let’s do it to the servers ObiWan and QuiGonJinn. Remembering the Get-Help from Get-SQLErrorLog in the first section of this article we noticed that the parameter -sqlserver accepts pipeline input and it is a STRING [] type. This applies to the version attached to this article: I’ve already shown how to use the SQLPSX version. In the rest of these examples, I’ll be using the enhanced version which can be downloaded from the head of this article.
I can pass a list of the servers:
… by pipeline …
|
1 2 3 4 |
'ObiWan', 'QuiGonJinn' | Get-SqlErrorLog | Where-object { ( $_.logdate -ge ((Get-Date).addhours(-24)))` -and $_.Text -match '(Error|Fail|IO requests taking longer|is full)'` -and $_.Text -notmatch '(without errors|found 0 errors)'} |
… having a txt file with the servers and using the Get-Content Cmdlet by pipeline
|
1 2 3 4 5 |
Get-Content c:\temp\Servers.txt | Get-SqlErrorLog | Where-object { ( $_.logdate -ge ((Get-Date).addhours(-24)))` -and $_.Text -match '(Error|Fail|IO requests taking longer|is full)'` -and $_.Text -notmatch '(without errors|found 0 errors)'} |
… or having a txt file with the servers and using the Get-Content Cmdlet by array in the -sqlserver parameter because it is a STRING[] , just type:
|
1 2 3 4 |
Get-SqlErrorLog -sqlserver (Get-Content c:\temp\Servers.txt) | Where-object { ( $_.logdate -ge ((Get-Date).addhours(-24)))` -and $_.Text -match '(Error|Fail|IO requests taking longer|is full)'` -and $_.Text -notmatch '(without errors|found 0 errors)'} |
You can also obtain the list of SQL Server instance names from rows in a database table. In this case, I’m using a database called SQLServerRepository with a table called tbl_SQLServerInstanceNames on SQL Server instance R2D2. The table structure is pretty simple, just one column called SQLServerInstanceName.
In this case, you first need to query this table to return the SQL Server instance names using the Invoke-SQLCMD2 function that is part of the SQLPSX toolkit, and pipe the information to the Get-SQLErrorLog cmdlet:
|
1 2 3 4 5 |
Invoke-Sqlcmd2 -ServerInstance R2D2 -Query "Select SQLServerInstanceName from tbl_SQLServerInstanceNames" -Database "SQLServerRepository" | Get-SqlErrorLog -sqlserver (Get-Content c:\temp\Servers.txt) | Where-object { ( $_.logdate -ge ((Get-Date).addhours(-24)))` -and $_.Text -match '(Error|Fail|IO requests taking longer|is full)'` -and $_.Text -notmatch '(without errors|found 0 errors)'} |
You will notice that the output is sorting by ascending date of the LogDate Property . But what if we want to display the messages in descending order? To do this, we can just pipe the Where-Object cmdlets output to the Sort-Object designating the LogDate property and using the -descending switch parameter :
|
1 2 3 4 5 |
Invoke-Sqlcmd2 -ServerInstance R2D2 -Query "Select SQLServerInstanceName from tbl_SQLServerInstanceNames" -Database "SQLServerRepository" | Get-SqlErrorLog -sqlserver (Get-Content c:\temp\Servers.txt) | Where-object { ( $_.logdate -ge ((Get-Date).addhours(-24)))` -and $_.Text -match '(Error|Fail|IO requests taking longer|is full)'` -and $_.Text -notmatch '(without errors|found 0 errors)'}| Sort-Object Logdate -descending |
Now, to return to our scenario where that SQL Server was refusing connections, we need to filter messages from two hours ago and search for some error that might give us a clue as to what the problem is. To be more accurate, we will filter the time to ten minutes before two hours, or 130 minutes. From your desktop, you type:
|
1 2 3 4 |
Get-SqlErrorLog -sqlserver ObiWan | Where-object { ( $_.logdate -ge ((Get-Date).addminutes(-130)))` -and $_.Text -match '(Error|Fail|IO requests taking longer|is full)'` -and $_.Text -notmatch '(without errors|found 0 errors)'} |
In the output you see some interesting messages. As we can see in the Figure 9, the date/time of the errors are suspiciously close together and they are close to the date/time you were informed that SQL Server starts to refuse connections. The Text property displays the exact date/time that SQL Server stops responding to connections (logon error) and it was after the Dump Error.
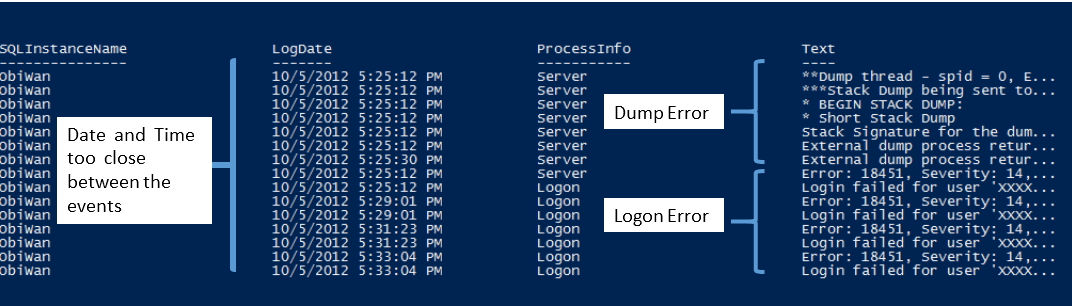
Figure 9 Reading and Filtering the SQL Server Error Log to solve the connection refused problem
At this point the cause of the problem will become obvious just from reading the output, the question has been answered by a PowerShell one-liner.. The server ObiWan is part of a cluster and because of the Dump error, it experienced a failover. For the duration of the failover, where the mechanism stopped the SQL Server service in one node and started it in the other, the connections were refused. It is a normal behavior during a failover. Your job now is to research why the dump happened, but that task is out of the scope of this article.
I’ve described the bare bones here. In fact, the text message is truncated to fit the screen and as so you’d usually want to pipe the command line above to the Out-GridView Cmdlet to get a better way of inspecting the errors:
|
1 2 3 4 5 6 7 8 9 10 11 |
Get-SqlErrorLog -sqlserver ObiWan | Where-object { ( $_.logdate -ge ((Get-Date).addminutes(-130)))` -and $_.Text -match '(Error|Fail|IO requests taking longer|is full)' -and $_.Text -notmatch '(without errors|found 0 errors)'}Where-object { ( $_.logdate -ge ((Get-Date).addminutes(-130)))` -and ($_.text -notlike '*found 0 errors*')` -and ($_.text -notlike '*without errors*')` -and ( $_.text -like '*Error*' ` -or $_.text -like "*Fail*"` -or $_.text -like "*dump*"` -or $_.text -like '*IO requests taking longer*'` -or $_.text -like '*is full*') ` } | Out-GridView |
The text messages are easy to read as the Figure 10 shows:
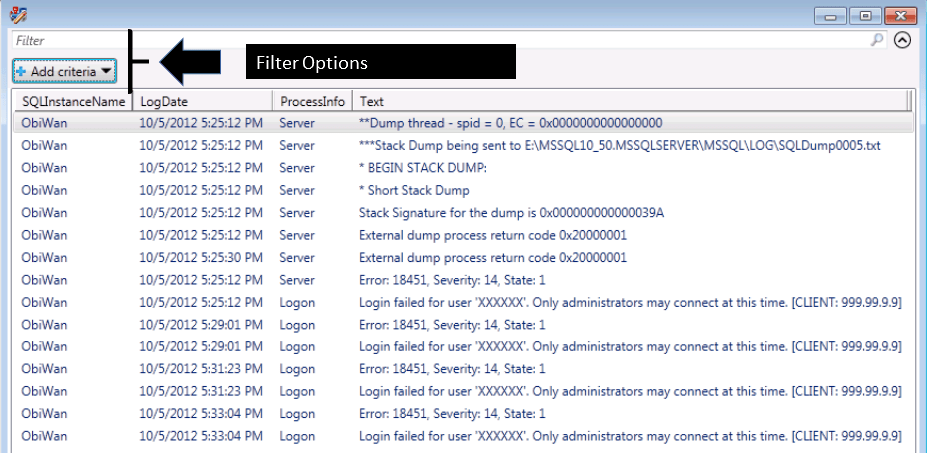
Figure 10 Using the Out-GridView Cmdlet to achieve more User- friendly view of the Error Log
The Out-GridView Cmdlet has a plus. It has the filter options. This means that you use it as well. The Figure 10 is also displaying these options.
The SQL Server Error Log is a repository of events, whether they are errors, warnings or simple information messages. To filter for errors we need to include and exclude some messages at the same line as we did in the conditions above. The message “is full” was added, but “Without Errors” was added to our exclusion list. This means that if there is a line with both expressions it will be discarded. You may want to add more expressions on that condition to filter your needs more accurately. At some point, your filter conditions could become a bit unmanageable because you could find yourself changing the filter whilst exploring errors in the log. You really need something a bit more simple than the code we’ve done above. Possibly the best answer to this is to use a Regex but hide the complexity. By using PowerShell’s feature of variable-substitution in a string, we can keep things simpler. you can create a variable to -Match and -NoMatch operators, add all the conditions that you want, and use this in the Where-Object. This way it is easier for you understand, remove and add new filters for messages whatever you want or need and the search conditions for the Where-Object Cmdlet are clearer to read. The code would look like:
|
1 2 3 4 |
$match = '(Error|Fail|IO requests taking longer|is full)' $nomatch = '(without errors|found 0 errors)' Get-SqlErrorLog -sqlserver ObiWan | where { $_.Text -match $match -and $_.Text -notmatch $nomatch } |
To add a new message to the match condition, for example “Warning” it is just put it at the end of the string:
|
1 |
$match = '(Error|Fail|IO requests taking longer|is full|warning)' |
The same process is used for the -nomatch conditions.
SQL Error Log in Offline SQL Server Instances
Imagine it: You’re at your desk analyzing the new ‘Always On’ project and you notice a report that , for some reason, the Servers R2D2 and ObiWan stopped start to refuse connections. After you solve the problem and not stop the production, your action could to consolidate the Error Log of the two Servers in the last half hour in an excel spreadsheet, each server in separate worksheets so that you can analyze the events.
From your desktop you just type:
|
1 2 3 4 5 6 7 8 9 10 11 12 13 14 |
"R2D2","ObiWan" | ForEach-Object { #A Get-WmiObject -Class "SqlErrorLogEvent" -ComputerName $_ -Namespace "Root\Microsoft\SqlServer\ComputerManagement11"| #B Where-Object {$_.ConvertToDateTime($_.LogDate) -ge (Get-Date).addminutes(-30)} | #C select InstanceName, @{Expression={$_.ConvertToDateTime($_.LogDate)};Label = 'Logdate'}, Message, Processinfo | Sort-Object LogDate -Descending | #D Export-Xls -Path "c:\Log.xlsx" -AppendWorksheet -WorksheetName $_ #E } #A - Loop for R2D2 and ObiWan Servers #B - Accessing the SQL Server Error Log WMI at the server in the current loop #C - Selecting the properties to display and changing the Logdate property from WMI Date format to the OS date format. |
As the Figure 11 illustrates, an excel spreadsheet called Log.xlsx is created with the Servers R2D2 and ObiWan split into worksheets, with the last half hour events in descending date/time order:
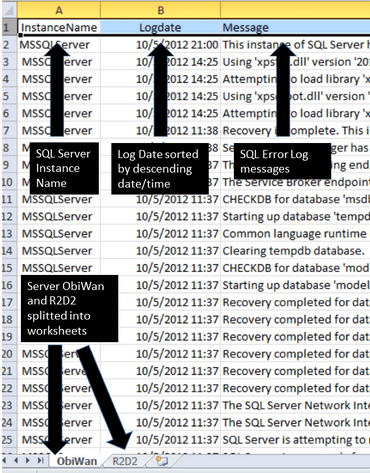
Figure 11 Consolidated Error Log from ObiWan and R2D2 servers
The same operation by SSMS would be to:
- Create a CSV File to each Server
- Turn the CSV into an Excel spreadsheet
- Sort the date/time in descending order
- Copy each Excel spreadsheet to a new one as a worksheet
This is a relatively complex task if compared to just two command lines of PowerShell
We already covered way that you can read the SQL Error Log when the instance is offline by using the WMI class SQLErrorLogEvent, which is part of the WMI Computer Management Provider, and Get-WMIObject Cmdlet. The process by which one would filter in this case is a bit different to date/time and to choose the SQL Server instance. First let’s see the date/time process.
In the section of this article on offline SQL Server Instances, we saw that the WMI Classes have their own date/time format and so we need to convert this format to have a friendly-view format, or the system format. To filter by date/time we need to do the same to the LogDate Property but now using the Where-Object Cmdlet. In the example below, we are filtering the last one day event messages:
|
1 2 3 4 5 6 7 |
Get-WmiObject -Class "SqlErrorLogEvent" -ComputerName R2D2 -Namespace "Root\Microsoft\SqlServer\ComputerManagement11"| Where-Object { $_.ConvertToDateTime($_.LogDate) -ge ((Get-Date).adddays(-1))} | select FileName, InstanceName, @{Expression={$_.ConvertToDateTime($_.LogDate)};Label = 'Logdate'}, Message, Processinfo |
We also noticed that the WMI Computer Management Provider, unlike WMI for Server Events, reports on all SQL Server instances in the Server. This means that, so far, we only read the Error Log from the default SQL Server Instance. The -computername parameter in the GET-WMIObject refers to the name of the Server, not the SQL Server Instance.
Now imagine that you have five SQL Server Instances in the Server ObiWan and you need to read the Error Log from the fourth instance called ObiWan\INST4, which is, of course, offline. How to perform this operation? In this case, my friend, the Windows Query Language (WQL) is your best and only friend.
In order to read the Error Log in the Server R2D2, specifically the SQL Server Instance R2D2\INST4, we first need to query the InstanceName Property ‘INST4’ and so we will use the -Query property :
|
1 2 3 4 5 6 7 |
$WQL = "Select * from SqlErrorLogEvent where InstanceName = 'INST4'" Get-WmiObject -Query $WQL -ComputerName Obiwan -Namespace "Root\Microsoft\SqlServer\ComputerManagement11"| select Filename, InstanceName, @{Expression={$_.ConvertToDateTime($_.LogDate)};Label = 'Logdate'}, Processinfo, message |
To filter errors, we can do the same process with the Get-SQLErrorLog cmdlet using Where-Object, or we can use the WQL as well. In this case we need to create the conditions in the WQL using the Message property:
|
1 |
$WQL = "Select * from SqlErrorLogEvent where (Message like '%Error%' or Message like '%Fail%' ) and (not message like '%Found 0 Errors%') and (not message like '%without errors%')" |
And to query only the SQL Server Instance INST4, it is just a case of adding the condition in the WQL:
|
1 |
$WQL = "Select * from SqlErrorLogEvent where (Message like '%Error%' or Message like '%Fail%' ) and (not message like '%Found 0 Errors%') and (not message like '%without errors%')and (InstanceName = 'INST4')" |
To sort by date, it is also the same process. Just pipe the Sort-Object by LogDate before Select-Object and after Get-WMIObject.
Summary
In this article we discuss how to read and effectively filter errors, warnings or any other type of event, using the SQL Server Error Log in an Online and Offline SQL Server Instance. We also discovered how to use the Event Viewer and its parameters to filter the events searching for possible issues in the System, Security and Applications Event Logs.
In the example code, we use the enhanced version of Get-SQLErrorLog that does not require the installation of SQLPSX, and which accepts both string arrays and pipleline input. The SQLPSX version can, however, be used for most examples and can be made to operate on several instances by means of the techniques described in the article. The Get-SQLErrorLog can be downloaded from the link below.
This document contains proprietary information and is protected by copyright law.
Copyright © 2026 Red Gate Software Limited. All rights reserved


Load comments