

To keep a database system running without hitches, you have to know of anything out of the ordinary that has happened. You need to know about events, error conditions, extreme loading, problems with the hardware, security issues, performance-related conditions, failed processes, rollbacks, deadlocks, long-lasting processes, ‘expensive’ cached query plans, and a range of other factors that could signal trouble. It is not enough to occasionally browse the error logs: you need to be notified.
“In a sense, a database
experiences discomfort
and pain”
In a sense, a database experiences discomfort and pain. Any organism needs to feel pain in order to take action to do something about the cause of the pain. A database needs to react to ward off the possibility of failure, and the DBA must be able to respond as quickly as possible to signs of potential failure, or when actual failures occur. Alerts are provided to allow the programmer or administrator to react. If you are involved in supporting a high-availability server, you’ll know that the skill is in heading off problems at the first signs of trouble. To see those signs, you’ve got to be on the lookout for them, but you must ensure that they are drawn to your attention. Alerts provide the means to do this.
Terminology
A few terms before we start: an alert is defined as an automated response to an event. The term “event” in SQL Server is not particularly well-defined. In previous SQL Server versions, an event was anything that could be written to the SQL Server Error Log, and, in later versions, the Windows Application Event Log. Currently, an event seems to mean “any state or condition in SQL Server that can cause an alert”.
In any case, events that are generated by SQL Server are also, by default, written to the Microsoft Windows application log. The SQL Server Agent reads the application log and compares any events it finds there to alerts that you may have defined. When SQL Server Agent finds a match, it fires an alert.
You can define alerts, using SSMS, TSQL or SMO, to respond to:
- SQL Server events – based on the occurrence of specific errors, or errors of a specific severity, and so on.
- Performance conditions. – You might define a performance counter on a certain object and set an alert to be fired when a certain threshold condition is reached.
- Windows Management Instrumentation (WMI) events – an alert is raised when a specific SQL Server event occurs that is monitored by the WMI Provider for Server Events.
In the procedural world, you’d think of the alerting system as the place where you define call-backs to your code on various database conditions. In SQL Server, you define an alert to inform you of errors, events or conditions, so that you can take remedial action. Some events require investigation; some can be dealt with by a script. Others require both. SQL Server alerts can be set up to send a message, or to execute a script. The messages sent to an operator, or administrator, to inform them of an event are referred to as notifications.
Q: Structure or what? A: What
“The original design
was for a crude
but effective system”
Alerts were a late arrival in the evolution of SQL Server. The original design was for a crude but effective system, based in SQL Server Agent, which simply read the SQL Server Error log (now it reads the Application log) and scanned for errors of a particular type or severity. Upon finding one, it could start a TSQL Job and send a message as a notification. This was useful, but provided little information that could be used to take preventative measures before an error happened.
When the means of monitoring SQL Server performance became more sophisticated, two separate notification systems were devised. One of these was based in the operating system, using Performance Monitor, and provided both notifications and command-line executables. The other one used the alerting service of SQL Server Agent, and provided for the triggering of TSQL-based Agent jobs as well as notifications. This latter system has the SQLServer counters, but not the general Operating system ones.
Finally, when WMI was introduced in SQL Server 2005, it seemed an obvious idea to allow the Alerting system to make WMI queries, so a fourth type of Alert was added. The WMI alerting system is comprehensive, and covers aspects that the previous systems missed, but is wildly complicated for a busy DBA to get to grips with.
SQL Server Event Alerts
Very often, the programmer is happy to present the end-user of the database with all error information. This is a bad idea. If, for example, the transaction log has run out of space, there isn’t much the end-user can do other than to phone the DBA, panic, or curse the IT department. A simple use of alerts is to allow the DBA or developer to receive a copy of any error that can appear in the error log, as pager alerts, emails, or SMS messages.
Defining Alerts
Events are generated by Microsoft SQL Server and, if they are flagged as being ‘logged’, are entered into the Microsoft Windows application log and SQL Server Error log. The SQL Server Agent, which is a separate application, reads the application log in order to see if any events that have been written there have been defined by you in an alert. If so, the Agent fires whichever alert defines the error in the most precise way. This means that a specialised alert that is triggered by an event with a particular error number will be chosen rather than a more general one that will fire if it is of a particular severity.
You can set up an alert from SSMS:
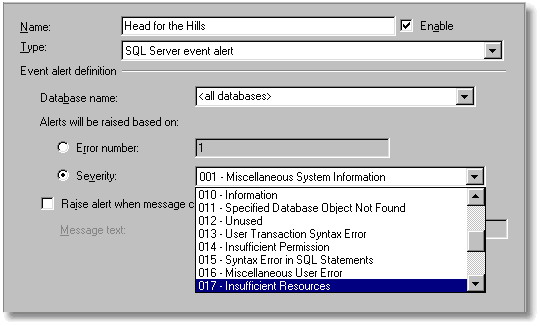
You can raise alerts based on the error number or the error severity. This means that it is pretty easy to define an alert that will fire on every error, for an error of the specified severity level, and give you an email notification.
A curiosity of the SQL Server Event Alerts is that you cannot configure an alert that fires on all events above a particular severity level. To get anywhere near providing a ‘catch-all’ alert, you need a performance alert, which we’ll come to. If you wish to stick to SQL Server Event alerts, you will need to create alerts for every severity level. This gets very boring to do via SSMS, and it is much easier to do in a script. However, it is a job that only needs to be done once for an application in order to get effective alerting for your ‘loggable’ errors.
You can then go on to create a more sophisticated alerting system, based on alerts that fire only on specific errors. When an error occurs, the alerting system selects the alert that covers the error, rather than one that fires on a type of error.
If you specify the Error number, then you can respond to very specific events, such as
an attempt to query the virtual table, DBLog without being a member of the sysadmin fixed server role or the db_owner fixed database role (9010). The full list of errors, in master.sysmessages, is imposing, and a quick glance through the documentation at the seven thousand odd events will convince you that adding an alert for every error would be impossible See Troubleshooting (SQL Server 2000) System Error Messages
Often, you will want to specify which database should be the source of events that you want the alert to respond to, rather than accept any events. You can even specify that the error must contain a particular string, such as a user associated with suspicious activity. (this would be useful for searching for a message such as Server user Phil_Factor is not a valid user in database ‘CreditCardDetails’ )
Sometimes, events will fire repeatedly over a short period of time. In this case, you may want to know that the event has occurred, but you may not want an alert for every event. To avoid getting repeated messages, you can specify a delay after the alert responds to an event, in which case SQL Server Agent waits for the delay specified before responding again, regardless of whether the event occurs during the delay. You can also disable, and re-enable an alert programmatically.
Logging Errors
SQL Server Agent takes these errors from the error log, so if follows that the errors must be logged in the first place. There is no way of attaching alerts to errors that aren’t logged. All error messages with a severity level from 19 through 25 are written to the error log automatically.
So, what if you want to log information messages, or messages of low severity? If you wish to have an alert on any errors that are of a severity less that 19, then you have to modify their entry in the sysmessages table to set them to be always logged. You do this using sp_alterMessage with the WITH_LOG option to set the dLevel column to 128 . If a message has been altered to be WITH_LOG, it is always subsequently written to the application log, however the error happens. Even if RAISERROR is executed without the WITH LOG option, the error that you have altered is written to the application log, and is therefore spotted by the alert. There are good reasons for wanting to do this, as it will then log, and optionally alert you to, syntax errors that are normally seen only by the end-user.
You can force any error that is triggered programmatically to be written to the error log by using the WITH LOG parameter with the RAISERROR command. So, with a user-defined error severity (9) you can log an incident, cause an alert to be fired, which in turn emails someone, or runs a job, simply by using RAISERROR. Naturally, because the job that responds to the alert can be run by the Agent under a different User, you do not need to assign unsafe permissions to the ordinary user. You can use xp_LogEvent if, as is likely, you do not want the user to see the error. (Only the Raiserror call can utilize the ‘PrintF’ formatting placeholders in the error messages, so logging the error with a formatted message using xp_logevent results in a literal recording of the message, string format identifiers and all.)
Error Severity Levels
Errors with the higher severity levels are something you need to know more about, especially if a user is going to phone you anyway after seeing a scary message in his application. The severity levels provide the best means of creating a general-purpose alerting system, supplemented by special alerts for common problems, such as TempDB running out of space.
- Severity level 10 – 16
- are generally generated though mistakes by users, problems in the TSQL scripts and stored procedures executed by users. A number of programming errors and input problems can cause this sort of error. The problem here is that they aren’t logged and it isn’t normally possible to get them logged.
- Severity levels from 17 (Insufficient Resources) and 18 (Nonfatal Internal Error Detected)
- are generated by resource or system errors; the user’s session is not interrupted.
- Severity levels from 17 through 19
- require the attention of the DBA, who can then get more information by executing DBCC CHECKDB (database) to find out more about the extent of the damage. A severity level of 19 (SQL Server Error in Resource) will stop the current batch.
- Severity levels 20 (SQL Server Fatal Error in Current Process), 21 (SQL Server Fatal Error in Database dbid Processes), 22 (SQL Server Fatal Error Table Integrity Suspect), 23 (SQL Server Fatal Error: Database Integrity Suspect), 24 (Hardware Error) and 25
- Indicate system problems. Errors messages with a severity level of 20 or higher are considered fatal errors and terminate the client connection. Errors messages in this range may affect all of the processes in the database, and may indicate that a database or object is damaged. These errors are fatal to the process running at the time. The process will record diagnostic information, and then terminate.
Tokens: passing information from alert to job
Tokens are extraordinarily important for creating anything but the very simplest alerting system. If you use an alert to fire a job, you then get a number of useful bits of information passed to the job, which can then be used to pass more information to whatever system you put in place to remedy the problem.
This information is provided to the job as macros or ‘Tokens’. Except for the WMI token, these have been in place since SQL Agent 7.0 and 2000.As these token are not well-known I’ll list them here:
|
Token |
Description |
|
(A-DBN) |
The Database name is passed to the Job from the alert in this macro |
|
(A-SVR) |
The Server name is passed to the Job from the alert in this macro |
|
(A-ERR) |
The Error number is passed to the Job from the alert in this macro |
|
(A-SEV) |
The Error severity is passed to the Job from the alert in this macro |
|
(A-MSG) |
The Message text is passed to the Job from the alert in this macro (this will include the error number and severity as strings) |
|
(DATE) |
The Current date (in YYYYMMDD format). |
|
(INST) |
The Instance name. For a default instance, this token is empty. |
|
(JOBID) |
The Job ID |
|
(MACH) |
Computer name. |
|
(MSSA) |
Master SQLServerAgent service name. |
|
(OSCMD) |
Prefix for the program used to run CmdExec job steps. |
|
(SQLDIR) |
The directory in which SQL Server is installed. (By default, this value is C:\Program Files\Microsoft SQL Server\MSSQL.) |
|
(STEPCT) |
Step Count: A count of the number of times this step has executed (excluding retries). (Can be used by the step command to force termination of a multistep loop.) |
|
(STEPID) |
Step ID. |
|
(SRVR) |
The Server. Name of the computer running SQL Server. If the SQL Server instance is a named instance, this includes the instance name. This can be different from the server that was the source of the event |
|
(TIME) |
Current time (in HHMMSS format). |
|
(STRTTM) |
The time (in HHMMSS format) that the job began executing. |
|
(STRTDT) |
The date (in YYYYMMDD format) that the job began executing. |
|
(WMI( property )) |
WMI Property. For jobs that run in response to WMI alerts, the value of the property specified by property. For example, $(WMI(DatabaseName)) provides the value of the DatabaseName property for the WMI event that caused the alert to run. |
Tokens are replaced at runtime like traditional Macros, before the job step is executed. They are, unfortunately, case-sensitive, and you get unexplained errors if you leave spaces around brackets. They need to be handled with care because, if you are not aware of them, then they can cause unintended chaos in your code. They are notoriously hard to debug with anything more sophisticated than a ‘PrintF’. I usually write the results of the macro substitution to a table, before executing them as SQL, just to check that all is well.
As tokens are strings, you need to use special macros to ensure that they execute. Actually, you now have to use them even if you don’t think you need them. This is why the ESCAPE_NONE macro is provided.
SQL Server Agent Escape Macros
|
Escape Macros |
Description |
|
$(ESCAPE_SQUOTE( token_name )) |
Escapes single quotation marks (‘) in the token replacement string. Replaces one single quotation mark with two single quotation marks. |
|
$(ESCAPE_DQUOTE( token_name )) |
Escapes double quotation marks (“) in the token replacement string. Replaces one double quotation mark with two double quotation marks. |
|
$(ESCAPE_RBRACKET( token_name )) |
Escapes right brackets (]) in the token replacement string. Replaces one right bracket with two right brackets. |
|
$(ESCAPE_NONE( token_name )) |
Replaces token without escaping any characters in the string. This macro is provided to support backward compatibility in environments where token replacement strings are only expected from trusted users. For more information, see “Updating Job Steps to Use Macros,” later in this topic. |
Be warned: in SQL Server 2005, these tokens are disabled ‘for security reasons’. Before you use these tokens, you must enable their use by right-clicking SQL Server Agent in Object Explorer, selecting Properties, and on the Alert System page, selecting ‘Replace tokens for all job responses to alerts‘.
In SQL Server 2005, the SQL Server Agent job step token syntax has changed. Now, an escape macro must now accompany all tokens used in job steps, or else those job steps will fail (see http://msdn2.microsoft.com/en-us/library/ms175575.aspx) . It is therefore best to write all tokens with escape macros around them so as to be backward-compatible. An example should make that clear.
Here is a job step that writes any error passed to it from a SQL Server event, and includes the full text of the error, with the severity and error number, so you can put it into your database application’s own private log. You’ll see that it includes the database and server as well, just in case you aggregate these messages into an enterprise-wide report.
|
1 2 |
INSERT INTO activityLog (TYPE,logstring,comment) SELECT 204,'SQLServerError','on database: $(ESCAPE_SQUOTE(A-DBN)), Server: $(ESCAPE_SQUOTE(A-SVR)): $(ESCAPE_SQUOTE(A-MSG)) |
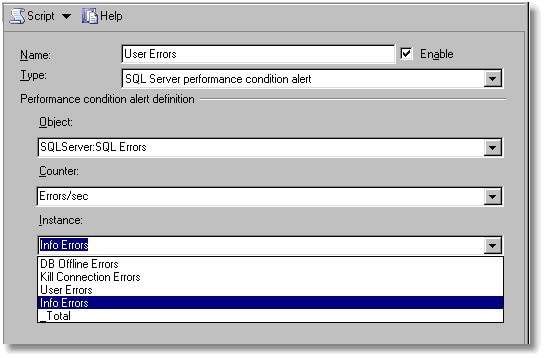
SQL Server Performance Alerts
It is not just errors and events that can trigger alerts. You can specify an alert that will fire in response to a particular performance condition. In this case, you specify which performance measure the alert should monitor, a threshold for the alert, and the behavior of the counter that will trigger the alert. To define a performance alert, in SSMS, you set the:
- ‘Object’ or type of performance measure to be monitored.
- ‘Counter’, or attribute of the measure to be monitored.
- Specific ‘instance’ (if any) of the attribute to be monitored.
- The threshold for the alert (a number)
- The behavior that produces the alert (e.g. ‘falls below’, ‘becomes equal to’, or ‘rises above’ a number specified for performance condition counter.
By way of example, if you wanted to set an alert to occur on ‘SQLServer:Locks’ (object) when the Lock Requests/sec (counter), the number of new locks and lock conversions per second requested from the lock manager, exceeds 10, then you would choose ‘rises above’ (behaviour) and specify 10 (threshold) as the value.
You might want to set an alert to occur when ‘SQLServer:Transactions’ (object), ‘Free Space in TempDB (kb)‘ (counter) ‘falls below’ (behaviour) 200 (threshold) so you can see the cause, such as a long-running process holding a temporary table or a process creating multiple ‘permanent temporary’ tables (see the excellent Troubleshooting Insufficient Disk Space in tempdb)
Another obvious alert is one that warns of an error being written to the error log. This uses SQLServer:SQL Errors object, with the Errors/Sec counter with the User Errors instance. This will fire an alert for all SQLServer errors.
There are a number of ‘objects’ on which performance alerts can be set:
- SQLServer:Access Methods
- SQLServer:Backup Device
- SQLServer:Broker Activation
- SQLServer:Broker Statistics
- SQLServer:Broker / DBM Transport
- SQLServer:Buffer Manager
- SQLServer:Buffer Node
- SQLServer:Buffer Partition
- SQLServer: Catalog Metadata
- SQLServer:CLR
- SQLServer:Cursor Manager by Type
- SQLServer:Cursor Manager Total
- SQLServer:Database Mirroring
- SQLServer:Databases
- SQLServer:ExecStatistics
- SQLServer:General Statistics
- SQLServer:Latches
- SQLServer:Locks
- SQLServer:Memory Manager
- SQLServer:Plan Cache
- SQLServer:SQL Errors
- SQLServer:SQL Statistics
- SQLServer:Transactions
- SQLServer:User Settable
- SQLServer:Wait Statistics
The number of individual counters within these objects is just too many to list. If you take just one of these objects (SQLServer:General Statistics ) you’ll see:
- Counters for Active Temp Tables
- Event Notifications Delayed Drop
- HTTP Authenticated Requests
- Logical Connections
- Logins/sec
- Logouts/sec
- Mars Deadlocks
- Non-atomic yield rate
- Processes blocked
- SOAP Empty Requests
- SOAP Method Invocations
- SOAP Session Initiate Requests
- SOAP Session Terminate Requests
- SOAP SQL Requests
- SOAP WSDL Requests
- Temp Tables Creation Rate
- Temp Tables For Destruction
- Trace Event Notifications Queue
- Transactions
- User Connections
Faced with the huge variety of event counters that can be used to fire alerts, there really is no alternative but to leap headfirst into Books Online. Be assured, that there are counters for every imaginable conditions and some that are unimaginable.
A curious behavior of some of these alerts is that the alerts often fire continuously (every twenty seconds) even when the counter is no longer at the specified level. I take the precaution of disabling, and then re-enabling the counter in the associated job if this happens. It is difficult to reconcile this with the documentation and I’m curious as to why this happens.
Windows Management Instrumentation alerts
The WMI alert provides far more information than is possible by using the previous types. Be warned, though, that you need to allow plenty of time to get WMI alerts working. This is not for the faint-hearted.
SQL Server Agent can, in SQL Server 2005, raise alerts after the occurrence of Windows Management Instrumentation (WMI) events. SQL Server Agent can respond to SQL Server WMI events, as well as to WMI events raised by the operating system and other WMI providers. SQL Agent can even be persuaded to respond to remote WMI events but Microsoft does not encourage this.
There are a vast host of WMI variables that are available as alerts. These are to be found documented as “Trace Events for Use with Event Notifications”. These WMI variables are what the Agent uses as a mechanism for accessing WMI tokens.>
To create a WMI alert, you must specify the WMI namespace that is provided to query for events. Each instance of SQL Server 2005 has its own WMI namespace, which defaults to:
\\.\root\Microsoft\SqlServer\ServerEvents\instance_name.
The instance_name defaults to MSSQLSERVER in a default installation of SQL Server.
To create a WMI event, you need to specify the WMI variable that will be used. WMI variables are accessed by a variety of SQL syntax called ‘Windows Management Instrumentation Query Language’ (WQL). SQL Server Agent submits a WQL request, receives WMI events, and runs a job in response to the event. Several Service Broker objects are involved in processing the notification message, but the WMI Event Provider handles the details of creating and managing these objects. Because of the underlying use of Service Broker, it must be enabled in msdb as well as in the database you are monitoring, before you can hope for SQL Server Agent to receive WMI events.
A WQL query references the event to set up the WMI Alert, using “SELECT * FROM <my_event>” syntax. To make this work, one must configure SQL Server Agent to “Replace tokens for all job responses to alerts” By checking the appropriate box. (Microsoft say that this is a security precaution).
SQL Server Agent is able to parse and replace strings at run time in job step commands, output files, and alerts by using tokens. In SQL Server 2005 the syntax has changed from “[X]” to “$(X)” where X is the token name. As a result, token names no longer conflict with existing database objects.(see What’s New in SQL Server Agent for Microsoft SQL Server 2005). One must also use macros for WMI tokens as documented in http://support.microsoft.com/kb/915845/en-us ‘…when the jobs contain job steps that use tokens…’
The Pile of Logs
- The SQL Server error log
- This was the original log for SQL Server when it morphed from Sybase. As well as events, the SQL Server startup conditions, the results of backup and restore operations, automatic recovery messages, kernel messages, errors in user connections, server-level error messages, the results of batch commands, or other scripts and processes are written to the SQL Server Error Log. The SQL Server Error log is written out as a plain ASCII file and is located at …
….Program Files\Microsoft SQL Server\MSSQL.n\MSSQL\LOG\ERRORLOG and ERRORLOG.n files. - A new error log is created each time an instance of SQL Server is started, although the sp_cycle_errorlog system stored procedure can be used to cycle the error log files without having to restart the instance of SQL Server. Typically, SQL Server retains backups of the previous six logs and gives the most recent log backup the extension .1, the second most recent the extension .2, and so on. The current error log has no extension. The errors in the Error log duplicate those in the Application event log,. Messages about and any automatic recovery strategies attempted are written into the SQL Server Error log..
- SQL Server Agent Error Log
- SQL Server Agent has its own error log. This records warnings and errors about potential problems, such as “Job <job_name> was deleted while it was running.” or “Unable to start mail session.” Error messages can be sent as notifications
- SQL Server maintains up to nine SQL Server Agent error logs. Each archived log has an extension that indicates the relative age of the log. For example, an extension of .1 indicates the newest archived error log and an extension of .9 indicates the oldest archived error log.
- Like the SQL Server ErrorLog, the SQL Server Agent ErrorLog is stored in a text file on the server. usually in the subdirectory \MSSQL\Log under the location were the SQL Server Instance’s code is installed.
- SQL Server Setup Log
- The SQL Server 2005 Setup log is usually located at %ProgramFiles%\Microsoft SQL Server\90\Setup Bootstrap\LOG\Summary.txt. This SQL Server Setup Log
- Will show a component failure, the details of which will be found in that component’s log, which is in the …
…%Program-Files%\Microsoft SQL Server\90\Setup Bootstrap\LOG\Files directory. - SQL Server Agent service history log
- The progress and outcome of all jobs is stored in system tables in msdb. These also contain a description of any errors, so should be monitored.
- the Application Event log,
- SQL Server can also use write to the Application event log, Any application-generated system errors are written into the Application log. The Windows application log provides an overall picture of events that occur on the Windows operating system because they are a common repository for system and application errors. All errors written to the SQL Server Error Log are, by default, duplicated to the Application event log. This is useful because the Event Viewer logs are addressable from remote machines, allowing centralized error handling in enterprise systems
- Security Event log
- Because user connection issues are sometimes rooted in the Windows NT security system, the DBA will need to check this. These problems are usually easily recognized when SQL Server reports that access to a specific resource has been denied.
- System Event log
- SQL Server problems can be caused by the failure of other services, which will be recorded in this log.
Alert Gotchas
- Has the account the SQLServerAgent services runs under got sufficient rights to do what you want?
- Is the alert enabled?
- Is The SQL Server Agent service running.
- Does the event appear in the Event log?. If not, then use sp_altermessage to force it to be logged
- If you’re using xp_logevent to trigger events, be aware that xp_logevent does not trigger an alert unless the @database_name for the alert is ‘master’ or NULL.
- When did the alert last work? Check the history values of the alert to determine the last date that the alert worked.
- Is the counter value maintained for at least 20 seconds?
- If things don’t work as expected, Check the SQL Server error log, job history and SQL Server Agent error log for errors
- Have you specified the message recipient correctly?
- Have you switched on the use of tokens in Job Steps? (see above)
- Are you enclosing your tokens in ‘Escape Macros’ (See above)
- Is the client, on which a WMI management application originates, a Windows authenticated login or group in the instance of SQL Server specified in the application’s connection string of the application?
- Has the calling application cot the correct permissions in the database to create the required event notifications.
- Have you enabled Service Broker before using WMI alerts? (use
1SELECT name, is_broker_enabled, service_broker_guid FROM sys.databases;
..to check this
Essential reading
This document contains proprietary information and is protected by copyright law.
Copyright © 2026 Red Gate Software Limited. All rights reserved


Load comments