In the Tuning Red Gate series I’ve shown you how to look at a current load on the system and how to drill down to look at historical analysis of the system. I’ve also shown how you can see the top queries and other information from the current status of the system. I have one more thing I can show you before we need to start fixing things and showing how that affects the data collected, historical moments in time.
For example, back in Post #3 I was looking at some spikes in some of the monitored resources that were taking place a couple of weeks back in time. Once I identify a moment in time that I’m interested in, I can go back to the first page of Monitor, Global Overview, and click on the icon:
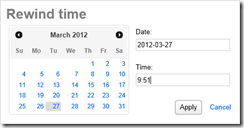
From this you can select the date and time you’re interested in. For example, I saw some serious CPU queues last week:
This then rolls back the time for all the information that’s available to the Global Overview and the drill down to the server and the SQL Server instance there. This then allows me to look at the Top Queries running at this point, sort them by CPU and identify what was potentially the query that was causing the problem right when I saw the CPU queuing
This ability to correlate a moment in time with the information available to you in the Analysis window makes for an excellent tool to investigate your systems going backwards in time. It really makes a huge difference in your knowledge. It’s not enough to know that something happened at a particular time. You need to know what it was that was occurring. Remember, the key to tuning your systems is having enough knowledge about them.
I’ll post more on Tuning Red Gate as soon as I can get some queries rewritten. I’m working on that.


Load comments