
Introduction
A little while ago, I demonstrated a way to create a fairly simple disk space report using PowerShell that would be e-mailed to you whenever one of your servers started to get low on disk space. This was done to help solve a commonly occurring issue that I had to deal with; ensuring that servers did not get to low on disk space. I quickly realised that there are many other ‘health checks’ that I often find myself performing on various servers in my day-to-day job. This got me thinking: It would be great to have a more complete systems report that would be e-mailed through on a daily basis, detailing common statistics and information which would otherwise be a bit of a hassle to gather manually.
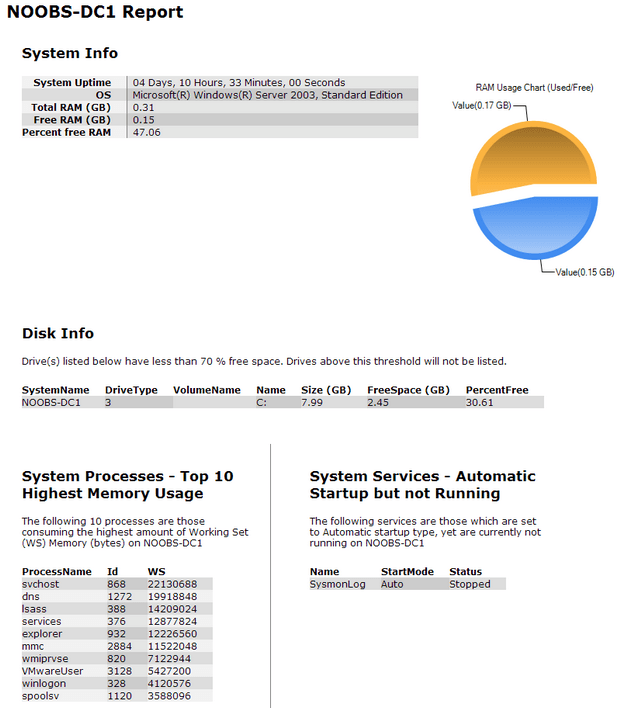
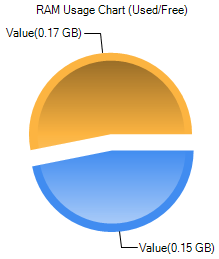
Part of a report, showing the HTML formatting and piechart
Once this report was built, it could also serve as a base for other ‘modules’; allowing anyone to add their own bit of functionality. With this in mind, I set about to achieve this goal of creating an automated systems report with a bit of PowerShell magic.
What else can we report on or monitor?
With PowerShell, I like to believe that just about anything is possible. I am constantly finding more and more tasks that can be achieved using this wonderful scripting language. The answer is therefore “anything really”.
We are going to build a systems report that will convey useful information for every server in a list of server names. Too often I find myself staring at dull, boring PowerShell reports that have been converted to HTML. Not in this case! We’ll be using the Microsoft Chart Controls for .NET 3.5 to add some fancy charts to this to keep our report interesting (and easier) to read. The script will aim to gather all of this information, and then e-mail it all across to you. To save a bit of time, we’ll be leveraging the disk space report script I wrote about here.
By modifying this Systems Report, you could easily build something that is customized more to your setting – perhaps you could report on other services running on your servers, or modify the Create-PieChart function to build charts for other services or performance data.
Here is a list of items we’ll be reporting on for each server in the list:
- System Information
- System Uptime
- OS
- Memory (RAM) Free and Used figures (we’ll also put these into a pie chart)
- Disk Information
- All disks with space less than X (Threshold specified)
- System Processes
- Top 10 Highest Working Set Memory Usage processes
- Services
- Any services that are set to “automatic startup”, yet are found to not be started.
- System and Application Logs
- The last few System or Application Event Logs that were of Error or Warning type
Breaking down the Report Script
To keep things as customizable as possible, I have tried to create the reporting script in a reasonably modular fashion. Therefore, each section of information that the script reports on relies on a PowerShell function or cmdlet that retrieves or builds the information we are after. Let’s break the script down and go through what makes things tick. You can download the script here to follow along.
To start with, in the region named “Variables and Arguments”, we define our customizable variables and parameters such as:
- Mail Server settings (so that the script will email the report to us and knows which SMTP Server to use to send the report).
- Thresholds and Script customizations (so that you can customize the report to give you as much or as little information you need in the final daily report).
- Low Disk Space threshold. By default this is set to 20%.
- Number of Warning or Error type event logs to report on ($EventNum). By default this is set to 3 to retrieve the last 3 event log entries for each Event Log section on each Server.
- Computer/Server list – the variable called $list accepts a text file as an argument. This is mandatory for the script to run – you basically feed a list of computer names in to the script when it is run, and this variable is populated with that list of computer names.
- Lastly, “$Report = @()” creates an empty array variable which we’ll use throughout the script to temporarily hold information for each section that uses this variable.
|
1 2 3 4 5 6 7 8 9 10 11 12 13 14 15 16 17 18 |
# PowerShell Systems Report # Example usage: .\SystemsReport.ps1 .\list.txt # Remember that list.txt is the file containing a list of Server names to run this against #region Variables and Arguments $users = "youremail@yourcompany.com" # List of users to email your report to (separate by comma) $fromemail = "youremail@yourcompany.com" $server = "yourmailserver.yourcompany.com" #enter your own SMTP server DNS name / IP address here $list = $args[0] #This accepts the argument you add to your scheduled task for the list of servers. i.e. list.txt $computers = get-content $list #grab the names of the servers/computers to check from the list.txt file. # Set free disk space threshold below in percent (default at 10%) $thresholdspace = 20 [int]$EventNum = 3 [int]$ProccessNumToFetch = 10 $ListOfAttachments = @() $Report = @() $CurrentTime = Get-Date #endregion |
The Variables and Arguments region
We then have a region defined for the various Functions we’ll be using. Let’s go through these functions one at a time. The first function we have is called “Create-PieChart“. This function relies on the Microsoft Chart Controls for Microsoft .NET Framework 3.5 and allows us to generate a graphical chart on the fly in our script and output it to a .PNG graphic file. So do make sure that the system that is running this script has the Chart Controls installed (don’t worry, as it has a very small system footprint).
|
1 2 3 4 5 6 7 8 9 10 11 12 13 14 15 16 17 18 19 20 21 22 23 24 25 26 27 28 29 30 31 32 33 34 35 36 37 38 39 40 |
Function Create-PieChart() { param([string]$FileName) [void][Reflection.Assembly]::LoadWithPartialName("System.Windows.Forms") [void][Reflection.Assembly]::LoadWithPartialName("System.Windows.Forms.DataVisualization") #Create our chart object $Chart = New-object System.Windows.Forms.DataVisualization.Charting.Chart $Chart.Width = 300 $Chart.Height = 290 $Chart.Left = 10 $Chart.Top = 10 #Create a chartarea to draw on and add this to the chart $ChartArea = New-Object System.Windows.Forms.DataVisualization.Charting.ChartArea $Chart.ChartAreas.Add($ChartArea) [void]$Chart.Series.Add("Data") #Add a datapoint for each value specified in the arguments (args) foreach ($value in $args[0]) { Write-Host "Now processing chart value: " + $value $datapoint = new-object System.Windows.Forms.DataVisualization.Charting.DataPoint(0, $value) $datapoint.AxisLabel = "Value" + "(" + $value + " GB)" $Chart.Series["Data"].Points.Add($datapoint) } $Chart.Series["Data"].ChartType = [System.Windows.Forms.DataVisualization.Charting.SeriesChartType]::Pie $Chart.Series["Data"]["PieLabelStyle"] = "Outside" $Chart.Series["Data"]["PieLineColor"] = "Black" $Chart.Series["Data"]["PieDrawingStyle"] = "Concave" ($Chart.Series["Data"].Points.FindMaxByValue())["Exploded"] = $true #Set the title of the Chart to the current date and time $Title = new-object System.Windows.Forms.DataVisualization.Charting.Title $Chart.Titles.Add($Title) $Chart.Titles[0].Text = "RAM Usage Chart (Used/Free)" #Save the chart to a file $Chart.SaveImage($FileName + ".png","png") } |
The function to create a piechart
As this is a custom function created just for this report, let’s run through it in detail. We begin by loading the assemblies needed to use the .NET Chart components. (System.Windows.Forms and System.Windows.Forms.DataVisualization).
We now create our chart object and define the size of the chart graphic that we want. You can of course adjust the dimensions defined here depending on how large or small you would like your charts in the report to be.
Next we define a Chart Area, which is where our data will be plotted. This is done using the “New-Object” cmdlet. Once created, we add the Chart Area to the Chart object we created beforehand. We then add a data series to the chart, and move on to actually filling the chart with data by taking the arguments passed into the Create-PieChart function and creating data points with these arguments. (The foreach loop will go through each argument and create a data point, then add it to the Data Series).
Now we specify the chart as a pie chart type, and specify some cosmetic settings for our chart such as the label and drawing styles. Lastly we save the pie chart out to a .PNG file in the same directory that the script is being run from.
Our next Function is called “Get-HostUptime“.
|
1 2 3 4 5 6 7 |
Function Get-HostUptime { param ([string]$ComputerName) $Uptime = Get-WmiObject -Class Win32_OperatingSystem -ComputerName $ComputerName $LastBootUpTime = $Uptime.ConvertToDateTime($Uptime.LastBootUpTime) $Time = (Get-Date) - $LastBootUpTime Return '{0:00} Days, {1:00} Hours, {2:00} Minutes, {3:00} Seconds' -f $Time.Days, $Time.Hours, $Time.Minutes, $Time.Seconds } |
The function to Calculate the Host uptime
This is a fairly simple PowerShell function which has a nice self-explanatory name. It takes a parameter called ComputerName and uses this in a Get-WMIObject call to fetch various Operating System information from the computer specified. The script then singles out the “LastBootTime” property and figures out the uptime value by subtracting “LastBootTime” from the current time and date (which is fetched by using a simple “Get-Date” call). A nicely formatted uptime value is returned at the end which will display nicely in our Report for each system.
For our HTML report to look half decent, we need to specify some HTML and CSS. We build the HTML header into an array called $HTMLHeader. This contains some standard HTML header code as well as some CSS for the various headings, text and more importantly, tables in our report. This will apply to all the plain tables that are generated by PowerShell in our final report and present us with something more interesting to look at in the final product.
|
1 2 3 4 5 6 7 8 9 10 11 12 13 14 15 16 17 18 19 20 21 22 23 24 25 26 27 28 29 30 31 32 33 34 35 36 37 38 39 40 41 42 43 44 45 46 47 48 49 50 51 52 53 54 55 56 57 58 59 60 61 62 63 64 65 66 67 68 69 |
# Assemble the HTML Header and CSS for our Report $HTMLHeader = @" <!DOCTYPE HTML PUBLIC "-//W3C//DTD HTML 4.01 Frameset//EN" "http://www.w3.org/TR/html4/frameset.dtd"> <html><head><title>My Systems Report</title> <style type="text/css"> <!-- body { font-family: Verdana, Geneva, Arial, Helvetica, sans-serif; } #report { width: 835px; } table{ border-collapse: collapse; border: none; font: 10pt Verdana, Geneva, Arial, Helvetica, sans-serif; color: black; margin-bottom: 10px; } table td{ font-size: 12px; padding-left: 0px; padding-right: 20px; text-align: left; } table th { font-size: 12px; font-weight: bold; padding-left: 0px; padding-right: 20px; text-align: left; } h2{ clear: both; font-size: 130%; } h3{ clear: both; font-size: 115%; margin-left: 20px; margin-top: 30px; } p{ margin-left: 20px; font-size: 12px; } table.list{ float: left; } table.list td:nth-child(1){ font-weight: bold; border-right: 1px grey solid; text-align: right; } table.list td:nth-child(2){ padding-left: 7px; } table tr:nth-child(even) td:nth-child(even){ background: #CCCCCC; } table tr:nth-child(odd) td:nth-child(odd){ background: #F2F2F2; } table tr:nth-child(even) td:nth-child(odd){ background: #DDDDDD; } table tr:nth-child(odd) td:nth-child(even){ background: #E5E5E5; } div.column { width: 320px; float: left; } div.first{ padding-right: 20px; border-right: 1px grey solid; } div.second{ margin-left: 30px; } table{ margin-left: 20px; } --> </style> </head> <body> "@ |
The HTML Header ‘HereString’
Now we’ll look at the primary work horse of our reporting script – the main “foreach” loop. In this section, for every computer (server) listed in our $computers list, we loop through the various PowerShell script and cmdlets that retrieve the other information we will be reporting on, all the while appending this information to our $HTMLMiddle array which holds the bulk of our report. In this way, we can loop through every computer or server, gather the information we are looking for, and store it in this array. At the very end of the script we will add the HTML Header, Middle, and End sections together, giving us our final report. Let’s have a quick look at what the main loop covers then…
Starting off, we use the familiar disk space reporting script I talked about earlier to fetch information about any disks that are below the specified threshold percentage in disk space. For this we use the Get-WMIObject cmdlet to gather the relevant information and convert it into an HTML table by piping the output to the ConvertTo-HTML cmdlet at the end.
|
1 2 |
$DiskInfo= Get-WMIObject -ComputerName $computer Win32_LogicalDisk | Where-Object{$_.DriveType -eq 3} | Where-Object{ ($_.freespace/$_.Size)*100 -lt $thresholdspace} ` | Select-Object SystemName, DriveType, VolumeName, Name, @{n='Size (GB)';e={"{0:n2}" -f ($_.size/1gb)}}, @{n='FreeSpace (GB)';e={"{0:n2}" -f ($_.freespace/1gb)}}, @{n='PercentFree';e={"{0:n2}" -f ($_.freespace/$_.size*100)}} | ConvertTo-HTML -fragment |
The Disk space Reporting script
The Operating System name for the current machine is gathered and stored into the $OS variable. To report on Memory figures for each computer or server, we fetch some more Operating System information and store this in the $SystemInfo variable, again using the Get-WMIObject cmdlet. From this point, we then break this up into other variables to store figures such as the Total, Free and Used RAM for each system. We clean up this information a little bit by using built-in [Math] functions to round off the decimal places on each figure.
|
1 2 3 4 5 6 7 8 9 10 11 12 |
#region System Info $OS = (Get-WmiObject Win32_OperatingSystem -computername $computer).caption $SystemInfo = Get-WmiObject -Class Win32_OperatingSystem -computername $computer | Select-Object Name, TotalVisibleMemorySize, FreePhysicalMemory $TotalRAM = $SystemInfo.TotalVisibleMemorySize/1MB $FreeRAM = $SystemInfo.FreePhysicalMemory/1MB $UsedRAM = $TotalRAM - $FreeRAM $RAMPercentFree = ($FreeRAM / $TotalRAM) * 100 $TotalRAM = [Math]::Round($TotalRAM, 2) $FreeRAM = [Math]::Round($FreeRAM, 2) $UsedRAM = [Math]::Round($UsedRAM, 2) $RAMPercentFree = [Math]::Round($RAMPercentFree, 2) #endregion |
The System Info Region
Next we’ll gather the top ten (default setting) system processes in terms of those which are using the most memory (Private Working Set memory). This one-liner employs the use of the “Get-Process” cmdlet to get a list of the top processes from the specified machine and select the ones we are interested in. It then sorts these on the Working Set Property in descending order and builds us another HTML table of the results to add to our now growing report. As you’ll notice, this information is stored in the $TopProcesses variable.
|
1 |
$TopProcesses = Get-Process -ComputerName $computer | Sort WS -Descending | Select ProcessName, Id, WS -First $ProccessNumToFetch | ConvertTo-Html -Fragment |
Listing the top ten system processes in terms of memory used
Moving on, the Services Report is generated by first declaring an array to use ($ServicesReport) and then fetching a list of services on the machines that are: a) set to “Automatic Startup” and b) currently in a “stopped” state. We do this with a simple “Where” clause in our cmdlet to check for any services that are Stopped and in Automatic Startup mode. After this, we loop through each service in our list of services that were gathered and build a row for our services table, adding information about each service to our row, such as; Name, Service Status and Start Mode. This will give us a good idea of what each service is and what its current state is when viewing the final report each day. Through each loop (each service object we loop through), our $ServicesReport array has the row added. Finally we convert the Services Report into an HTML table for later use in our final report.
|
1 2 3 4 5 6 7 8 9 10 11 12 13 14 15 16 17 |
#region Services Report $ServicesReport = @() $Services = Get-WmiObject -Class Win32_Service -ComputerName $computer | Where {($_.StartMode -eq "Auto") -and ($_.State -eq "Stopped")} foreach ($Service in $Services) { $row = New-Object -Type PSObject -Property @{ Name = $Service.Name Status = $Service.State StartMode = $Service.StartMode } $ServicesReport += $row } $ServicesReport = $ServicesReport | ConvertTo-Html -Fragment #endregion |
The Services report
We then have a similar section called the “Event Logs Report” region. We use the same method we used for gathering the Services information, but this time we use the PowerShell cmdlet for fetching Event Logs called “Get-EventLog“.
|
1 2 3 4 5 6 7 8 9 10 11 12 13 14 15 16 17 18 19 20 21 22 23 24 25 26 27 28 29 |
#region Event Logs Report $SystemEventsReport = @() $SystemEvents = Get-EventLog -ComputerName $computer -LogName System -EntryType Error,Warning -Newest $EventNum foreach ($event in $SystemEvents) { $row = New-Object -Type PSObject -Property @{ TimeGenerated = $event.TimeGenerated EntryType = $event.EntryType Source = $event.Source Message = $event.Message } $SystemEventsReport += $row } $SystemEventsReport = $SystemEventsReport | ConvertTo-Html -Fragment $ApplicationEventsReport = @() $ApplicationEvents = Get-EventLog -ComputerName $computer -LogName Application -EntryType Error,Warning -Newest $EventNum foreach ($event in $ApplicationEvents) { $row = New-Object -Type PSObject -Property @{ TimeGenerated = $event.TimeGenerated EntryType = $event.EntryType Source = $event.Source Message = $event.Message } $ApplicationEventsReport += $row } $ApplicationEventsReport = $ApplicationEventsReport | ConvertTo-Html -Fragment #endregion |
The Events Log report
There are two arrays we build this time – one for System Events ($SystemEventsReport) and one for Application Events ($ApplicationEventsReport). We do this by simply changing the “LogName” parameter for the “Get-EventLogs” cmdlet. In each instance, we convert the final array/table into an HTML table where we later add it to our final HTML report.
Remember that Function we defined at the start called “Create-PieChart“? Well, we’ll now use this to generate our pie chart diagram of memory usage and output the file to the current working directory of our script. Now that we know what our Memory usage figures are (and have these stored in variables) we can specify these figures as parameters in our Create-PieChart function and actually generate the chart. Our chart’s filename is unique as it contains the name of the current computer/server being iterated through in our script ($computer).
|
1 2 3 4 5 6 7 |
# Create the chart using our Chart Function Create-PieChart -FileName ((Get-Location).Path + "\chart-$computer") $FreeRAM, $UsedRAM $ListOfAttachments += "chart-$computer.png" #region Uptime # Fetch the Uptime of the current system using our Get-HostUptime Function. $SystemUptime = Get-HostUptime -ComputerName $computer #endregion |
Creating the Piechart
Just after creating the pie chart, we also add the name of the file that was outputted into an array called $ListOfAttachments. Right at the end, when sending our report out via e-mail, we’ll specify this array for the list of attachments to add to the e-mail (so that our report e-mail has all the images it needs of course)!
The last bit of our main loop ensures that all of the information gathered thus far is added to the $CurrentSystemHTML array. This is a little bit of a tedious section as we manually create some HTML headings and tables using common HTML tags. We also embed our chart image in the HTML using an <IMG> tag. The reason this all needs to be added in the loop, is because this information is all relevant to the current computer or server being looked at by the script. At the end of the loop, you’ll see that we append this HTML to the $HTMLMiddle array where it is stored for the end of our report. Each successive loop of this foreach main loop will add the next system’s information to $HTMLMiddle until we are finished.
|
1 2 3 4 5 6 7 8 9 10 11 12 13 14 15 16 17 18 19 20 21 22 23 24 25 26 27 28 29 30 31 32 33 34 35 36 37 38 39 40 41 42 43 44 45 46 47 48 49 50 51 52 53 54 55 56 57 58 59 60 61 62 63 64 65 66 67 68 |
# Create HTML Report for the current System being looped through $CurrentSystemHTML = @" <hr noshade size=3 width="100%"> <div id="report""> <p><h2>$computer Report</p></h2> <h3>System Info</h3> <table class="list"> <tr> <td>System Uptime</td> <td>$SystemUptime</td> </tr> <tr> <td>OS</td> <td>$OS</td> </tr> <tr> <td>Total RAM (GB)</td> <td>$TotalRAM</td> </tr> <tr> <td>Free RAM (GB)</td> <td>$FreeRAM</td> </tr> <tr> <td>Percent free RAM</td> <td>$RAMPercentFree</td> </tr> </table> <IMG SRC="chart-$computer.png" ALT="$computer Chart"> <h3>Disk Info</h3> <p>Drive(s) listed below have less than $thresholdspace % free space. Drives above this threshold will not be listed.</p> <table class="normal">$DiskInfo</table> <br></br> <div class="first column"> <h3>System Processes - Top $ProccessNumToFetch Highest Memory Usage</h3> <p>The following $ProccessNumToFetch processes are those consuming the highest amount of Working Set (WS) Memory (bytes) on $computer</p> <table class="normal">$TopProcesses</table> </div> <div class="second column"> <h3>System Services - Automatic Startup but not Running</h3> <p>The following services are those which are set to Automatic startup type, yet are currently not running on $computer</p> <table class="normal"> $ServicesReport </table> </div> <h3>Events Report - The last $EventNum System/Application Log Events that were Warnings or Errors</h3> <p>The following is a list of the last $EventNum <b>System log</b> events that had an Event Type of either Warning or Error on $computer</p> <table class="normal">$SystemEventsReport</table> <p>The following is a list of the last $EventNum <b>Application log</b> events that had an Event Type of either Warning or Error on $computer</p> <table class="normal">$ApplicationEventsReport</table> "@ # Add the current System HTML Report into the final HTML Report body $HTMLMiddle += $CurrentSystemHTML } # Assemble the closing HTML for our report. $HTMLEnd = @" </div> </body> </html> "@ |
The ‘tedious’ end to the main loop.
Finally, we create the $HTMLEnd array which just adds a few closing tags. We then create our final “$HTMLmessage” by adding $HTMLHeader, $HTMLMiddle and $HTMLEnd. By piping $HTMLmessage to “Out-File” we can save the report out to an actual HTML file on the hard disk. We also use the “Send-MailMessage” cmdlet to send us our e-mail with the $HTMLmessage as the body of our e-mail. As long as you provided your SMTP server and address details, after running this script you’ll soon have your first system report arriving in your Inbox!
|
1 2 3 4 5 6 |
# Assemble the final report from all our HTML sections $HTMLmessage = $HTMLHeader + $HTMLMiddle + $HTMLEnd # Save the report out to a file in the current path $HTMLmessage | Out-File ((Get-Location).Path + "\report.html") # Email our report out send-mailmessage -from $fromemail -to $users -subject "Systems Report" -Attachments $ListOfAttachments -BodyAsHTML -body $HTMLmessage -priority Normal -smtpServer $server |
Adding the end tag and sending the email report
Closing off
It is often difficult to be proactive on the job when you constantly have to chase down issues and monitor various remote systems across the network. This is a clear cut case for using PowerShell to help you automate various checks and to repeat those processes that you often find yourself having to do manually. Hopefully this Systems-Reporting script will help bring useful information about your servers directly to your Inbox, as well as catch anything out of place before it becomes too much of an issue.
By modifying the report above you could easily build something that is customized more to your own environment – perhaps you could report on other services running on your servers, or modify the Create-PieChart function to build charts for other services or performance data for example. The sky is the limit when it comes to what PowerShell can do, so do try to think of other areas to report on and get scripting! If you would like to get an idea of what the final report looks like without trying the script yourself, here is a sample I generated from a list of six, Windows Server 2008 R2 machines on a domain. Please do feel free to add any ideas or customizations you may have thought of in the comments section.
The source of the PowerShell script, and a sample report, is in the download link below. You’re welcome to modify it for your own particular requirements.
Load comments