
SQL Server’s built-in PIVOT operator requires knowing the column names in advance – a significant limitation for dynamic result sets where the column count and names vary with the data. This article presents a JSON-based approach using a generic TransposedJSONMatrix function that pivots any result set without requiring prior knowledge of column names. The function uses SQL Server’s JSON support (2016+) to rotate query results dynamically, supporting multiple datatypes and row and column aggregations. The companion Transpose article covers a SQLCLR implementation of the same concept.
The Pivot or Transpose
Many developers just want to ’rotate’, pivot or transpose a result as if it were a matrix. This involves turning columns into rows by, in effect, transposing the two coordinates. There is, of course, a lot of difference between a pivot and a transpose because columns in a SQL Table represent the discrete values of entities, not values in a range. However, we are all faced with data in a table format such as an Excel PivotTable or a tabular report that may be a table but not a relational table. Often, we want to pivot it/do a transpose. Usually, neither a pivot or a tabular report are, strictly, relational tables, but if we are in the midst of delivering meaningful reports, who cares? A lot of systems need reports in a particular format and we have to provide that.
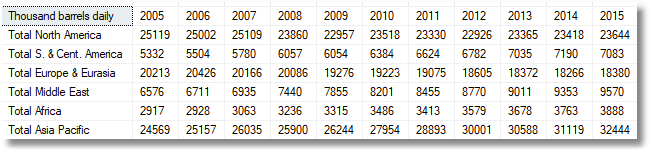
Imagine we get something like this, the world’s oil consumption figures…
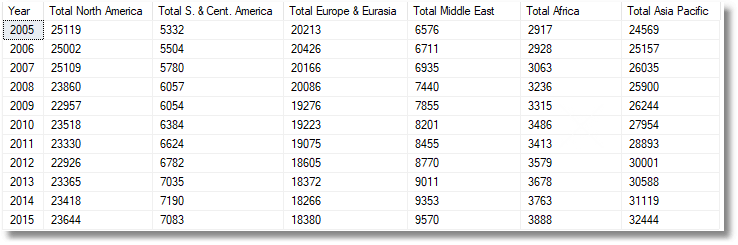
And we need to provide it in this format…
There is a problem here because someone is going to add some columns to represent recent data. What about the two subsequent years at least 2016 and 2017? I’ve recently described some of the classic ways of doing this, and a good brute-force JSON technique to achieve the same, but they have the problem that the code to do the rotation needs to change when those extra rows are added. What about a technique that goes further by transposing/pivoting data of any size? Well, sure, as long as it is a JSON table, but there is just a little essential task at the end to provide the column names and datatypes of the SQL Server result.
A Simple Demonstration
Let’s just demonstrate what I mean as simply as possible. We start with a simple result produced by this test code.
|
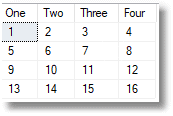
1 2 3 4 5 6 7 8 |
SELECT * FROM ( VALUES (1, 2, 3, 4), (5, 6, 7, 8), (9, 10, 11, 12), (13, 14, 15, 16) ) AS rotated (One, Two, Three, Four); |
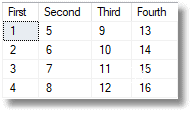
We now transpose it by executing this code using a function I’ll introduce and explain later. (I’ve embedded the values of the original result)
|
1 2 3 4 5 6 |
SELECT * FROM OpenJson((SELECT dbo.TransposedJSONMatrix(( SELECT * FROM (VALUES (1,2,3,4),(5,6,7,8),(9,10,11,12),(13,14,15,16) )rotated(One, Two, Three, Four ) FOR JSON auto)))) WITH ( [First] int '$.Col1',[Second] int '$.Col2', [Third] int '$.Col3', [Fourth] int '$.Col4' ) |
… which produces this…
That line at the end is important because it tells the system function OpenJSON() what columns you want from the JSON document and what SQL Datatype they should be. This task is essential because there is a loss of metadata when a table is converted into JSON. We don’t know much about numbers when they are stored in JSON, only that something is a number.
OK. Now we supply a result of a different size
|
1 2 3 4 5 6 7 8 9 10 |
SELECT * FROM ( VALUES (1, 2, 3, 4, 5), (6, 7, 8, 9, 10), (11, 12, 13, 14, 15), (16, 17, 18, 19, 20), (21, 22, 23, 24, 25), (26, 27, 28, 29, 30) ) AS rotated (One, Two, Three, Four, Five); |
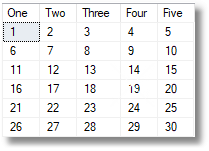
Despite the change in the number of rows and columns, we can use the same routine, unaltered. We just need, when we use the function, to define the extra two columns that result from there being two extra rows in the original.
|
1 2 3 4 5 6 7 |
SELECT * FROM OpenJson((SELECT dbo.TransposedJSONMatrix(( SELECT * FROM (VALUES (1,2,3,4,5),(6,7,8,9,10),(11,12,13,14,15), (16,17,18,19,20),(21,22,23,24,25),(26,27,28,29,30) )rotated(One, Two, Three, Four, Five) FOR JSON auto)))) WITH ( [First] int '$.Col1',[Second] int '$.Col2', [Third] int '$.Col3', [Fourth] int '$.Col4', [fifth] int '$.Col5', [Sixth] int '$.Col6') |
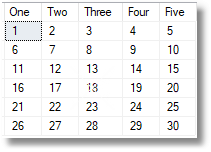 … transposed to…
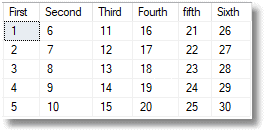
You will have noticed a problem. What about the column headings (One to Five). Those have gone. Shouldn’t we have made them into row headings?
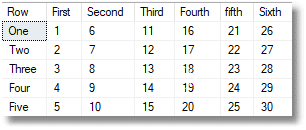
In this particular example of the matrix we don’t have to, but we can. We can reference what were the column headings as another column ‘’$.Col0’’, to transpose what were the row headings into column headings.
|
1 2 3 4 5 6 7 |
SELECT * FROM OpenJson((SELECT dbo.TransposedJSONMatrix(( SELECT * FROM (VALUES (1,2,3,4,5),(6,7,8,9,10),(11,12,13,14,15), (16,17,18,19,20),(21,22,23,24,25),(26,27,28,29,30) )rotated(One, Two, Three, Four, Five) FOR JSON auto)))) WITH ( [Row] VARCHAR(10) '$.Col0',[First] int '$.Col1',[Second] int '$.Col2', [Third] int '$.Col3', [Fourth] int '$.Col4', [fifth] int '$.Col5', [Sixth] int '$.Col6') |
The Generic TransposedJSONMatrix Function
Here is the code of the procedure used in the preceding examples. All we are really doing is to take a matrix of one consistent data type and to transpose it. We can’t add a column of strings, because that would equate to a row of strings in a table of integers which makes no sense in SQL Server. JSON can cope with it without any problem at all, but only because it is not, by default, a way of representing tabular data. All we are really doing is to use the OpenJSON() function to unwrap the JSON into a relational table that records each cell and its value, together with its column and row. We then create a new JSON document with transposed rows and columns. Because we pass JSON in and out of the function we avoid the problems that we’d have with doing the same thing with tables.
|
1 2 3 4 5 6 7 8 9 10 11 12 13 14 15 16 17 18 19 20 21 22 23 24 25 26 27 28 29 30 31 32 33 34 35 36 37 38 39 40 41 42 43 44 45 46 47 48 49 50 51 52 53 54 55 56 57 58 59 60 61 62 63 64 65 66 67 68 69 70 71 72 73 74 75 76 77 78 79 80 81 82 83 84 85 86 87 |
IF Object_Id('dbo.TransposedJSONMatrix','FN') IS NOT NULL DROP FUNCTION dbo.TransposedJSONMatrix GO CREATE FUNCTION dbo.TransposedJSONMatrix (@JSON AS Nvarchar(MAX)) RETURNS Nvarchar(MAX) AS BEGIN /** Summary: > A new way of pivoting results of any length and width This is an inline function that takes a SQL Server result converted to a JSON document and transposes it, or pivots it. It returns the pivoted JSON Author: PhilFactor Date: 21/12/2017 Example: > SELECT * FROM OpenJson((SELECT dbo.TransposedJSONMatrix(( SELECT * FROM (VALUES (1,2,3,4),(5,6,7,8),(9,10,11,12),(13,14,15,16) )OurMatrix([first],[second],[third],[fourth]) FOR JSON auto)))) WITH ( [row] varchar(10) '$.Col0', [First] int '$.Col1',[Second] int '$.Col2', [Third] int '$.Col3',[Fourth] int '$.Col4' ) Returns: > A json file representing the transpose **/ DECLARE @TheMatrix TABLE ( RowNumber INT IDENTITY(1, 1) NOT NULL PRIMARY KEY, --the row number of the row TheColumn INT NULL, --null if the entry corresponds with the row object TheKey NVARCHAR(200) NOT NULL, --the KEY FOR the JSON opject TheValue NVARCHAR(MAX) NOT NULL --the value (json expression if an object) ); /*firstly we unwrap the first level to give us the row number along with each row object */ INSERT INTO @thematrix(TheKey, TheValue) SELECT -- [KEY], Value FROM OpenJson(@json) WHERE type = 5; DECLARE @TheNormalisedVersionOfTheMatrix TABLE (--each row represents a cell colOrder INT IDENTITY NOT null,--we need to know this to get the order right Rownumber INT, --the row number the column is associated with in the matrix RowKey VARCHAR(100), --the key field for the row ColKey VARCHAR(100), --the key for the column TheValue VARCHAR(MAX), --the value in the cell valuetype INT ); INSERT INTO @TheNormalisedVersionOfTheMatrix(RowNumber, RowKey, ColKey, TheValue, ValueType) SELECT TheColumns.RowNumber, TheColumns.TheKey, acolumn.[Key], acolumn.Value, acolumn.Type FROM @TheMatrix AS TheColumns CROSS APPLY OpenJson(TheColumns.TheValue) AS acolumn --unwrap each column WHERE acolumn.Type <> 5; /* now all we have to do is to assemble the JSON from the cells, but transposing rows and columns*/ RETURN -- '[' -- + Stuff --we will be concatenating a list of rows. (( SELECT Max(aLine.theline) FROM @TheNormalisedVersionOfTheMatrix AS EachRow CROSS APPLY ( SELECT -- ',{"Col0":"'+ EachRow.ColKey+'"'--this captures what was the column name + (SELECT ',"Col' + Convert(VARCHAR(8), Rownumber) + '":' --and then + CASE EachNewRowContents.valuetype -- ..we do all the rows WHEN 0 THEN 'NULL' WHEN 1 THEN '"'+ STRING_ESCAPE(TheValue, 'json') + '"' ELSE TheValue end FROM @TheNormalisedVersionOfTheMatrix AS EachNewRowContents WHERE EachNewRowContents.colkey = EachRow.ColKey ORDER BY colorder --we need to make the order explicit FOR XML PATH(''), TYPE -- we sew together then new rows ).value('.', 'varchar(max)') + '}' AS theline ) AS aLine GROUP BY EachRow.ColKey ORDER BY Min(EachRow.colOrder) FOR XML PATH(''), TYPE --and sew together the rows ).value('.', 'varchar(max)'), 1, 1, '') --we do this to knock off the initial comma + ']';-- the JSON array terminator END GO |
Trying it out
Now we can put our generic function through its paces to test it out. Here is the data before the transpose.
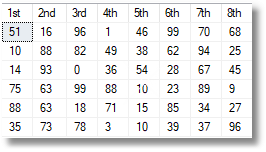
— now we test it out
|
1 2 3 4 5 6 7 8 9 10 11 12 13 14 15 16 17 18 19 20 21 22 23 24 25 26 27 28 29 30 31 32 33 34 35 36 37 |
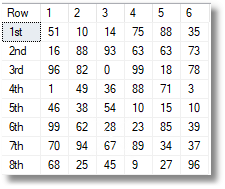
DECLARE @MyMatrixTable TABLE --we want to generate a test table with random integers ( [1st] INT NOT null, [2nd] INT NOT null, [3rd] INT NOT null, [4th] INT NOT null, [5th] INT NOT null, [6th] INT NOT null, [7th] INT NOT null, [8th] INT NOT null ) INSERT INTO @MyMatrixTable([1st], [2nd], [3rd], [4th], [5th], [6th], [7th], [8th]) SELECT [first]*100, [second]*100, third*100, fourth*100, fifth*100, sixth*100 , Seventh*100, eighth*100 FROM (VALUES (Rand(), Rand(),Rand(),Rand(),Rand(),Rand(),Rand(),Rand()), (Rand(), Rand(),Rand(),Rand(),Rand(),Rand(),Rand(),Rand()), (Rand(), Rand(),Rand(),Rand(),Rand(),Rand(),Rand(),Rand()), (Rand(), Rand(),Rand(),Rand(),Rand(),Rand(),Rand(),Rand()), (Rand(), Rand(),Rand(),Rand(),Rand(),Rand(),Rand(),Rand()), (Rand(), Rand(),Rand(),Rand(),Rand(),Rand(),Rand(),Rand()) )RandomNumbers([first], [second], third, fourth, fifth, sixth, seventh, eighth) -- we can avoid iteration for small tables! SELECT * FROM @MyMatrixTable -- we show what it is before the transpose SELECT --and now what it is afterwards * FROM OpenJson(( --this outputs the transposed Matrix SELECT dbo.TransposedJSONMatrix --using our function ( (SELECT * FROM @MyMatrixTable FOR JSON AUTO ) ) ) ) WITH ( [Row] VARCHAR(5) '$.Col0', [1] INT '$.Col1', [2] INT '$.Col2', [3] INT '$.Col3', [4] INT '$.Col4', [5] INT '$.Col5', [6] INT '$.Col6' ); |
After the transpose, the data looks like this:
Now the first example we gave at the start of the article is generated simply by following the same pattern. Remember that this code would be very small were it not for the fact that we are generating the data table as a table-source, using several sets of row value expressions to be constructed into a table via the VALUE table-value constructor. This is useful when running a function through a series of unit tests because it keeps everything in one place.
|
1 2 3 4 5 6 7 8 9 10 11 12 13 14 15 16 17 18 19 20 21 22 23 24 25 |
SELECT * FROM OpenJson((SELECT dbo.TransposedJSONMatrix(( SELECT * FROM (values (25119,25002,25109,23860,22957,23518,23330,22926,23365,23418,23644), --'Total North America' (5332,5504,5780,6057,6054,6384,6624,6782,7035,7190,7083), --'Total S. & Cent. America (20213,20426,20166,20086,19276,19223,19075,18605,18372,18266,18380), --'Total Europe & Eurasia' (6576,6711,6935,7440,7855,8201,8455,8770,9011,9353,9570), --'Total Middle East',6576 (2917,2928,3063,3236,3315,3486,3413,3579,3678,3763,3888), --'Total Africa',2917,2928 (24569,25157,26035,25900,26244,27954,28893,30001,30588,31119,32444) --'Total Asia Pacific' )oilConsumption([2005],[2006],[2007],[2008],[2009],[2010],[2011],[2012],[2013],[2014],[2015]) FOR JSON auto)))) WITH ( [Year] int '$.Col0', --remember that these are the column names of the original table [Total North America] int '$.Col1', [Total S. & Cent. America] int '$.Col2', [Total Europe & Eurasia] int '$.Col3', [Total Middle East] int '$.Col4', [Total Africa] int '$.Col5', [Total Asia Pacific] int '$.Col6' ) |
What about doing other datatypes besides integers?
So far, we’ve stuck resolutely to integers in our matrix. As long as we are consistent, we can use whatever we like. Obviously, if we are pivoting a matrix, the cells will all need to have the same datatype in SQL Server.
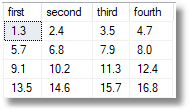
We can to other datatypes. How about numeric?
|
1 2 3 4 5 6 7 8 |
SELECT * FROM OpenJson((SELECT dbo.TransposedJSONMatrix(( SELECT * FROM (VALUES (1.3,2.4,3.5,4.7),(5.7,6.8,7.9,8.0), (9.1,10.2,11.3,12.4),(13.5,14.6,15.7,16.8) )OurMatrix([first],[second],[third],[fourth]) FOR JSON auto)))) WITH ( [row] varchar(10) '$.Col0', [First] NUMERIC(8,1) '$.Col1', [Second] NUMERIC(8,1) '$.Col2',[Third] NUMERIC(8,1) '$.Col3', [Fourth] NUMERIC(8,1) '$.Col4' ) |
 … transposed to …
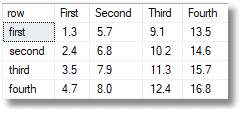
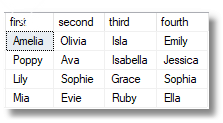
We can do strings too
|
1 2 3 4 5 6 7 8 |
SELECT * FROM OpenJson((SELECT dbo.TransposedJSONMatrix(( SELECT * FROM (VALUES ('Amelia','Olivia','Isla','Emily'),('Poppy','Ava','Isabella','Jessica'), ('Lily','Sophie','Grace','Sophia'),('Mia','Evie','Ruby','Ella') )OurMatrix([first],[second],[third],[fourth]) FOR JSON auto)))) WITH ( [row] varchar(10) '$.Col0', [First] varchar(10) '$.Col1', [Second] varchar(10) '$.Col2',[Third] varchar(10) '$.Col3', [Fourth] varchar(10) '$.Col4' ) |
 … transposed to …
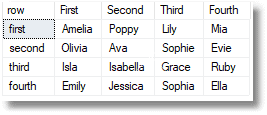
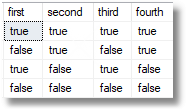
BITs are possible too …
|
1 2 3 4 5 6 7 |
SELECT * FROM OpenJson((SELECT dbo.TransposedJSONMatrix(( SELECT * FROM (VALUES ('true','true','true','true'),('false','true','false','true'), ('true','false','true','false'),('false','false','false','false') )OurMatrix([first],[second],[third],[fourth]) FOR JSON auto)))) WITH ( [row] varchar(10) '$.Col0', [First] bit '$.Col1',[Second] bit '$.Col2', [Third] bit '$.Col3',[Fourth] bit '$.Col4' ) |
 … transposed to …
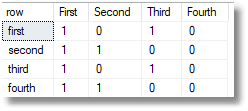
What About the row and column aggregations?
Yes, that first example, the oil consumption totals, needed row and column totals, didn’t it? We wanted to see how the petrol consumption increased over the years.
With a bit of a tweak that I’ll show you in a moment, we can do this (I’ve highlighted the aggregation column and row).
…which, this being my lucky day, checks out if we do the totals using the SUM() function within Excel.
How could we do this so easily? You see, we had to shred the JSON into its normalised form anyway in order to do the transpose, so doing the aggregation within the function was the natural thing to do. Unfortunately, we can’t do every type of aggregation within the one function, and we can’t aggregate every datatype. You will have to build very slightly different functions for each.
There isn’t that much code needed to perform this magic.
Inside the function, after we insert our data into the @TheNormalisedVersionOfTheMatrix table, we have a couple of extra insertions to do to get the extra column and row in.
|
1 2 3 4 5 6 7 8 9 10 11 12 13 |
DECLARE @Rowcount INT = (SELECT Max([@TheNormalisedVersionOfTheMatrix].Rownumber) FROM @TheNormalisedVersionOfTheMatrix); INSERT INTO @TheNormalisedVersionOfTheMatrix ( Rownumber, RowKey, ColKey, TheValue, valuetype) SELECT RowKey + 1, RowKey, 'Total', Sum(Convert(bigINT, TheValue)), 2 FROM @TheNormalisedVersionOfTheMatrix WHERE valuetype = 2 GROUP BY RowKey; INSERT INTO @TheNormalisedVersionOfTheMatrix ( Rownumber, RowKey, ColKey, TheValue, valuetype) SELECT @Rowcount + 1, @Rowcount, ColKey, Sum(Convert(BIGINT, TheValue)), 2 FROM @TheNormalisedVersionOfTheMatrix WHERE valuetype = 2 GROUP BY ColKey; |
I chose a label ‘Total’ for the column totals, and I specified a BIGINT, but you could choose all manner of datatypes, and even do a different aggregation such as average or minimum. Here is the code for the new function:
|
1 2 3 4 5 6 7 8 9 10 11 12 13 14 15 16 17 18 19 20 21 22 23 24 25 26 27 28 29 30 31 32 33 34 35 36 37 38 39 40 41 42 43 44 45 46 47 48 49 50 51 52 53 54 55 56 57 58 59 60 61 62 63 64 65 66 67 68 69 70 71 72 73 74 75 76 77 78 79 80 81 82 83 84 85 86 87 88 89 90 91 92 93 94 95 96 97 98 99 100 101 |
IF Object_Id('dbo.TransposedJSONMatrixWithIntTotals','FN') IS NOT NULL DROP FUNCTION dbo.TransposedJSONMatrixWithIntTotals GO CREATE FUNCTION dbo.TransposedJSONMatrixWithIntTotals (@JSON AS Nvarchar(MAX)) RETURNS Nvarchar(MAX) AS BEGIN /** Summary: > A new way of pivoting results of any length and width and also gives integer row and column totals. This is an inline function that takes a SQL Server result converted to a JSON document and transposes it, or pivots it. It returns the pivoted JSON Author: PhilFactor Date: 21/12/2017 Example: > SELECT * FROM OpenJson((SELECT dbo.TransposedJSONMatrixWithIntTotals(( SELECT * FROM (VALUES (1,2,3,4),(5,6,7,8),(9,10,11,12),(13,14,15,16) )OurMatrix([first],[second],[third],[fourth]) FOR JSON auto)))) WITH ( [row] varchar(10) '$.Col0', [First] int '$.Col1',[Second] int '$.Col2', [Third] int '$.Col3',[Fourth] int '$.Col4',[Sum] int '$.Col5' ) Returns: > A json file representing the transpose **/ DECLARE @TheMatrix TABLE ( RowNumber INT IDENTITY(1, 1) NOT NULL PRIMARY KEY, --the row number of the row TheColumn INT NULL, --null if the entry corresponds with the row object TheKey NVARCHAR(200) NOT NULL, --the KEY FOR the JSON opject TheValue NVARCHAR(MAX) NOT NULL --the value (json expression if an object) ); --firstly we unwrap the first level to give us the row number --along with each row object INSERT INTO @thematrix(TheKey, TheValue) SELECT -- [KEY], Value FROM OpenJson(@json) WHERE type = 5; DECLARE @TheNormalisedVersionOfTheMatrix TABLE (--each row represents a cell colOrder INT IDENTITY NOT null,--we need to know this to get the order right Rownumber INT, --the row number the column is associated with in the matrix RowKey VARCHAR(100), --the key field for the row ColKey VARCHAR(100), --the key for the column TheValue VARCHAR(MAX), --the value in the cell valuetype INT ); INSERT INTO @TheNormalisedVersionOfTheMatrix(RowNumber, RowKey, ColKey, TheValue, ValueType) SELECT TheColumns.RowNumber, TheColumns.TheKey, acolumn.[Key], acolumn.Value, acolumn.Type FROM @TheMatrix AS TheColumns CROSS APPLY OpenJson(TheColumns.TheValue) AS acolumn --unwrap each column WHERE acolumn.Type <> 5; DECLARE @Rowcount INT --find out the number of rows inserted = (SELECT Max([@TheNormalisedVersionOfTheMatrix].Rownumber) FROM @TheNormalisedVersionOfTheMatrix); --insert an extra Row at the end to give a total (Sum of the values in each column) INSERT INTO @TheNormalisedVersionOfTheMatrix ( Rownumber, RowKey, ColKey, TheValue, valuetype) SELECT RowKey + 1, RowKey, 'Total', Sum(Convert(bigINT, TheValue)), 2 FROM @TheNormalisedVersionOfTheMatrix WHERE valuetype = 2 GROUP BY RowKey; --insert an extra column at the end of each row to give a total (Sum of the values per row) INSERT INTO @TheNormalisedVersionOfTheMatrix ( Rownumber, RowKey, ColKey, TheValue, valuetype) SELECT @Rowcount + 1, @Rowcount, ColKey, Sum(Convert(bigINT, TheValue)), 2 FROM @TheNormalisedVersionOfTheMatrix WHERE valuetype = 2 GROUP BY ColKey; /* now all we have to do is to assemble the JSON from the cells, but transposing rows and columns*/ RETURN -- '[' -- + Stuff --we will be concatenating a list of rows. (( SELECT Max(aLine.theline) FROM @TheNormalisedVersionOfTheMatrix AS EachRow CROSS APPLY ( SELECT -- ',{"Col0":"'+ EachRow.ColKey+'"'--this captures what was the column name + (SELECT ',"Col' + Convert(VARCHAR(8), Rownumber) + '":' --and then + CASE EachNewRowContents.valuetype -- ..we do all the rows WHEN 0 THEN 'NULL' WHEN 1 THEN '"'+ STRING_ESCAPE(TheValue, 'json') + '"' ELSE TheValue end FROM @TheNormalisedVersionOfTheMatrix AS EachNewRowContents WHERE EachNewRowContents.colkey = EachRow.ColKey ORDER BY colorder --we need to make the order explicit FOR XML PATH(''), TYPE -- we sew together then new rows ).value('.', 'varchar(max)') + '}' AS theline ) AS aLine GROUP BY EachRow.ColKey ORDER BY Min(EachRow.colOrder) FOR XML PATH(''), TYPE --and sew together the rows ).value('.', 'varchar(max)'), 1, 1, '') --we do this to knock off the initial comma + ']';-- the JSON array terminator END GO |
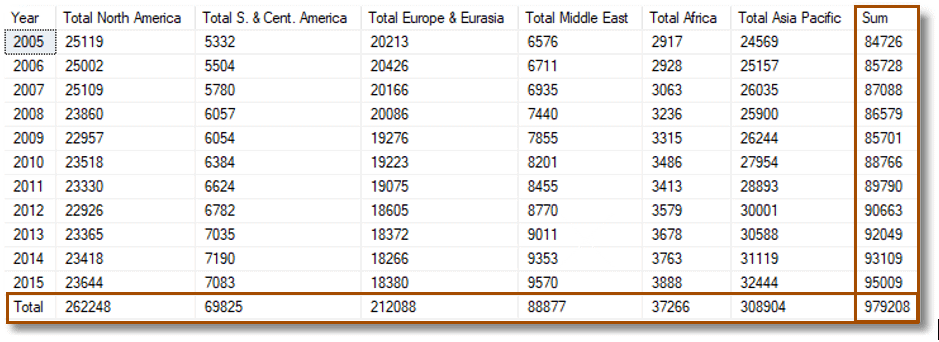
Here is the code that produced the Oil Consumption figures with the added sum column and total row .
|
1 2 3 4 5 6 7 8 9 10 11 12 13 14 15 16 17 18 19 20 21 22 23 24 25 26 |
SELECT * FROM OpenJson((SELECT dbo.TransposedJSONMatrixWithIntTotals(( SELECT * FROM (values --'Total North America' (25119,25002,25109,23860,22957,23518,23330,22926,23365,23418,23644), --'Total S. & Cent. America (5332,5504,5780,6057,6054,6384,6624,6782,7035,7190,7083), --'Total Europe & Eurasia' (20213,20426,20166,20086,19276,19223,19075,18605,18372,18266,18380), --'Total Middle East' (6576,6711,6935,7440,7855,8201,8455,8770,9011,9353,9570), --'Total Africa' (2917,2928,3063,3236,3315,3486,3413,3579,3678,3763,3888), --'Total Asia Pacific' (24569,25157,26035,25900,26244,27954,28893,30001,30588,31119,32444) )oilConsumption([2005],[2006],[2007],[2008],[2009],[2010],[2011],[2012],[2013],[2014],[2015]) FOR JSON auto)))) WITH ( [Year] VARCHAR(20) '$.Col0', [Total North America] bigint '$.Col1', [Total S. & Cent. America] bigint '$.Col2', [Total Europe & Eurasia] bigint '$.Col3', [Total Middle East] bigint '$.Col4', [Total Africa] bigint '$.Col5', [Total Asia Pacific] bigint '$.Col6', [Sum] bigint '$.Col7' ) |
We can see the aggregation column just by specifying Colx as the column in the JSON path where x is one more than the number of data columns. (We used Col0 in the JSON path for the rotated column headings). The Total row just appears!
The code for both functions can be downloaded from the link at the bottom of the page.
Conclusions
I couldn’t do any of this sort of trickery until the JSON support came into SQL Server 2016. I suspect that there is a way to use OpenXML to work the same magic, but I leave that for the keen reader, if any are still with me at this point. JSON is just so handy, and seems fast. It is a very relaxed way of getting data in and out of functions. It is also easy to debug. It was relatively easy to bring it to bear on a problem that has previously proved resistant to easy solution, the generic function to pivot data regardless of the number of rows and columns.
FAQs: An Easier Way of Pivoting Data in SQL Server
1. What is the difference between SQL Server PIVOT and this JSON matrix approach?
The SQL Server PIVOT operator requires you to specify the column values that will become column headers at query design time. This works well for fixed-column reports but fails for dynamic data where the number and names of columns are determined at runtime. The TransposedJSONMatrix function in this article uses SQL Server’s JSON support to rotate data dynamically – the function infers column names from the data itself, making it suitable for truly dynamic pivot scenarios.
2. Can I pivot data in SQL Server without knowing the column names?
Yes, using the JSON-based TransposedJSONMatrix function described in this article, or using dynamic SQL to build a PIVOT query at runtime. The JSON approach is cleaner than dynamic SQL for most cases because it doesn’t require string concatenation or EXEC calls. Requires SQL Server 2016 or later for JSON support. For earlier versions, dynamic SQL with sp_executesql is the standard approach.
3. How do I transpose rows to columns in SQL Server?
To transpose a query result (swap rows and columns), use the TransposedJSONMatrix function from this article, which handles the rotation generically. Alternatively, use the SQLCLR-based MATRIX.Transposing stored procedure covered in the companion Transposing Query Results article. Both approaches handle variable column counts. The built-in PIVOT operator requires fixed, known column names and does not transpose in the general sense.
4. Does this JSON pivot approach work for all SQL Server datatypes?
The TransposedJSONMatrix function works with any consistent datatype – meaning all values in the matrix should be of the same type. The article demonstrates integer, string, and other numeric datatypes. For matrices with mixed datatypes, you need to cast all values to a common type (typically NVARCHAR) before applying the function, with the understanding that the output will be a string matrix requiring further type conversion if needed downstream.
This document contains proprietary information and is protected by copyright law.
Copyright © 2026 Red Gate Software Limited. All rights reserved


Load comments