
In SQL Server Analysis Services (SSAS), you can add key performance indicators (KPIs) to your database cube in order to evaluate business performance, as reflected in the cube data. A KPI is associated with a measure group and is made up of a set of calculations. Typically, the calculations are a combination of calculated members and Multidimensional Expressions (MDX) statements.
A KPI consists of four main properties that are important to evaluating business performance:
- Value Expression. An MDX expression that returns the KPI’s actual value.
- Goal Expression. An MDX expression that returns the KPI’s target value.
- Status Expression. An MDX expression that returns the KPI’s state at a specific point in time.
- Trend Expression. An MDX expression that returns the KPI’s value over time.
In addition to these components, there are other properties that you can configure, but these four components make up the heart of your KPI.
As you work through the process of creating a KPI, you’ll get a better sense of what each of these properties means and how they relate to one another. In this article, I show you how to add a KPI to a cube in an Analysis Services 2008 database. The example I demonstrate is based on the solution from an earlier article I wrote, Five Basic Steps for Implementing an Analysis Services Database”. For that solution, I created the following database components:
- A data source that points to the AdventureWorksDW2008 database on a local instance of SQL Server 2008.
- A data source view that includes the tables shown in Figure 1.
- Database dimensions based on each dimension table in the data source view.
- A cube based on the database dimensions as well as on the two fact tables in the data source view.
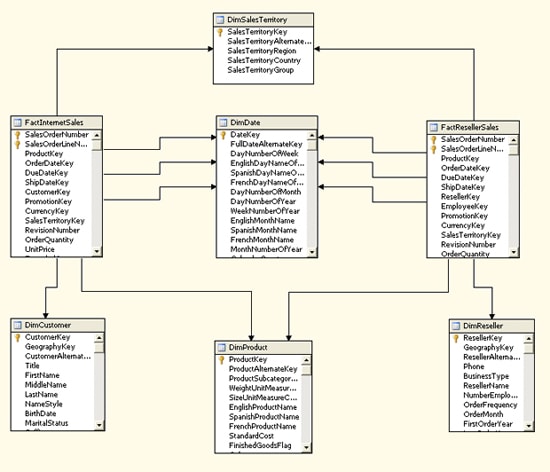
Figure 1: Default diagram from the Sales data source view
Be sure to refer to the article mentioned above for more details about the solution. In addition, if you don’t know how to implement a basic cube in Analysis Services, read that article first and refer to SQL Server Books Online for additional information. Once you know how to implement an Analysis Services database, you’re ready to add KPIs to your solution.
Creating a Calculated Member
When you create a KPI, you base one or more of your expressions on members in a measure group or dimension. However, in some cases, the existing members don’t support the type of KPI you want to create, at least not in their current form. If that’s the case, you can create a calculated member, which is similar to creating a computed column in a SQL Server database.
To create a calculated member, open your Analysis Services project in SQL Server Business Intelligence Development Studio (BIDS), and then open the cube in which you want to create your KPI. (For this article, I’m adding the KPI to the Sales cube.) In Cube Designer, click the Calculations tab, and then click the New Calculated Member button. A new calculation form opens in the right pane, as shown in Figure 2.
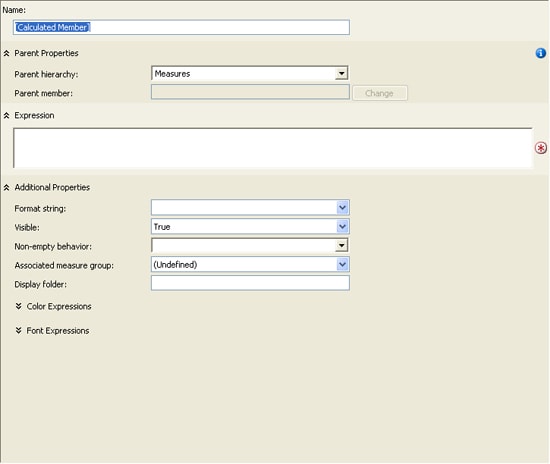
Figure 2: Form for a new calculated member
You should first name the calculated member by typing the name in the Name text box. For this example, I use the following name:
[Profit Margin]
Notice that I enclose the name in brackets. If your name includes a space, as mine does, you must use the brackets.
Next, you should verify the setting for the Parent hierarchy property. By default, the property is set to Measures. Because we’re creating a calculated measure, this is the hierarchy we want to use.
After you select the hierarchy, you must define an MDX expression that determines the value for your calculated measure. In this case, I want to create a measure that provides the profit margin for each sale. The following expression calculates the margin by dividing the net profit by the sales amount:
|
1 2 3 4 |
([Measures].[Sales Amount] - ([Measures].[Total Product Cost] + [Measures].[Tax Amt] + [Measures].[Freight])) / [Measures].[Sales Amount] |
Notice that I calculate the net profit by subtracting the total product cost, tax amount, and freight from the sales amount. (You might decide on a different formula for you net profit.) I then divide that total by the sales amount.
Note: When opening the Calculations tab, you probably noticed the list of measure groups and dimensions in the lower-left pane. You can drag a member from any of these hierarchies to your expression text box to add the fully qualified name of that member to the expression. Also note, the MDX expression shown above is a relatively simple one. You can, of course, create far more complex expressions. However, an in-depth discussion about MDX is beyond the scope of this article. For more information about MDX, see SQL Server Books Online.
After you create your expression for the calculated member, you can set additional properties. For this example, I set the Format string property to “Percent” and then select Fact Internet Sales in the Associated Measure Group property because I want to associate the calculated member with that measure group. Figure 3 shows what the form should look like after you’ve configured all the properties.
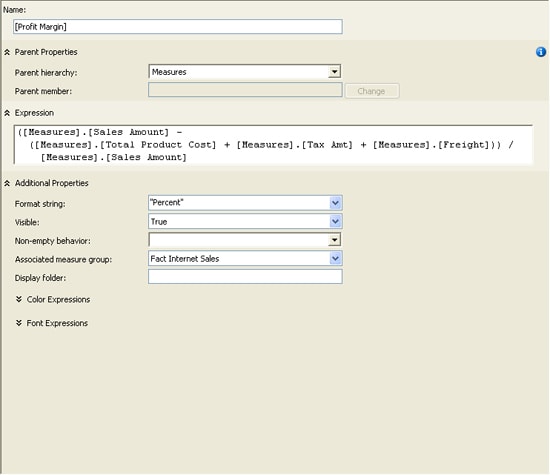
Figure 3: Creating the Profit Margin calculated member
That’s all there is to creating a calculated member. Be sure to save the project and then process the cube so the measure is available to your KPI. After you process your cube, you can verify that the measure has been successfully added by browsing the cube data and viewing the Profit Margin measure.
Creating a Key Performance Indicator
Now that your calculated measure is set up, you’re ready to create your KPI. In Cube Designer, click the KPIs tab, and then click the New KPI button. A new KPI form opens in the right pane, as shown in Figure 4.
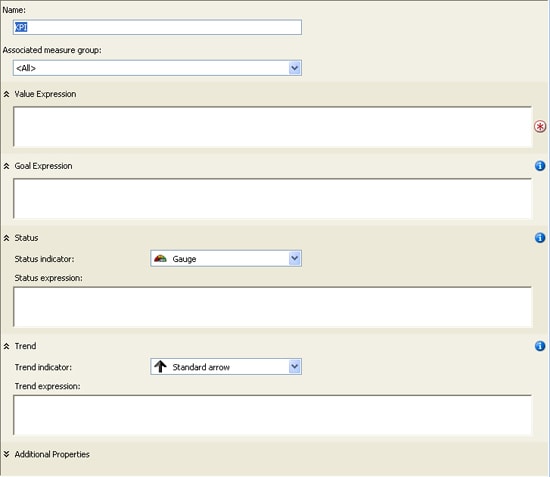
Figure 4: Form for a new key performance indicator (KPI)
To configure the KPI, first provide a name. (I use Gross Profit for our example KPI.) Then select a value for the Associated measure group property. (I use Fact Internet Sales.) You’re now ready to add the necessary expressions to your KPI.
Adding the Value Expression
Your value expression should reflect the basic measure by which your KPI is gauged. The value returned by the expression serves as the foundation for your KPI. It’s the only one of the four expressions that’s required. For our example KPI, I use the following expression:
|
1 |
[Measures].[Profit Margin] |
As you can see, I’m simply calling the Profit Margin calculated measure. Notice that, as you saw when creating your calculated member, I’m using the fully qualified member name. Also, as with the calculated member, you can drag the name from the hierarchies listed in the lower-left pane to the expression text box.
Adding the Goal Expression
As the name suggestions, the goal expression indicates what your organization is trying to achieve. For example, your profit margin might currently be at 25%, but your goal might be to reach 30%. And you can also set your goal to match more specific criteria. For instance, in the example KPI, I set the goal to vary depending on the specific sales territory group, as shown in the follow MDX expression:
|
1 2 3 4 5 6 7 8 9 10 11 12 |
Case When [Territory].[Sales Territory Group] Is [Territory].[Sales Territory Group].[Europe] Then .34 When [Territory].[Sales Territory Group] Is [Territory].[Sales Territory Group].[North America] Then .36 When [Territory].[Sales Territory Group] Is [Territory].[Sales Territory Group].[Pacific] Then .32 Else .30 End |
Notice that I use a Case statement to define my criteria. The Case statement includes three When expressions, one for each territory group. Each When expression identifies the member on which to base the expression and the member value, following the Is keyword. This is followed by a Then expression which defines what action to take. For example, the first When expression states that if the sales territory group is Europe, then the profit margin goal is 34%. However, the goal for the North American group is 36%, and the goal for the Pacific group is 32%. The Else clause then specifies that all other groups have a 30% goal.
Adding the Status Expression
Your status expression determines the current status of the KPI by comparing the goal expression to the value expression. For example, if your KPI value returns a 20% profit margin, but your goal is 30%, the status will indicate that you are below your goal. However, to arrive at the status, your status expression must return a value in the range of -1 to +1, where -1 indicates bad performance and +1 indicates good performance. For our example KPI, I use the following MDX expression to determine the status of performance:
|
1 2 3 4 5 6 7 8 9 |
Case When KpiValue("Gross Profit") / KpiGoal("Gross Profit") > .90 Then 1 When KpiValue("Gross Profit") / KpiGoal("Gross Profit") <= .90 And KpiValue("Gross Profit") / KpiGoal("Gross Profit") > .80 Then 0 Else -1 End |
Once again, I create a Case statement. In the first When expression, I divide the KPI value by the KPI goal and compare it to .90. If the value is greater than 90% of the goal, I assign the status value a +1. However, in the second When expression, I specify that if the KPI value is less than or equal to 90% and is greater than 80%, the status should be 0. Otherwise, the KPI status should be -1.
Notice that I use the KpiValue function to retrieve the KPI’s value and I use the KpiGoal function to retrieve the KPI’s goal. These functions make it easy to retrieve the value and goal within your MDX expressions.
One other thing I want to point out is the status indicator. For this example, I use the traffic light. That means, when the status value is 1, the traffic light will be green. If the status value is 0, the light will be yellow. Otherwise, the light will be red. For example, if my KPI goal is 30% and my value is 20%, the traffic light will be red. That’s because a 20% profit margin represents only about 67% my goal, which would evaluate to a -1 in the status expression. However, a value of 25% would evaluate to about 83%, which would mean a yellow light, and a value of 28% would evaluate to about 93%, which would result in a green light.
After you add the status expression and set up the status indicator, your KPI form should look similar to the one shown in Figure 5. (You have to scroll down to see the trend expression, which we’ll work on next.)
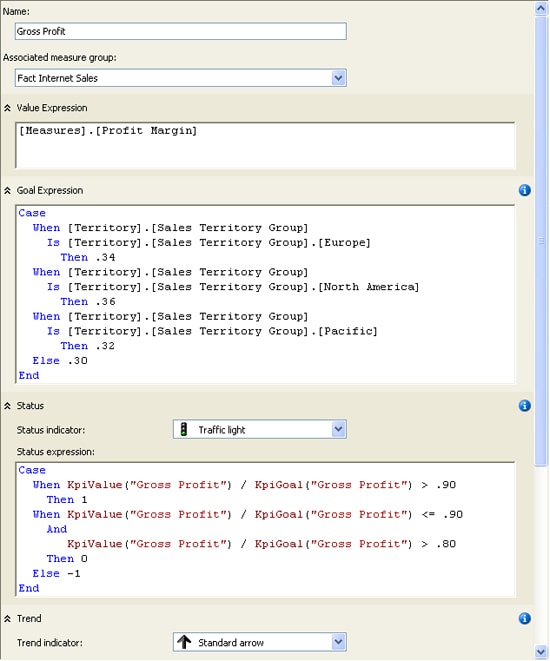
Figure 5: Creating the Gross Profit KPI
Adding the Trend Expression
The trend expression lets you compare how your KPI is performing over time. Although the status value can tell you how well you’re achieving you goal at a fixed point in time, it doesn’t tell you how those achievements compare to another point in time. For example, your organization might have reached 92% of its goal this year, but reached 95% the year before. Although the performance looks good when just viewing this year’s total, that performance measure doesn’t reveal that this is actually a downward trend. And this is what the trend expression allows you to find out.
For the Gross Profit example KPI, I use a trend expression that compares this year’s totals to the previous year, as shown in the following Case statement:
|
1 2 3 4 5 6 7 8 9 10 11 12 13 14 |
Case When IsEmpty(ParallelPeriod([Order Date].[Calendar Year].[Calendar Year], 1, [Order Date].[Calendar Year])) Then 0 When [Measures].[Profit Margin] > (ParallelPeriod([Order Date].[Calendar Year].[Calendar Year], 1, [Order Date].[Calendar Year]), [Measures].[Profit Margin]) Then 1 When [Measures].[Profit Margin] = (ParallelPeriod([Order Date].[Calendar Year].[Calendar Year], 1, [Order Date].[Calendar Year]), [Measures].[Profit Margin]) Then 0 Else -1 End |
Notice that the first When expression includes the IsEmpty function and the ParallelPeriod function. The IsEmpty returns a value of true if the evaluated expression an empty cell value. Otherwise the function returns false. I use this function in the first When expression to determine whether the year preceding the current one exists in the cube data. If not, then the trend expression returns a 0, which indicates a neutral trend. (A trend expression, like the status expression, should return a value from -1 to +1.)
The ParallelPeriod function returns a member value from a previous period that’s in the same relative position as the current member. Because I specify Calendar Year, the previous member will also be based on Calendar Year. The function includes three arguments. The first argument returns the level of the hierarchy that you want to target. In this case, it’s the Calendar Year level of the Calendar Year hierarchy, which is part of the Order Date hierarchy. The second argument, 1, indicates the number of units that you want to go back. Because Calendar Year is the current position, the function will go back one year. The final argument specifies that I am basing the calculation on Calendar year. As a result, the first When expression in the Case statement above will determine if the previous calendar year exists, and if it doesn’t the trend will be set to 0.
The second When expression determines whether the profit margin for the current year is greater than the profit margin for the previous year. Notice that the third argument in the ParallelPeriod function now specifies Profit Margin, rather than Calendar Year. If the profit margin is greater in the current year, the trend value is set to +1. However, the third When expression determines whether the profit margin for the current year equals that of the previous year. If so, the trend value is set to 0. Otherwise the trend value is set to -1.
Notice also that you can set the trend indicator. You have three different types of arrows from which to choose. Or you can pick the smiley face!
Completing the Key Performance Indicator
A KPI supports properties in addition to the ones I’ve described so far. Although configuring those properties are beyond the scope of the article, you should have some idea how they work. If you click the Additional Properties down arrow at the bottom of the KPI form, you can view and configure the following properties:
- Display folder. The folder in which the KPI can be found when browsing the cube.
- Parent KPI.> A KPI that acts as the parent of the current KPI so the parent KPI can use the value of the child KPI.
- Current time member. An MDX expression that returns a member that identifies the KPI’s temporal context.
- Weight. An MDX expression that assigns a weight to a child KPI to indicate its relative importance in the parent KPI.
- Description. A description of the KPI.
After you’ve completed your KPI, you can then view its results, based on the current values in the cube data. To view the KPI, click the Browser View button on the KPIs tab. The browser view includes two panes. The top pane lets you define filters that determine what data the KPI uses, and the bottom pane displays the KPI. By default (before any filters are defined), the KPI calculates the KPI value for the entire data set. However, you can create filters that let you define the data for which you want to run the KPI.
For example, Figure 6 shows the filter I created for the Gross Profit KPI. I first selected Pacific as the sales territory group, and then selected 2004 as the calendar year. As you can see in the figure, the KPI value is 29.72%. Because the goal for the Pacific group is only 32%, the Pacific group reached nearly 93% of its goal for 2004, which means the status indicator is green. However, notice that the trend points downward. That’s because they Pacific group did better in 2003 (30.58%).
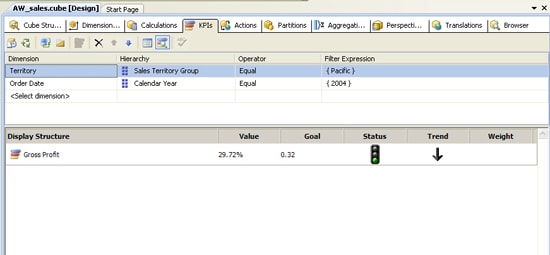
Figure 6: Browsing the Gross Profit KPI
As this example demonstrates, a KPI can be an effective way to get a quick read on your organization’s performance. Of course, how the KPI is displayed and what sort of status indicators you use will depend on the implementation of the client applications. But Analysis Services provides the features you need to make the KPI data easily available to your cube. And once you have an understanding of the basic components that make up a KPI, you can start implementing KPIs that support the various business needs of your organization.
This document contains proprietary information and is protected by copyright law.
Copyright © 2026 Red Gate Software Limited. All rights reserved


Load comments