
The series so far:
- Storage 101: Welcome to the Wonderful World of Storage
- Storage 101: The Language of Storage
- Storage 101: Understanding the Hard-Disk Drive
- Storage 101: Understanding the NAND Flash Solid State Drive
- Storage 101: Data Center Storage Configurations
- Storage 101: Modern Storage Technologies
- Storage 101: Convergence and Composability
- Storage 101: Cloud Storage
- Storage 101: Data Security and Privacy
- Storage 101: The Future of Storage
- Storage 101: Monitoring storage metrics
- Storage 101: RAID
High-performing applications such as advanced analytics or relational database systems require fast and reliable storage to accommodate their data needs. IT teams must ensure that the storage systems supporting the applications can maintain the required performance and availability thresholds to meet these demands. For this, engineers must continuously monitor their storage systems to identify issues before they become serious problems.
Monitoring offers an effective strategy for getting at an issue’s root cause as soon as it surfaces, providing both real-time and historical insights into storage activity. Engineers can use this information to identify potential problem areas and misallocated resources as well as proactively tune storage to deliver better performance.
IT teams often use tools such as ManageEngine OpManager to monitor their storage systems. DBA teams may also monitor storage with tools like Redgate’s SQL Monitor. Not only do these products enable IT to track performance statistics such as latency and throughput, but they also offer more advanced features for managing storage infrastructure. For example, OpManager provides extensive built-in reporting capabilities, including storage growth trend graphs, and SQL Monitor can correlate utilization spikes to SQL Server queries and waits.
Despite these features, engineers must still be able to get at the basic storage metrics to understand how their systems are performing. Without this information, most other features provide little value. Metrics are at the heart of what makes storage monitoring work and what it takes to provide storage systems that deliver optimal performance.
Tracking Storage Metrics
When monitoring storage systems, engineers should track a variety of metrics to ensure the systems continue to meet application requirements. Three of the most important and commonly cited metrics are latency, I/O operations per second (IOPS), and throughput. In addition to these three, queue length and I/O splitting can also provide valuable insights into storage performance.
In this article, I discuss all five of these metrics and demonstrate them in action. Despite my focus on these five, they’re not the only important metrics to monitor. For example, engineers should also track storage capacity, device cache usage, controller operations, and storage networks. Even seemingly unrelated components can be a factor, such as low CPU utilization, which can indicate that the processor is waiting on storage to complete requests from the application.
For this article, I’ve limited my discussion to latency, IOPS, throughput, queue length, and I/O splitting just to maintain a reasonable scope. To demonstrate these metrics, I used Microsoft’s new Performance Monitor, which is part of Windows Admin Center version 1910. Although the tool is still in preview, I thought it would be a fun change from the old Performance Monitor, which has been around for over 25 years. You can find information about the new Performance Monitor and where to download it in the blog post Introducing the new Performance Monitor for Windows.
To show these metrics in action, I used the following T-SQL script to run a limited test load against a local instance of SQL Server:
|
1 2 3 4 5 6 7 8 9 10 11 12 13 14 15 |
DROP TABLE IF EXISTS Orders; GO CREATE TABLE Orders( ItemID int IDENTITY PRIMARY KEY, ItemName nvarchar(50) NOT NULL, ItemDescription nvarchar(250) NOT NULL, Quantity int NOT NULL, Price decimal(18, 2) NOT NULL); GO INSERT INTO Orders (ItemName, ItemDescription, Quantity, Price) VALUES('short product name', 'longer more detailed product information', 10, 100.00); GO 20000 SELECT ItemID, ItemDescription, Quantity, Price FROM Orders; |
The script creates a simple table, inserts the same data 20,000 times, and then retrieves the data from the table. I used the GO operator to run the INSERT statement repeatedly.
I realize that there are more elegant ways to generate a load, but I wanted to keep things simple in order to focus on the metrics themselves. Besides, I ran the tests on my laptop’s local solid-state drive (SSD), which connects via a Serial AT Attachment (SATA) interface. This is hardly a production-like simulation. Even so, the examples should give you a sense of what to look for in terms of performance metrics. This also makes it easy for you to try them out on your own system, assuming you have SQL Server installed. Even if you don’t, you can still test these metrics to see what you get.
Monitoring Latency
Latency refers to how long it takes for an application’s I/O requests to be completed. It is the time between when the application issues a request and when it receives a response. The lower the response time, the better.
Several factors can impact latency. For example, if a storage device cannot meet workload demands, I/O requests can start piling up in the queue and slowing down response times. Latency can also be affected by storage capacities, storage protocols, network bottlenecks, device types, number of concurrent operations, and workload types. For instance, a hard-disk drive (HDD) can handle sequential reads more efficiently than random reads because there is less platter and head movement, resulting in lower latency.
The size of the I/O request can also affect latency, with larger sizes tending toward higher latency. Performance Monitor provides several counters for finding the average I/O size if you’re not sure what it is:
- Avg. Disk Bytes/Read: Average I/O size for read operations.
- Avg. Disk Bytes/Write: Average I/O size for write operations.
- Avg. Disk Bytes/Transfer: Average I/O size for read and write operations.
After I enabled these counters on my system, I ran the example T-SQL script. Performance Monitor reported an average I/O size of around 4 KB, which is very low. As a result, I/O size is not likely to contribute to latency for this workload when running on my system.
Applications such as database systems are particularly sensitive to latency issues, which is why latency can be such an important metric to measure. Performance Monitor provides several counters for measuring latency:
- Avg. Disk sec/Read: Average number of seconds to read data from the disk.
- Avg. Disk sec/Write: Average number of seconds to write data to the disk.
- Avg. Disk sec/Transfer: Average number of seconds to read and write data on the disk.
After I added the counters to Performance Monitor, I ran each statement in my T-SQL script. Figure 1 shows the average latency during those operations, taken at one-second intervals. Nearly all the activity is from the INSERT statement, with latency peaking at about 0.011 seconds, or 11 milliseconds (ms).
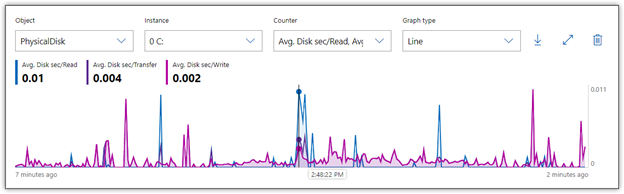
Figure 1. Monitoring latency on a local storage disk
In the figure, the horizontal axis is placed on one of the highest read times, so the statistics near the top left corner of the graph reflect that specific moment. For both read and write operations, a single I/O request never exceeded 11 ms, and most were much lower, averaging closer to 2 or 3 ms. In addition, there was also no indication of gradually increasing latency, which can sometimes occur when storage can’t keep up with the workload.
Of course, I ran this test against a consumer-grade SSD running a simple operation. A real-world enterprise environment will likely show much different results. According to most recommendations, if the average latency consistently exceeds 25 ms, you’ve got a performance problem. I would argue that if you’re running a high-end all-flash array and your latency regularly exceeds 1 ms, you might still have a latency problem.
Monitoring IOPS
Vendors routinely cite a drive’s IOPS as one of its main selling points, and certainly, much attention is given to how IOPS compare from one drive to the next. But a drive seldom comes close to delivering what’s listed in the original specifications. In addition, IOPS should always be considered in relation to other factors, particularly latency and I/O size, as well as drive type (SSD vs. HDD) and workload type (read vs. write, random vs. sequential).
Measuring IOPS will give you the rate of I/O operations per second that the storage system is currently delivering, but IOPS alone does not tell the entire story. For example, a disk might be able to deliver faster IOPS, but the size of the I/O requests coming from an application might be small, reducing the overall throughput. Or a storage drive might be able to deliver outstanding IOPS, but the latency might also be exceptionally high, resulting in poorer performance.
Characteristics specific to a drive type can also play a role. For instance, HDDs with faster rotational speeds can usually deliver more IOPS and lower latency. In addition, factors such as RAID configurations or number of disks in an array can also impact IOPS.
Performance Monitor provides several counters for measuring IOPS:
- Disk Reads/sec: Number of read IOPS.
- Disk Writes/sec: Number of write IOPS.
- Disk Transfers/sec: Number of read and write IOPS.
After I enabled these counters on my system, I reran the T-SQL statements. Figure 2 shows the results in Performance Monitor, which indicate that write operations barely reached 360 IOPS and were generally much lower.
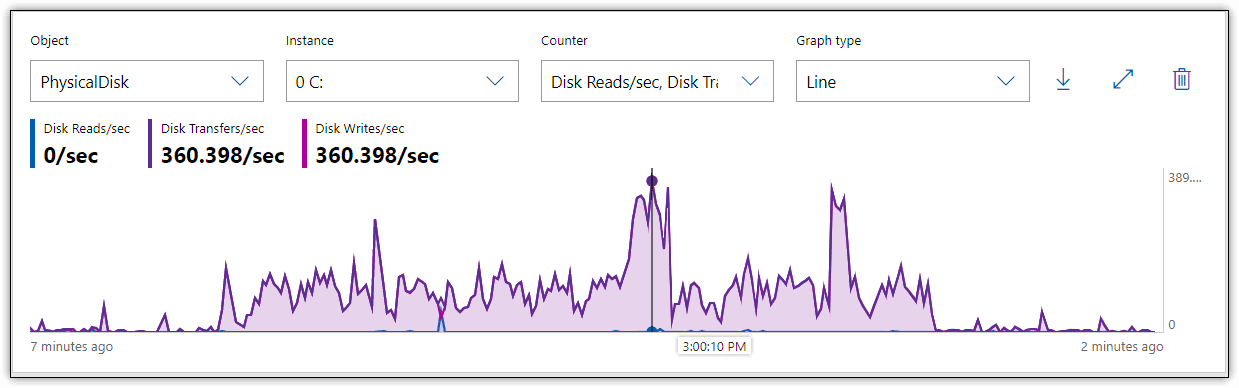
Figure 2. Monitoring IOPS on a local storage disk
For an SSD, even of the consumer variety, these are fairly low IOPS. Although the decent latency helps improve the performance picture, it doesn’t explain the lower number of operations, which can be the result of several factors. For example, the SSD is at near capacity, which can impact write performance. In addition, outside circumstances might contribute to lower IOPS, such as operating system background tasks. All of these possibilities point to the challenge of relying on IOPS alone to uncover potential performance issues, which is why this metric should be viewed as only one piece in a much larger puzzle.
Monitoring Throughput
Throughput refers to the amount of data that can be written to or read from a storage drive within a given time interval. Also referred to as transfer rate, throughput measures how much data is being transmitted during read and write operations. Throughput can be impacted by such factors as network speeds, interfaces, storage protocols, drive capacities, and workload types. Throughput is generally more relevant to sequential workloads than random.
The terms throughput and bandwidth are sometimes used interchangeably, but they mean two different things. Bandwidth refers to the theoretical maximum transfer rate that a storage system can support, and bandwidth refers to the actual amount of data that is being transferred to and from the storage device. When monitoring performance, actual amounts are always the top concern.
Performance Monitor provides several counters for measuring throughput:
- Disk Read Bytes/sec: Number of bytes transferred per second during read operations.
- Disk Write Bytes/sec: Number of bytes transferred per second during write operations.
- Disk Bytes/sec: Number of bytes transferred per second during read or write operations.
Figure 3 shows the results I received in Performance Monitor when I reran the T-SQL statements, with these three metrics enabled.
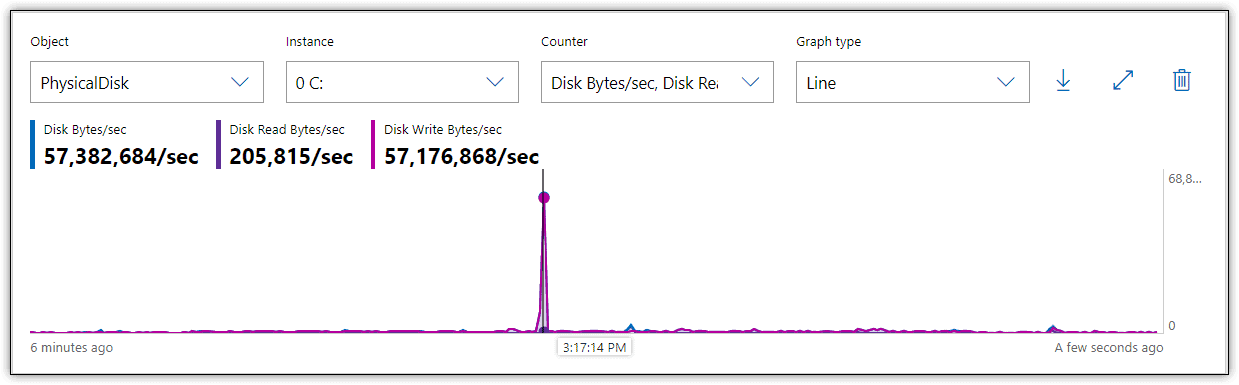
Figure 3. Monitoring throughput on a local storage disk
During the insert operation, there was a spike in write throughput to about 57 MB/sec, but most of the time throughput hovered around 2 MB/sec, far below what a SATA flash drive should be able to achieve. However, throughput is directly related to IOPS and I/O request size. In fact, it’s often calculated as IOPS multiplied by I/O size. Given that both my IOPS and I/O size are low, it’s no surprise that throughput is also low.
Monitoring Queue Length
The queue length indicates the average number of I/O requests that are waiting to be read from or written to disk during the sampled interval. Although some queuing is expected, too many waiting requests can lead to higher latency, which can steadily increase with the number of queued requests. That said, if the numbers seem high, but latency remains low, the storage system might be efficient at emptying the queue quickly, in which case, the queue length is probably not an issue.
Performance Monitor includes several counters specific to the queue length:
- Avg. Disk Read Queue Length: Average number of read I/O requests in the queue.
- Avg. Disk Write Queue Length: Average number of write I/O requests in the queue.
- Avg. Disk Queue Length: Average number of read and write I/O requests in the queue.
Figure 4 shows the results I received in Performance Monitor when I reran the T-SQL statements and monitored for queuing activity. As with the other examples, the primary activity is in writing the data.
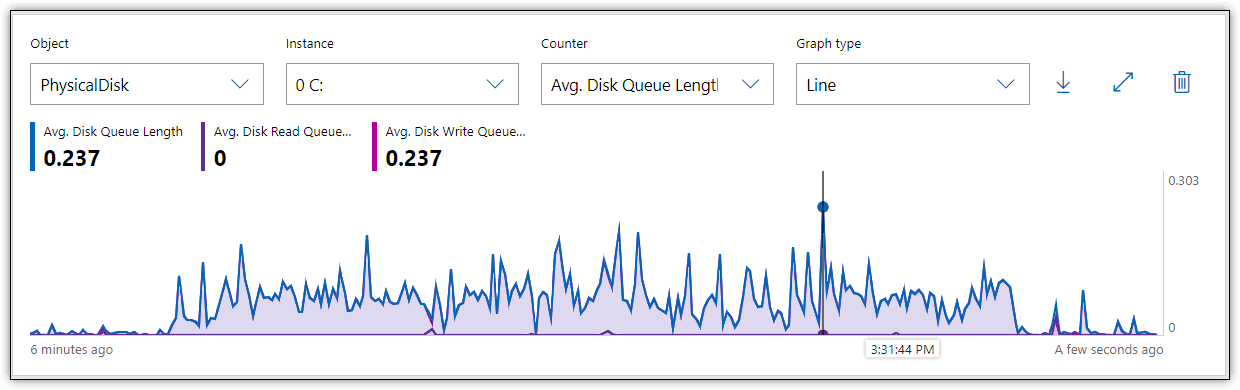
Figure 4. Monitoring queue length on a local storage disk
In this case, the queue length average remained well below 1 throughout the entire process. The general recommendation is that the average queue length should remain below 2 or 3 per disk. For example, a five-disk array should theoretically not exceed 10 queued requests on average. However, this might not be a realistic limit with SSDs, which are noted for their ability to handle I/O requests in parallel, making a higher queue rate more acceptable. As with most metrics, queue length should be considered only in relation to other variables.
Monitoring I/O Splitting
In some cases, I/O requests must be split into multiple requests in order to write the data to disk. This can occur because the disk is too fragmented to store the data contiguously or because the application is issuing I/O requests that are too large to process as single requests. In either case, performance can suffer.
Performance Monitor includes one counter for measuring I/O splitting, Split IO/Sec, which provides the number of I/O requests per second that were split into multiple requests. When I ran the T-SQL statement with this counter enabled, Performance Monitor showed that I had a couple of spikes in the numbers, but for the most part, they remained relatively low, as shown in Figure 5.
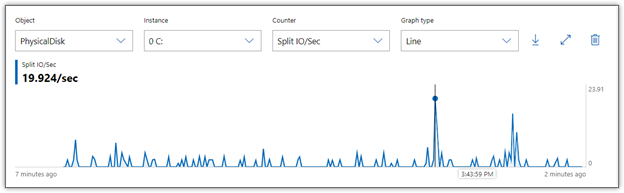
Figure 5. Monitoring I/O splitting on a local storage disk
The I/O splitting peaked out at about 20 in a couple places, but generally hovered between 0 and 5. However, any splitting can impact performance, and the closer you come to no splitting, the better. If splitting grows too out-of-control, latency will start to climb. Worse still, systems might freeze up or data might become corrupted.
Monitoring for the Bigger Picture
Storage metrics are connected to each other and should never be viewed in isolation. You must look at them as a whole to get the complete picture. IT teams that take steps to address one metric, without considering others, can make performance worse. For example, developers might update an application to increase I/O sizes for better throughput, but that could also result in higher latency and I/O splitting.
The new Performance Monitor makes it possible to get a snapshot of all your metrics in a readable format that you can export to a CSV file or copy and paste into an application such as Microsoft Excel. Figure 6 shows the information that Performance Monitor displayed on my system when I reran the T-SQL statements. This comes from about midway through the write operations.
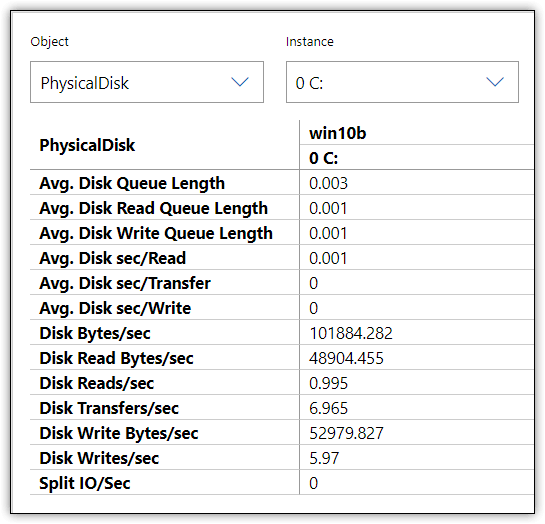
Figure 6. Storage metrics in Performance Monitor Report view
Capturing metrics at a specific point of time can be helpful, but it represents only one second from the entire operation. You should evaluate the metrics over a reasonable time span, looking for patterns and troubling behavior. For example, the figure shows the write latency at 0, which would be very suspect if you assumed that this one snapshot represented the entire operation.
You should also consider using other counters to uncover potential performance issues, such as those that monitor compute or network resources. In addition, if you’re monitoring SQL Server performance, you can use the counters built into Performance Monitor specific to that platform. Microsoft also provides other tools for monitoring SQL Server performance, such as the SQLIOSim utility, which is included with the SQL Server installation. Plus, Microsoft offers the DiskSpd utility, a free tool for generating a load on a storage system and measuring its performance. A tool like Redgate SQL Monitor will correlate disk monitoring with other metrics important to SQL Server workloads.
Of course, not all workloads are related to SQL Server, nor are all IT engineers using Windows to manage storage. Fortunately, there are plenty of third-party tools available for monitoring storage, and many storage vendors offer their own monitoring and management solutions. In fact, there are a wide range of options for tracking storage, as well as proactively diagnosing and resolving storage-related issues.
Storage monitoring is an ongoing process that must take into account the entire storage ecosystem—the storage systems themselves, the hardware and network components that support those systems, and the applications and users accessing them. The metrics I discussed here are merely a starting point for understanding the types of factors to take into account when evaluating storage performance. The topic of storage monitoring could easily take up an entire volume. What I covered in this article is just the beginning.
This document contains proprietary information and is protected by copyright law.
Copyright © 2026 Red Gate Software Limited. All rights reserved


Load comments