
As a developer, you get to write your application in a little sandbox that’s isolated from the real world. You’ve configured your machine the way you like it, you’ve installed all manner of add-ins into Visual Studio, you’ve added a number of seemingly random assemblies to your global assembly cache. Then, you’re totally disappointed when you copy the executable to another machine and it crashes.
Of course, it’s not really quite like that. Build systems try to ensure that the hidden dependencies are brought to the surface, and large collections of untainted virtual machines allow you to quickly test an application in a clean room environment. Still, it’s impossible to test all possible configurations, and so all too often bugs turn up. In those scenarios, it would be nice get access to the customer’s machine. Using some of the modern support technologies such as NTRsupport, this is fairly easy to do, and by using WinDbg and the SOS Debugging Extension it is possible to install very little on the target machine while still being able to get enough data to diagnose the problem.
Recently, someone pointed out to me that Visual Studio has an alternative for debugging remote applications, which ought to make it a lot easier to debug problems in .NET applications. It would be nice if all that was necessary was to select Debug, Attach to Process in Visual Studio on the host machine, and then enter the name of the target machine.
Of course, it isn’t really quite that easy…
Making the target machine available for remote debugging
Before you can get started, the target machine has to make itself available for remote debugging.
The host machine talks to the target machine via DCOM in order to get the data it needs for debugging the application. The way to set this up is to run the appropriate version of msvsmon.exe, which you can find in the architecture-specific subdirectory:
\program files\microsoft Visual Studio 10.0\Common7\IDE\Remote Debugger
This executable is a DCOM server that handles the requests from remote clients, attaching to the relevant processes and getting data from them.
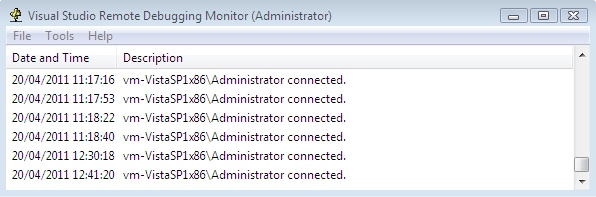
When the Debugging Monitor is running, it displays a view of the connections as they come in, as shown below. This is useful for debugging connection failures.
Search location for pdb files and sources
So the target machine is now available for remote debugging, but we’re still not ready yet.
With .NET applications, even though the debugger is running on the host machine, it will look for pdb files on the target machine. Most importantly, if the symbol path is set on the host machine, it will still look for files on the symbol path, BUT they will be searched for in those locations on the target machine.
When I was experimenting with this, I wanted to use Reflector VSPro to step into the .NET framework on the target machine. Reflector VSPro stores the generated pdb files in numbered subdirectories under the user’s AppData/Local/Red Gate/.Net Reflector 7/Cache directory. To get remote debugging to work, I had to copy mscorlib.pdb and the pdbs for my test application into the same path on the target machine (or rather, I needed to put the mscorlib.pdb in the same place; the two pdbs for the other parts of the application also worked if they were in the same folder as the application I was running). Note that I didn’t need to copy the sources, which are looked up on the host machine. Of course, using an identical path can be tricky if you want to run as different usernames on the two machines, but one could imagine ways to make the copying easier such as batch files or tricks with the file system.
So, using the Visual Studio Debugger makes this all a lot harder than the ideal case where you could simply have all of your VMs running the remote debugger service and then seamlessly connect to debug them.
Debugging
When you’ve set all this up, you are finally ready to open Debug, Attach to Process in Visual Studio, as shown below. In the screenshots in this article, I am running two instances of a virtual machine running Windows Vista, and I’m logged in as administrator on both machines. I used virtual machines so that I could configure their firewalls, something that I don’t have permission to do on my usual work machine.
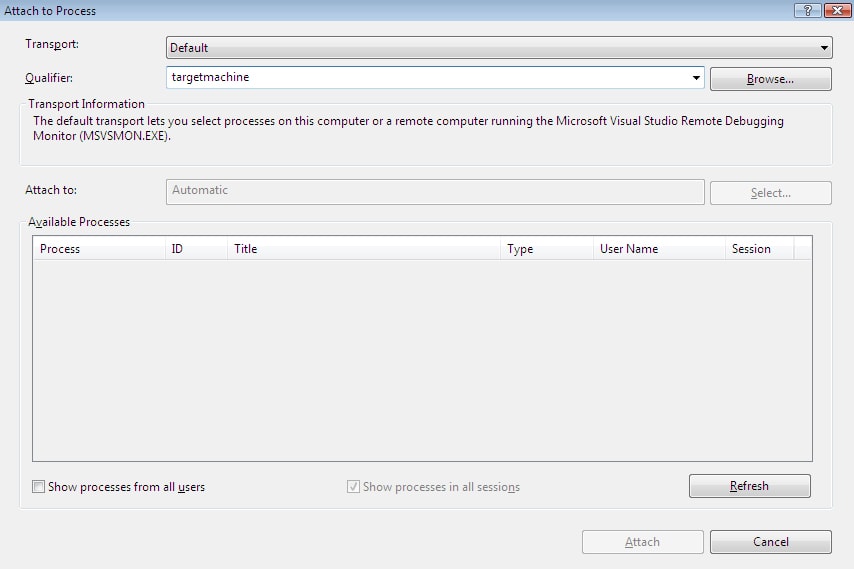
Enter the target machine name, and the available processes are listed. Notice that Visual Studio has substituted the entered name of the target machine (targetmachine) with the UPN (Administrator@VM-VISTASP1X36).
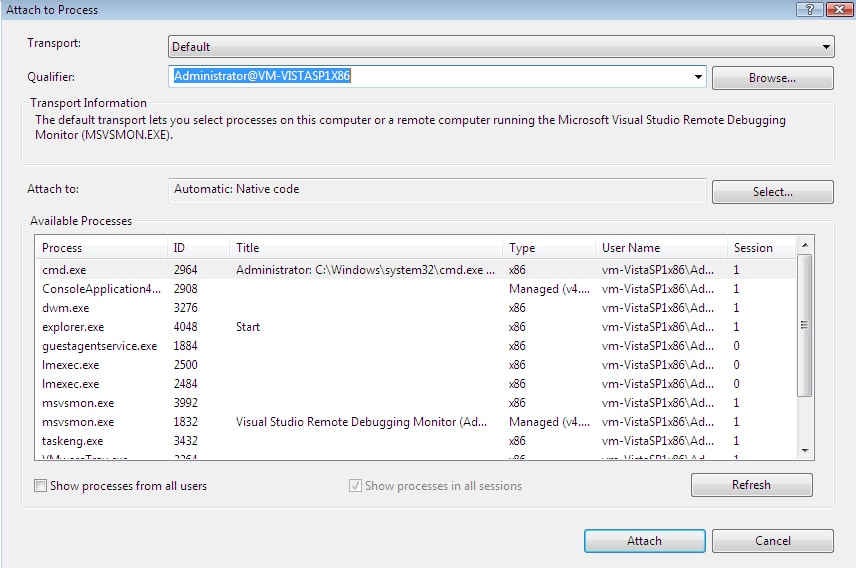
Once you have selected one of the available processes, you will be debugging the application that is running on the target machine. So, with the application running on the target machine:
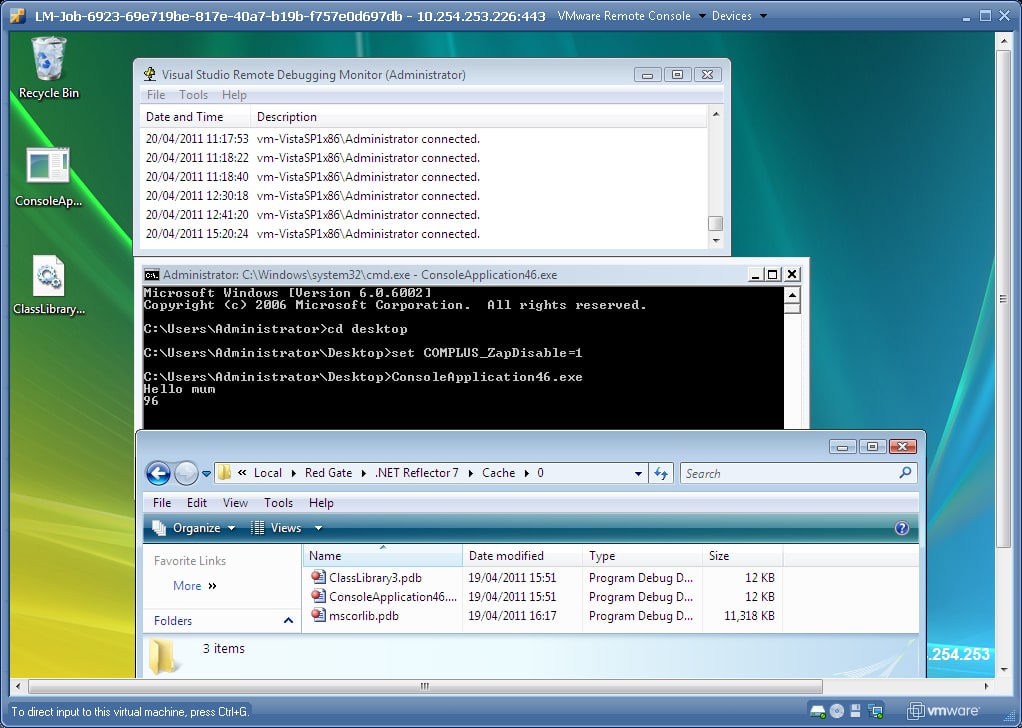
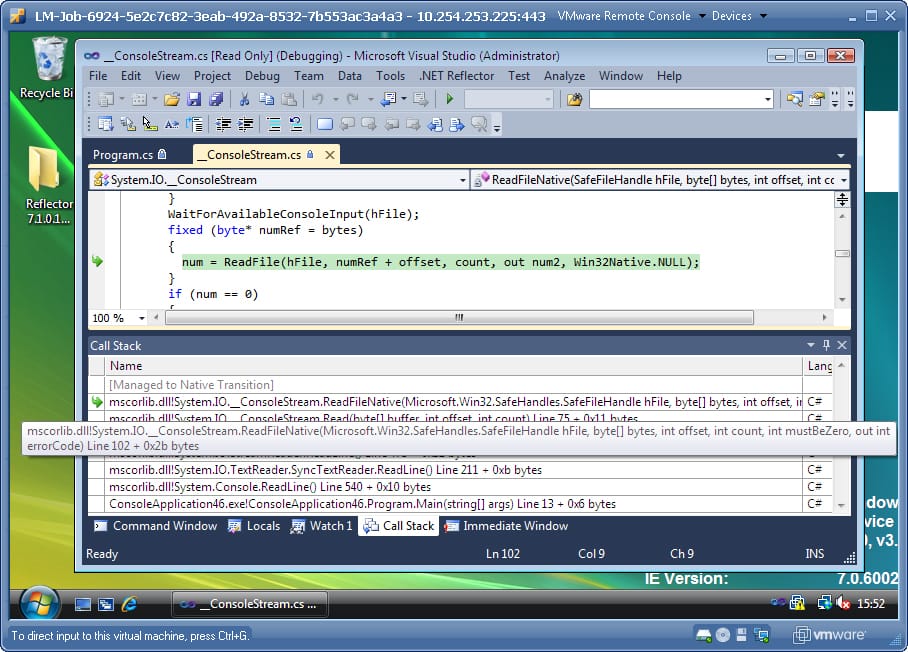
We can step and debug as normal, though things are a little slower.
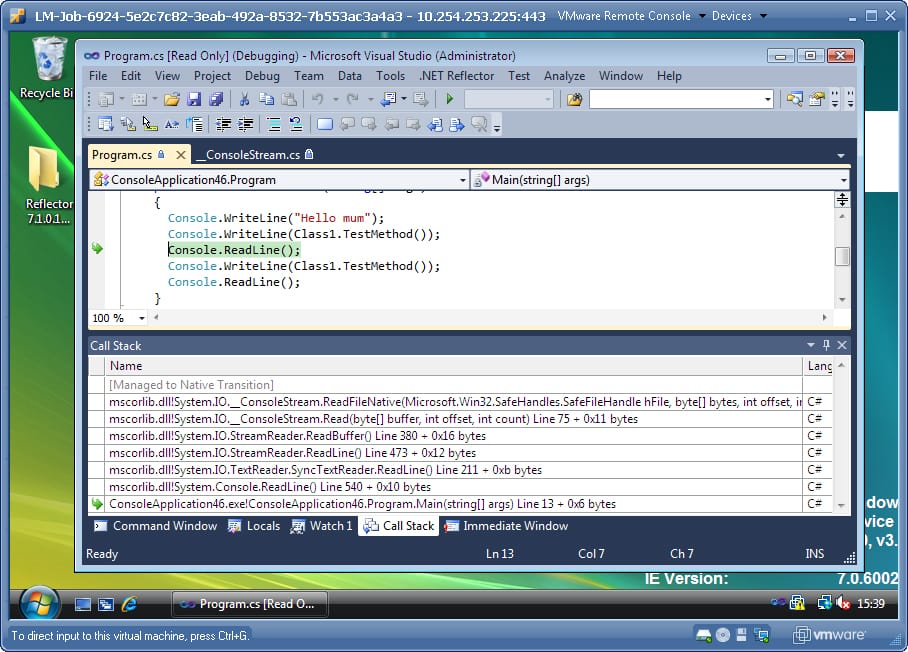
And, because we have set up the search location for pdbs and sources, we can look deeper into the Microsoft library (mscorlib.pdb):
Authentication of the Connection
We have seen that if you’re on a Windows domain and want to run as the same identity on both the host and the target, then everything works really smoothly.
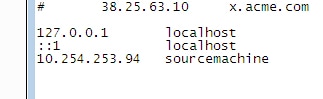
However, when I was experimenting with this, I was running as the administrator on two virtual machines that weren’t connected to the same domain. This made things complicated because the two machines had the same name (they were clones of the same initial virtual machine), and this caused the DCOM reverse connection to fail. I had to rename the two machines, sourcemachine and targetmachine respectively, and for each, add the IP of the other machine to the hosts file in c:\windows\system32\drivers\etc\hosts:
Windows Firewall
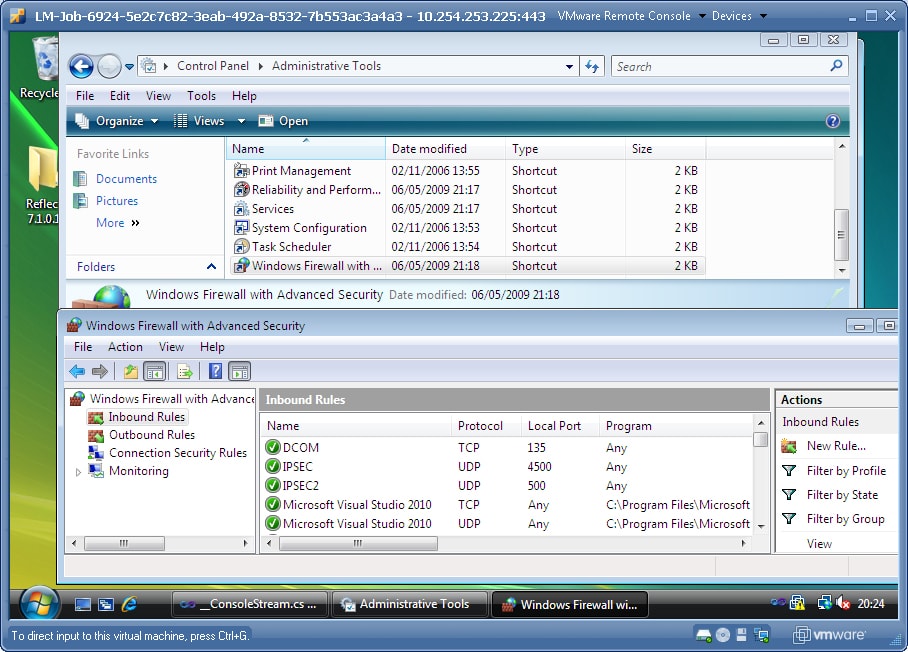
There are various posts on the Internet detailing the permissions that you need to add to the Windows Firewall to allow enough traffic to pass through it to allow remote debugging. In my experiments I needed to allow TCP traffic on port 135, UDP traffic on ports 4500 and 500, and also explicitly allow the devenv.exe (Visual Studio) and the MSVSMON.exe applications on the relevant computer. My inbound settings are shown below:
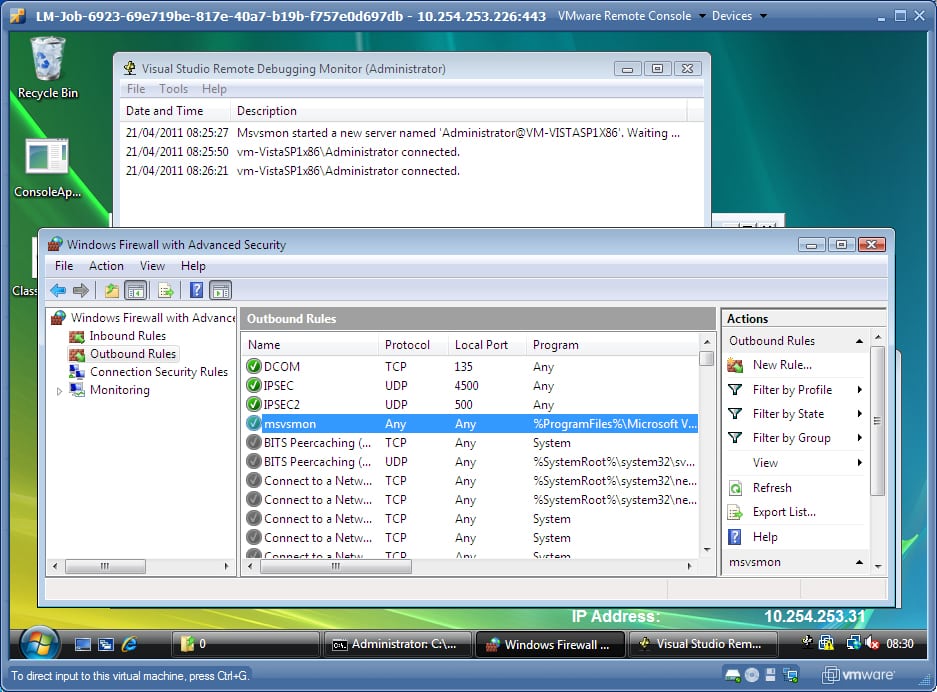
And here are the outbound settings I used:
Personally, I’m not sure how confident I’d be punching holes in a firewall in order to enable remote debugging, and hence I don’t think I’d use this technology for debugging across the Internet. I didn’t have a good example to do any measurements, but you’d imagine that the debugging experience will be a lot slower when there is any distance between the host and the target.
Summary
It is definitely quite simple to use Visual Studio’s remote debugging in some scenarios, in particular using it to debug an application running on a virtual machine that isn’t behind a firewall. Given the amount of setup required to run it on a customer machine, I doubt that the technology is appropriate for debugging production applications, but it can certainly be useful in scenarios where you control all of the interacting machines.
Related Links
- How to Set up Remote Debugging
- Exploring Windows Azure – is it more than just hosting? by Alex Davies
- Visual Studio Remote Debugging and PDB Files by John Robbins
This document contains proprietary information and is protected by copyright law.
Copyright © 2026 Red Gate Software Limited. All rights reserved
Load comments