Microsoft have been doing a great deal of innovation in the .NET space over the last year, and vast quantities of this source code has now been provided open-source on GitHub. .NET is finally starting to become portable onto other platforms such as Linux and OSX using just Microsoft-supported technology. Not so long ago, you could only run on Linux by using a technology such as Mono, but now a cut-down, open-sourced version of the .NET runtime, the CoreClr, is starting to become fully functional on both Linux and OSX.
DNX, a Dot Net eXecution environment, contains all of the code that is required to bootstrap and run an application. It includes the compilation system, SDK tools and the native CLR host, with NuGet packages being used to access assemblies that are referenced by the application. This system gives us the ability, for the first time ever, to deploy applications merely by copying them. Each application can reside in its own directory which will contain the NuGet packages for all of its dependencies.
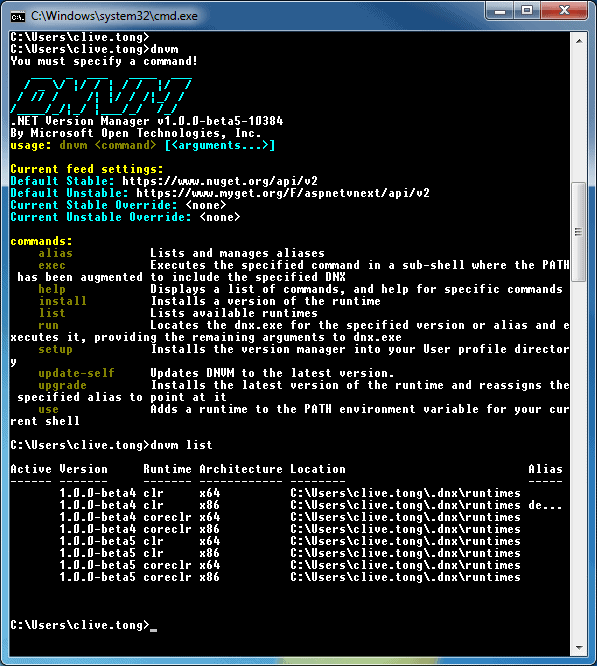
When you install VS 2015, you get a version of DNX installed onto your machine. If you start a command prompt and run DNVM, the DNX version manager, you can see the variants of the CLR that are initially installed.
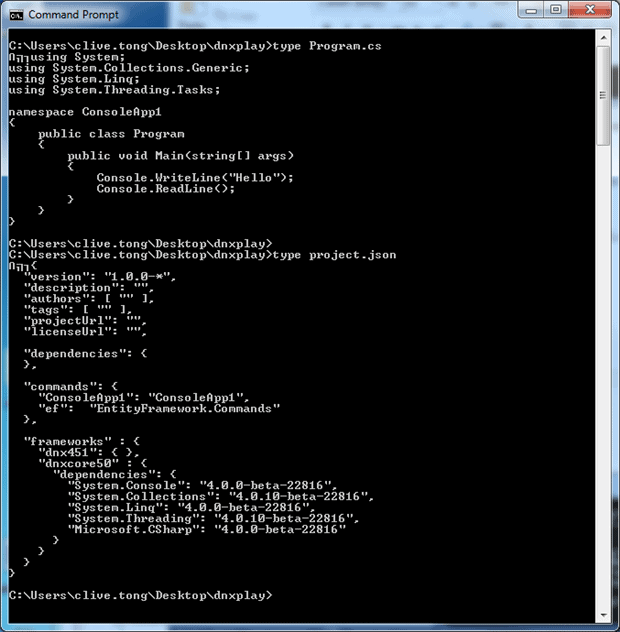
Using a simple cs code file which writes a message, and a simple project file to list the dependencies:
I can choose a version of the CLR, and then run that version of the CoreClr.
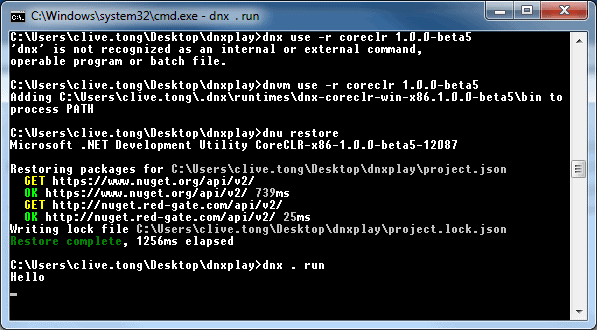
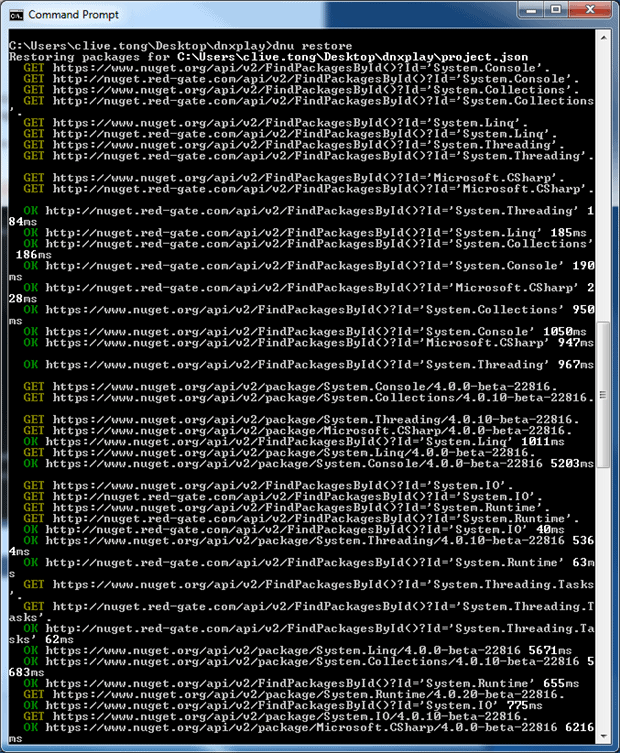
The restore command shown above downloaded the packages that the application needs, and you might wonder where the packages are stored. By default they go into a .dnx\packages folder under your user – so for me they were at C:\Users\clive.tong\.dnx\packages.
If I go to that location and clean things out then, when I run my application, I get notified of the missing packages.
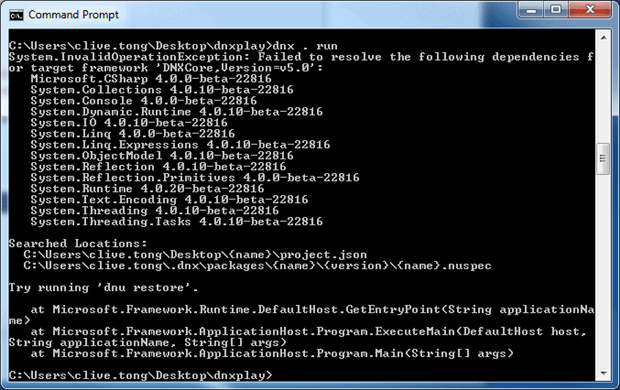
Running the restore command fetches them, and my application starts working again.
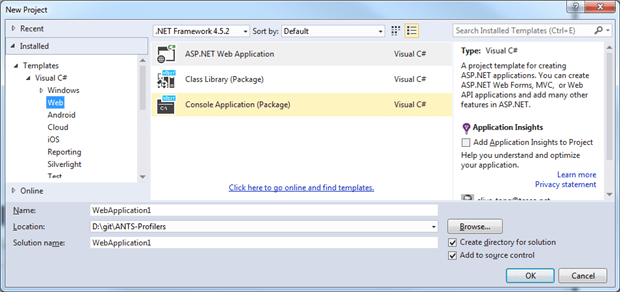
Inside VS2015, there is a way to produce a packaged console application just like the example above called ‘Console Application (Package)’.
However, the main focus is on ASP.NET web applications that sit on top of this new framework. A choice of ASP.NET Web Application leads me to a number of ASP.NET 5 preview templates:
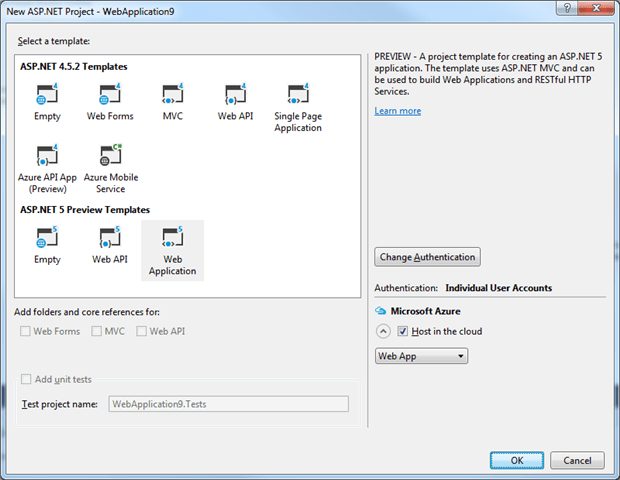
Picking, for example, Web Application, produces a demo web site that sits on top of the DNX framework.
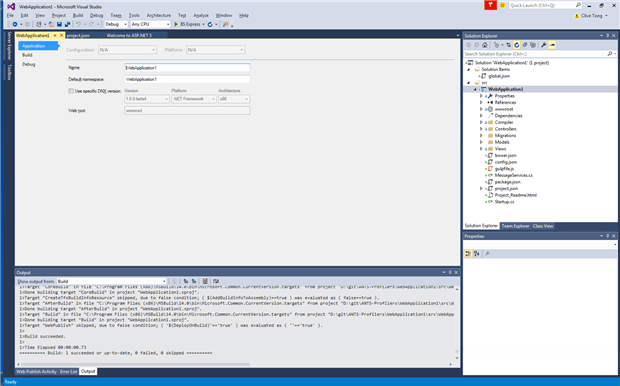
Notice that the project file is in the DNX-friendly JSON format.
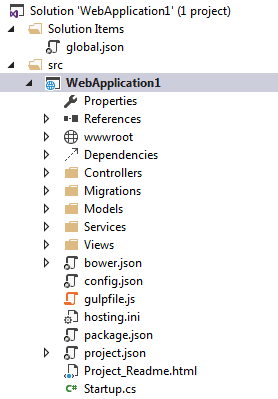
The framework choice is now slightly hidden on the project properties page. However, if I go to the properties page for the WebApplication1 project note (highlighted above), on the properties tab I can control the DNX version for the solution.
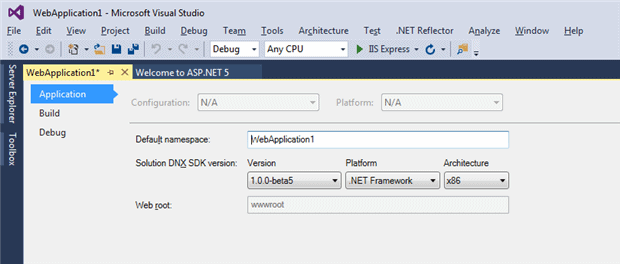
If you have difficulty trusting tooling like me, then you can try changing this setting to pick the core clr instead.

Then start the solution running and use the Debug/Modules window to see which version of the CLR is loaded.

I should also point out that you can choose if the application is hosted inside IIS Express, which it is by default.
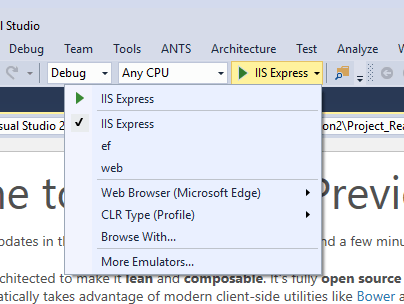
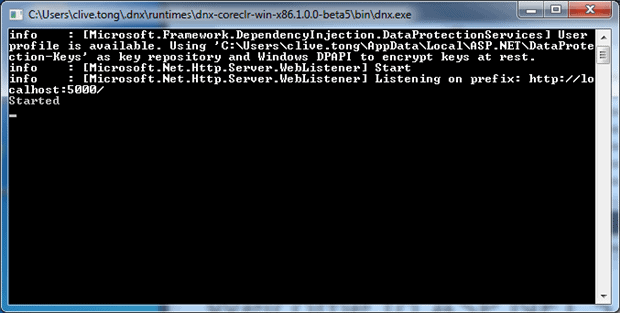
Choosing web runs the application inside a standalone web server.
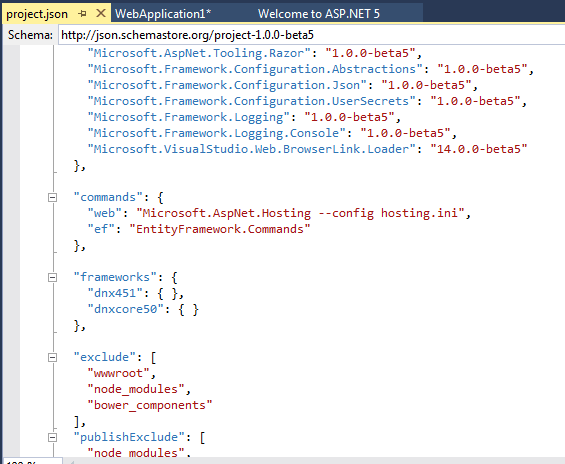
Which is in turn achieved by a set of commands embedded inside the project json file.
Having done that, and having got a functioning site running, you might be wondering how you can then profile the results. This is how I became interested in DNX. I have to confess that I don’t lie awake at night dreaming about hosting ASP.NET sites on Linux boxes. However, I do admit to being rather engrossed in trying to make sure that ANTS Profilers keep pace with all the new things that Microsoft’s .NET team introduce, such as DNX and Async. I’m not actually admitting that ANTS profiler is my baby, but I’m currently one of those holding the baby and helping it grow. It is my job to make sure that you can look at performance and memory issues easily when you are developing DNX applications.
To make it possible to look at performance for these applications, we have added a new project type within both the ANTS Performance and Memory Profilers. This manifests itself in a really simple way – there is a new tab named ASP.NET 5 that allows you to point ANTS at the relevant project.json file. You can then choose the framework to use for running the application.
“Start Profiling” will then launch the application. If you have chosen “Launch using IIS Express” under the start options then it will be hosted inside iisexpress, or otherwise as a standalone web application which will be executed using the web command inside the project file.

With this new type of project, the profiling experience should be much the same as normal. The new web projects are using Roslyn to do the compilation, which means that the system no longer compiles assemblies to temporary directories, but uses the Roslyn framework to generate in-memory assemblies. When the source code is edited, the system can seamlessly recompile the changed application making the development experience a lot richer.
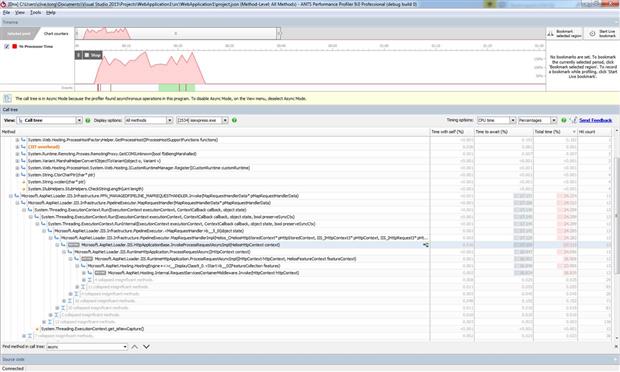
When you look at profiled output, you’ll instantly notice loads of async methods in the new framework, so the Performance Profiler’s async view gets a great workout.
Naturally, you can still examine all the SQL Calls that the application makes, and see how long they take, but you’ll be pleased to know that the Query Plan can be also displayed graphically to let you know not only which SQL Queries are slowing things down but why they are slowing things down.
You might imagine that the task of keeping Ants Performance and Memory Profiler up-to-date involves having plenty of time to stare out of the window and chat to colleagues at the water cooler. In fact, .NET is a moving target. There are always new features being introduced, and we have to be sure of being able to profile them. Our customers expect us to be able to profile anything in .NET and when Microsoft announce a whole raft of new features we sigh and reckon we have a busy time ahead to keep up! However, DNX is something rather special and we found being able to write applications that didn’t require an installer to be a giant step forward. We hope that many of you will find ANTS profilers useful for profiling these DNX applications. We’ve been able to deliver this functionality simultaneously in both APP and AMP thanks to work done earlier in the year to improve the way we share code between the two profilers – and hopefully in future we’ll be able to continue to deliver functionality to both profilers at the same time.
There are also a number of minor features in APP, including async support in .NET 4.6, an average time column in the methods view, support for the pure-managed Oracle driver and some improvements to the query plan UI. And, as ever, there’s a large number of bug fixes and general improvements. We feel quite smug about it all, but if you’re a bit hesitant, no worries because you can try both ANTS Performance Profiler and ANTS Memory Profiler for 14 days free.

Load comments