
Data, Data, Data
At the center of every great reporting and analysis product is data…lots of data. In fact, one could argue that the true effectiveness of a reporting application is directly proportional to the amount of data that the same application can handle.
SalesCenter by Matrix Solutions, the leading provider of strategic sales analysis tools to the media industry, benefits it’s users by allowing them to sift through large amounts of revenue data that would otherwise prove overwhelming.
Across Many Tiers
SalesCenter must import very large files every day to ensure that it has the most up-to-date information for our customers’ reporting needs. However, as these files grow larger and larger, the time required to import them becomes longer and longer. Since SalesCenter’s response time can be adversely affected during the importing process, it’s imperative that the import take no longer than absolutely necessary.
To further complicate the issue, the importing routine encounters several common bottlenecks…
CSV files are read from and written to disk, creating a file I/O bottleneck.
- Heavy calculations are performed on large in memory datasets, creating an application logic bottleneck.
- The resulting information is compared to and saved to an instance of SQL Server, creating a database bottleneck.
Tuning three different kinds of bottlenecks is often time consuming since a different tool is usually required to profile each type. Furthermore, since each tool is usually unaware of the other’s results, we can only get a complete picture of the situation by fitting together three separate outputs, like pieces of a puzzle.
Finding the Bottlenecks
Whereas previously we’d have to determine disk I/O and database bottlenecks by process of elimination from the application code profiler results, ANTS Performance Profiler 6 now combines the information from all three bottleneck sources directly into the results, allowing us to instantly tell whether our bottleneck is code related, disk related, or database related.
In the event that the problem is database related, ANTS Performance Profiler also shows us the longest running stored procedure which prevents us from having to determine that same information from pouring over the profiler results ourselves.
After profiling the importing process in its entirety, we have a complete end to end picture of where our bottlenecks actually lie.
We start by examining our application code. By repeatedly drilling down into the call stack, we can eventually reach our most expensive method. Our most expensive method is called GetImportedDRBRows() and is part of the ImportDBAdapter class. GetImportedDRBRows() is responsible for retrieving the newest records in our database for processing according to our business rules.
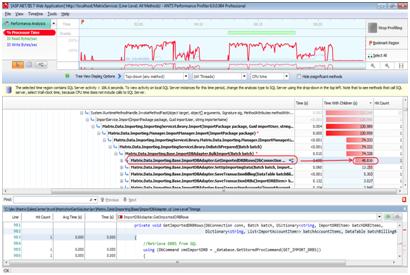
However, once we examine the interior of our GetImportedDRBRows() method we have a problem. Although we know that GetImportedDRBRows() is the point of our current bottleneck, there is nothing in that method that looks particularly sinister. In fact, when we scan the Time (s) column of the Source View we see very few methods that register any time at all. It would appear that there’s more happening in this method than meets the eye, but what?
If we review our stack trace we see that GetImportedDRBRows() reported a duration of 48.816 seconds, however, very little of that duration seems to appear in the line-by-line timing we see in the source view. But wait, we’ve been examining the CPU time of the methods, not the Wall-clock times.
ANTS Performance Profiler can measure time in either CPU time or Wall-clock time. CPU time only measures the time the current thread is actually executing-or not blocked-whereas Wall-clock time measures the total elapsed time since the thread has started. In many cases the difference between these two values is negligible; however, if a particular method happens to call out to an external resource, such as a database, then these two times can begin to vary wildly. Let’s look at the Wall-clock time for GetImportedDRBRows….68.404 seconds. That’s an increase of 40% over the CPU time! Something is definitely happening in this method, but what? Based on our knowledge of the codebase, we know that GetImportedDRBRows() interacts with our SQL Server instance so our bottleneck is most likely there. Before the latest version of ANTS Performance Profiler we’d be forced to break out SQL Server Profiler at this point to understand where our bottleneck is, but now we can examine our interaction with SQL Server without ever leaving the profiler.
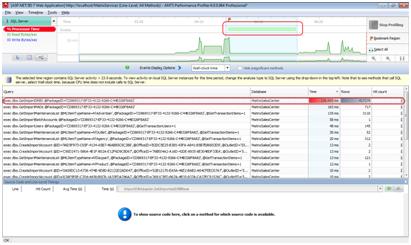
To view the SQL Server profiling results, simply select SQL Server from the drop-down in the top left of ANTS Performance Profiler. The profiler now lists all stored procedures that ran on our SQL Server instance during the profiling session. By default this list is sorted by Time to immediately bring to our attention any bottlenecks we may have, but we can also sort it by Hit count to find hotspot stored procedures which may be running an unnecessarily large number of times. Notice that the total duration of our stored procedures is already available to us, and multiple occurrences of the same stored procedure have been collapsed together to show us the total duration of all runs of that stored procedure. Had we profiled this same session using SQL Server Profiler it would have been left to us to manually calculate this same information.
But this is the entire profiling session, how do we know which part corresponds to the section of code we found in the Performance Analysis view? This is where the Events timeline comes in. Notice the light green bar displayed in the middle of our timeline. This is the same green bar that became visible when we selected GetImportedDRBRows() in the Performance Analysis view. This bar represents the section of the timeline where GetImportedDRBRows() is active. By selecting only the section of the timeline that contains this green bar, we can restrict our profiler results to include only the stored procedures that ran during the execution of the GetImportedDRBRows() method.
Instantly we can see that our largest bottleneck is, unsurprisingly, the dbo.GetImportDRBS stored procedure. Although we still need to inspect the stored procedure itself to determine how to best tune it we’ve been able to easily determine exactly where our bottleneck is.
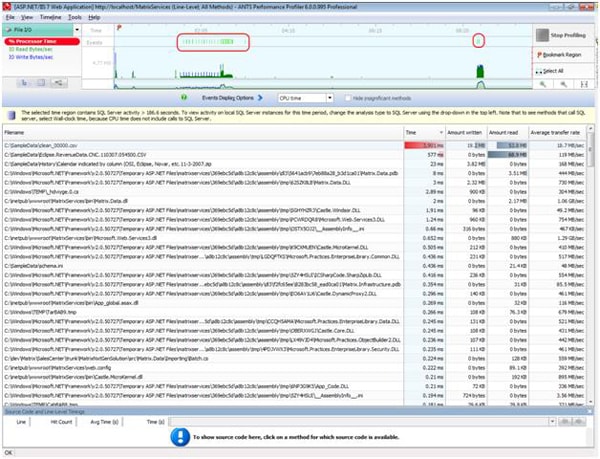
 Note that ANTS Performance Profiler also offers File I/O view which allows us to easily identify the largest bottlenecks our application encounters when reading to or writing from disk. This can be useful to truly understand the impact of file I/O on our system and to determine whether it’s worth our effort to consider alternative storage implementations, such as memory mapped files which reduce the number of trips to disk.
The File I/O view also helps us quickly spot bottlenecks due to innocuous seeming disk access, such as quickly writing data to temporary files or repeatedly reading from configuration files. The green areas highlighted in the red rectangles in the image below designate points in time where the selected file, clean_00000.csv, was read from.
Conclusion
After identifying not only the area of code where our bottleneck starts, but also the exact stored procedure responsible, it is only a matter making some adjustments to the query inside of that stored procedure to drastically increase its performance. And, by increasing that stored procedure’s performance, we can noticeably improve the performance of that section of our importing routine.
By not only profiling our application code, but also understanding how all of the tiers of our application work together, we are able to significantly reduce the time required for our importing process which noticeably improves the performance of SalesCenter for our customers. But, just as importantly, we’ve also learned that to fix performance problems in our projects, sometimes we have to look beyond our .NET code.
This document contains proprietary information and is protected by copyright law.
Copyright © 2026 Red Gate Software Limited. All rights reserved
Load comments