
Whereas deadlocks should be rare events, a certain level of blocking is normal for SQL Server. In other words, SQL Server often intentionally prevents one process from accessing an object if another process has a lock on it. This means the second process is blocked from continuing until the first process releases the lock on the object to which the second process needs access.
Of course, the purpose of this is to prevent one process from interfering with another, in cases where data corruption is possible. With proper database design, table indexing, and application code, blocking is generally limited to milliseconds and users aren’t even aware that it is occurring.
Nevertheless, few database designs, table indexing, and application code are perfect, and it’s quite common for a DBA to see blocking that lasts 10 seconds, 60 seconds, even 6,000 seconds. Obviously, this kind of blocking will significantly affect the performance of SQL Server and its users. As DBAs and developers, we need to be able to identify these types of blocking issues so they can be fixed, or their occurrence minimized.
In SQL Server 2000 and earlier, identifying blocking issues was not an easy task. One option was to use Enterprise Manager to view existing connections to see if any blocking was occurring, or using the sp_who or sp_who2 commands. If you were really ambitious, you could write some code to extract blocking data from system tables.
In SQL Server 2005, the situation has improved. Besides Management Studio, stored procedures, and system tables, we also have DMVs and even the Performance Dashboard. However, most importantly, we have a new SQL Server Profiler event, Blocked Process Report. This event does a great job of helping you to identify blocking issues and, at the same time, provides you with much of the information you need to help correct the problem.
The Blocked Process Report Event
You will like this. You only need one Profiler event to capture all the information you need to identify long-running, blocked processes. The Blocked Process Report event does all the work for you and you don’t even need to capture any context events.

Figure 1: Only a single event is needed to capture information on blocked processes.
However, you may not like this. Up to this point when we selected events to identify a SQL Server issue, we just selected the event and the event was automatically collected for us when the trace ran. This is not the case with the Blocked Process Report event. In other words, if you select this event and run a trace, you will never collect any events. No, this is not a bug in Profiler; it has been designed to run this way.
This is not as big a deal as it may seem, but using the Blocked Process Report event requires you do perform an extra, non-Profiler-related task. You just have to keep this in mind, because if you forget about it, you will be pounding your head on your desk trying to figure out why this particular event doesn’t work.
The fact is that collecting information about blocked processes in SQL Server 2005 is resource-intensive and so, by default, the Blocked Process Report event is turned off. This way, if you don’t use this event, it is not wasting valuable server resources. Ideally, you will turn the feature on when you need it and turn it off when you don’t.
You turn the Blocked Process Report event on and off using the SP_CONFIGURE 'blocked process threshold' command. By default, this option is set to 0, which means that the Blocked Process Report event is turned off. The SP_CONFIGURE 'blocked process threshold' command is an advanced SP_CONFIGURE command, which means that the SP_CONFIGURE 'show advanced options' command must be run first in order to be able to turn on the SP_CONFIGURE 'blocked process threshold' command, assuming this had not been done previously. In addition, as with most SP_CONFIGURE commands, you have to run the RECONFIGURE command afterwards to activate them.
The following code turns on the 'show advanced options' – again, assuming you have not already done so.
|
1 2 3 4 5 6 |
SP_CONFIGURE'show advanced options',1 ; GO RECONFIGURE ; GO |
Now that the advanced options are on, the Blocked Process Report can be turned on, using this code:
|
1 2 3 4 5 6 |
SP_CONFIGURE'blocked process threshold',10 ; GO RECONFIGURE ; GO |
After the SP_CONFIGURE 'blocked process threshold' command there is a value – in this case, the number 10. Setting this number allows you to control how often you want to look for blocked processes, since it determines how often the Blocked Process Report event is fired. In this example, the Blocked Process Report event will fire repeatedly, every 10 seconds. If any blocked processes occur within that 10 second period, they will be displayed as part of the report. Once you have finished running the Blocked Process Report, you will want to turn it off with the following command.
|
1 2 3 4 5 6 |
SP_CONFIGURE'blocked process threshold',0 ; GO RECONFIGURE ; GO |
We will talk more about how the report works when we get to the section on how to analyze the trace.
Selecting Data Columns
Unlike many other events, the Blocked Process Report event doesn’t offer you many data columns to choose from. At the very minimum, I select these data columns, and order them as they are ordered below:
- Events
- TextData
- Duration
- IndexID
- Mode
- LoginSid
- DatabaseID
- ServerName
- EndTime
We have talked about all the above columns filters before, except for one, and that is Mode. The content of the Mode data column varies depending on the nature of the event. For the Blocked Process Report Event, here are the possible values:
- 0=NULL
- 1=Sch-S
- 2=Sch-M
- 3=S
- 4=U
- 5=X
- 6=IS
- 7=IU
- 8=IX
- 9=SIU
- 10=SIX
- 11=UIX
- 12=BU
- 13=RangeS-S
- 14=RangeS-U
- 15=RangeI-N
- 16=RangeI-S
- 17=RangeI-U
- 18=RangeI-X
- 19=RangeX-S
- 20=RangeX-U
- 21=RangeX-X
Each value represents a type of lock that was received or requested for the event.
NOTE: If you are not familiar with lock types, you can learn about them in SQL Server 2005 Books Online. This information might be useful to you when trying to figure out why a particular blocking lock occurred.
Selecting a Column Filter
You can choose to filter by any of the available data columns. In most cases the only data column I ever filter by is DatabaseID. While not required, it does limit your trace to one database at a time, which may be useful if your server has many databases.
Column Organization
I don’t normally perform any grouping or aggregation when running this trace and I generally order the data columns in a way that works best for me
Running the Trace
Running a Blocked Process Report event trace can noticeably affect a server’s performance, so it is important that you after you have performed the trace, you then turn it off. On the other hand, it is often hard to predict when blocking will occur. If you have a feel for the time of the day when blocking problems most often arise, then that is the time you should pick for conducting your trace. If you aren’t able to pinpoint a time range, you might have to perform a trace for a 24-hour period. If you do this, be sure that you set the time period for the Blocked Process Report to run at a large number, such as 1800 (30 minutes). This will help to minimize the load and reduce the number of times the event is fired. You may also want to monitor the trace visually for a while to see what kind of results you are getting. If you get many blocked events, you may want to change the trace collection time to one more appropriate to your environment.
Analyzing the Trace
Figure 5-8 shows the information collected in a typical trace, from the blocked process report event:
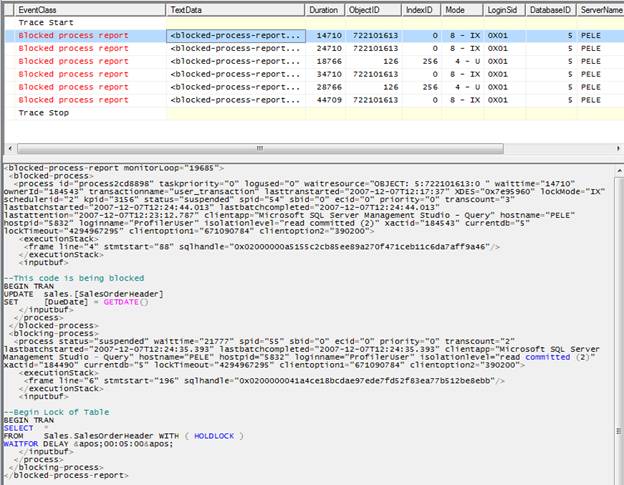
Figure 5-8: This is an excerpt from a Blocked Process Report that runs every 10 seconds.
In row 2, the first Blocked Process Report event is fired. Notice that the event has a duration of 14710 (about 15 seconds). This tells us that there has been a blocking lock occurring for about 15 seconds from(?) the time this event fired (which, in our example is once every 10 seconds). While the other data columns can sometimes provide us with useful information, the most important data column is TextData, which contains XML describing the blocking event, displaying both the code that is causing the blocking and the code that is being blocked, together with a lot of other detail.
For this blocked process event, the code that is causing the blocking is shown in figure 5-9:
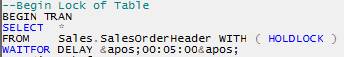
Figure 5-9: This code is causing the blocking.
This blocking code is found at the bottom of the window, near the bottom of the XML code. Since I was creating sample code, I added a comment to the blocking code to make it obvious in the XML code. If you look toward the middle of the XML data, you will find the code this is being blocked, as shown in figure 5-10:
![]()
Figure 5-10: This code is being blocked.
By examining the blocking and the blocked code, you should be able to eventually determine why the blocking is occurring. It might be because too much data is being returned, which takes time; or it might be caused by a missing index; or maybe even a poor locking choice made by SQL Server. Sometimes the problem will be obvious; at other times it will require additional investigation. For example, you may need to take a look at the code’s graphical execution plan to figure out what exactly is going on. If you read the XML, there is additional information that may be helpful, such as the isolation level used for the connections, SPID, username, current state, and so on.
Now that we have looked at a single Blocked Process Report event, let’s look at several others so that you better understand what you are viewing. Take a look at the first two Blocked Process Report events in figure 5-11:
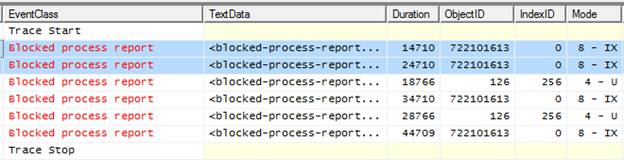
Figure 5-11: Notice that the first two events are 10 seconds apart and represent the same ObjectID.
The first of the two events has a duration of 14710 milliseconds indicating that, at the time the event fired, there was a blocked process that had been blocked for 14710 milliseconds, and it affected ObjectID 722101613.
The second of the two events has a duration of 24710 milliseconds indicating a blocked process for 24710 milliseconds, affecting the same object. Notice that this is exactly 10 seconds longer than for the first event and that, in our example, the event fires every 10 seconds.
In other words, the second event is a repeat of the first event and it’s just telling us that the same blocking lock still existed 10 seconds later. If the block had cleared before the blocked process report event fired a second time, then we would not have seen that second row in the trace. So keep the following point in mind: at every time interval (which you set), all currently blocked events will be displayed.
Now it gets a little more complex. Take a look at Figure 5-12:
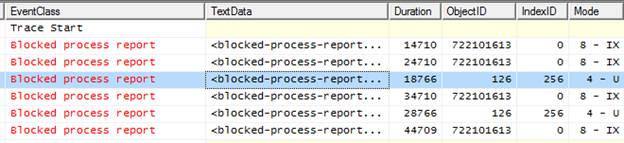
Figure 5-12: This Blocked Process Report event represents a different blocking lock.
The third row has a duration of 18766 milliseconds and affects a different object. This is actually a second blocking event that occurred during the same time frame as the event in row two. In other words, rows two and three are blocking(?) events that were occurring during the second 10-second cycle of the Blocked Process Report.
When the third 10-second event fires, rows four and five appear on the trace. From the durations and the object they affect, you can see that the same two blocking events that existed the second time are still causing an issue the third time. You could also verify this by looking at the TextData data column.
As blocking starts and stops, each 10-second (in our example) interval may have different blocking events. In this example there are only two. But on a production system, you could easily have blocking events come and go, which makes reading the report quite tricky. The key is to identify those blocked processes that are blocked the longest (Duration), identify how often this happens, and examine the code causing the event. Once you have all this information, you should be ready to determine the cause of the blocking lock, and hopefully resolve it.
How do you resolve blocking locks? While the way to resolve blocking lock problems vary, some of the ones you may one to consider include:
Identify problematic code and rewrite it. Ensure that all transactions are as short as possible. Only return the absolutely minimum amount of data needed. Identify and add missing indexes. Ensure column and index statistics are kept current. Use hints to modify locking behavior. Use the lowest isolation level acceptable.
This document contains proprietary information and is protected by copyright law.
Copyright © 2026 Red Gate Software Limited. All rights reserved
Load comments