Diagrams are often a great help in understanding how databases work. I’ve always wanted to generate various database diagrams automatically to go with my database documentation. The problem is that, once you’ve drawn them nicely in a drawing package, you feel reluctant to alter the database because you’d then have to re-draw the diagrams to reflect those changes. This article explains a way of creating easily ‘refreshed’ automated diagrams based only on open-source, or free, tools.
PlantUML
We’ll be using PlantUML. PlantUML is an open-source project for writing Unified Modelling Language (UML) diagrams for Sequence, Use-Case, Class, Activity, Component, State and Objects. It uses GraphViz for its graphical output. Its use, like GraphViz, is to render quite complex diagrams from a simple intuitive language based on text.
For example, this will give you a simple UML sequence diagram:
|
1 2 3 4 5 6 7 8 |
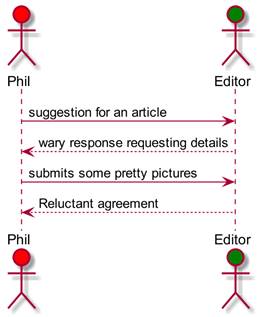
@startuml actor Phil #red actor Editor #green Phil -> Editor: suggestion for an article Editor --> Phil: wary response requesting details Phil -> Editor: submits some pretty pictures Editor --> Phil: Reluctant agreement @enduml |
If this code is then processed by PlantUML, would provide this .PNG image:
Don’t like the style? You can specify it how you like. With a little extra tweaking with the skinparam, you can get this instead
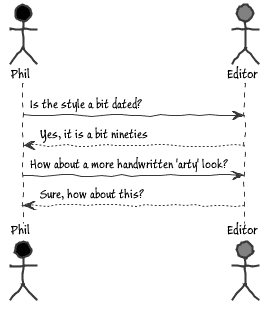
the code changes are simple
|
1 2 3 4 5 6 7 8 9 10 11 12 13 14 15 16 |
@startuml skinparam handwritten true skinparam monochrome true skinparam packageStyle rect skinparam defaultFontName Buxton Sketch skinparam shadowing false actor Phil #black actor Editor #grey Phil -> Editor: Is the style a bit dated? Editor --> Phil: Yes, it is a bit nineties Phil -> Editor: How about a more handwritten 'arty' look? Editor --> Phil: Sure, how about this? @enduml |
Although you may have little urge to use UML diagrams in your everyday work, PlantUML is versatile enough to provide for a range of requirements. For a relational database person who winces at the terms ‘class’ and ‘persistence’, even UML modelling has its uses as a way of communicating ideas and designs.
In this article I’m going to show how it can be used to easily generate class diagrams for database objects. I will use TSQL code to create the PlantUML code directly.
Getting up and running
To get you started, there is a little browser application here on the PlantUML site that allows you to type in PlantUML code and view the results. With that, and the PlantUML manual, you should be well away with using this interesting application. Chrome has an Add-in that runs PlantUML called the UML Diagram Editor.
There are many ways of using PlantUML. There are several Atom packages that add PlantUML integration. If you use DocuWiki for documentation, there is an add-in for PlantUML, which is handy for teams since there is nothing to install on your machine then. If you want to use PlantUML from the command-line, there are install instructions here. I use AsciiDocFx, which installs the prerequisites for you (though you may need to set the path to your GraphViz install. You can use your favourite editor via a command-line interface as well. PlantUML uses simple text-based instructions to render UML diagrams and these can be generated from SQL to show you such things as the intricacies of your database permission system, the foreign-key dependencies, or the details of your indexing strategy for a table.
We’ll just stick to showing a subset of your database objects and the dependencies between them.
Data Modelling With Unified Modelling Language (UML)
Let’s look at AdventureWorks, just so we can try things out. I’ve always been caught out by views so it would be nice to see those objects in the database that a view references. Here is a simple diagram.
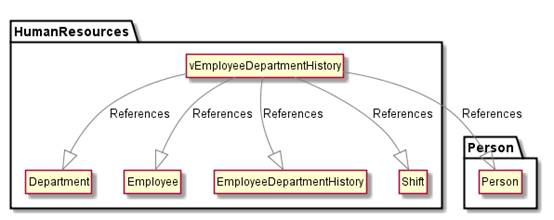
Note that schemas have been represented as folders. All I did to do this was to use the text:
|
1 2 3 4 5 6 7 8 9 10 11 12 13 14 |
@startUML hide empty members hide circle skinparam classarrowcolor gray HumanResources.vEmployeeDepartmentHistory --|> HumanResources.Department:References HumanResources.vEmployeeDepartmentHistory --|> HumanResources.Employee:References HumanResources.vEmployeeDepartmentHistory --|> HumanResources.EmployeeDepartmentHistory:References HumanResources.vEmployeeDepartmentHistory --|> Person.Person:References HumanResources.vEmployeeDepartmentHistory --|> HumanResources.Shift:References @enduml |
I didn’t type this in. I just executed the SQL query that finds the soft references and foreign key references to and from the object that you name…
|
1 2 3 4 5 6 7 8 9 10 11 12 13 14 15 16 17 18 19 20 21 |
DECLARE @object_ID INT SELECT @Object_ID=object_id('HumanResources.vEmployeeDepartmentHistory') SELECT coalesce(object_schema_name(referencing_ID)+'.','') + object_name(referencing_ID) +' --|> ' + referenced_schema_name+'.'+Referenced_Entity_name + ':References' --AS reference FROM sys.sql_expression_dependencies WHERE (referencing_id =@object_ID OR referenced_ID = @object_ID) AND is_schema_bound_reference =0 and referenced_ID is not null UNION ALL SELECT coalesce(object_schema_name(parent_object_ID)+'.','') + object_name(parent_object_ID) + ' --|> ' + coalesce(object_schema_name(referenced_object_ID)+'.','') + object_name(referenced_object_ID)+':FK' FROM sys.foreign_keys WHERE parent_object_ID = @object_ID OR referenced_object_ID = @object_ID |
…and copied the result from the results pane (use text mode and set the ‘Query‘ ‘Options‘ -> ‘Results’ -> ‘Text’ -> ‘Maximum number of characters displayed in each column‘ to 8192 or some other generous figure)
…but you can of course use it with any other database object such as dbo.ufnGetContactInformation. Obviously, there is plenty more you can include but there is something to be said for having just one clear message to every diagram. Be wary about including too much in a diagram. Any network diagram quickly morphs into a birds-nest diagram if you try to do too much. This type of diagram was never intended to provide an entire map of your database.
Once you’ve got some confidence, you can use PowerShell to update diagrams automatically. You just execute the code, save the result to disk, and pass the result to PlantUML, which has a command-line interface.
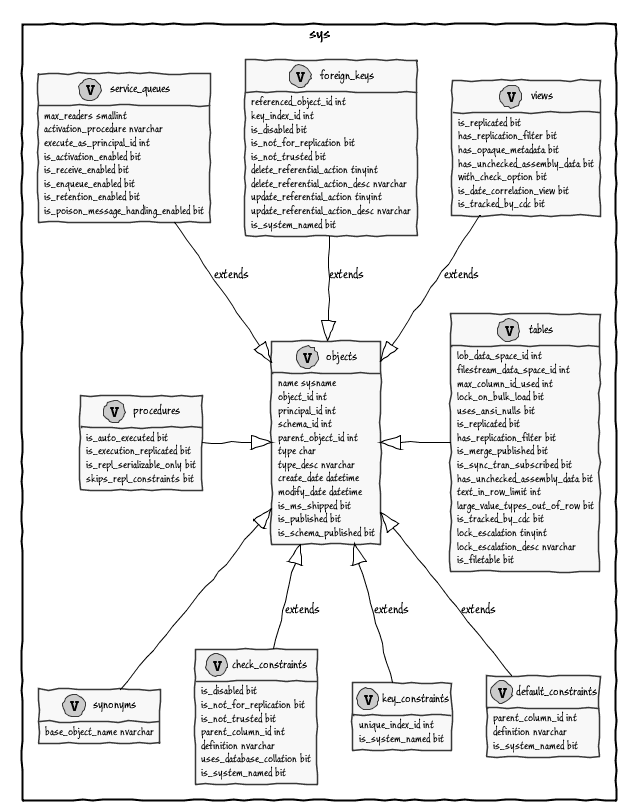
Sometimes we would like to do a bit more than this. Now UML never had a stereotype to deal with a relational database, but there is an established database profile that includes a logical and physical model. As I have no strong feelings about the way that a table is represented, I’ve not deviated much from the standard class.
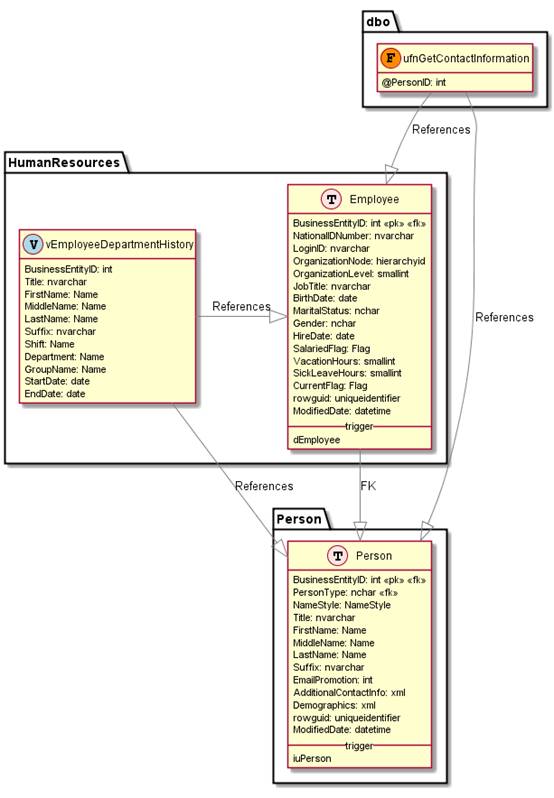
We have drilled in to the detail from the first diagram here to look more closely at the tables. PlantUML is able to give you immense diagrams which are probably useless for our purpose here. If you want to do this, I’d advise you just to open the wallet a bit and use SQL Dependency Tracker instead. Here we want to keep things simpler, and just want to document tables, views, and functions and their dependencies in detail.
The PlantUML source code that we used is this, generated from SQL code…
|
1 2 3 4 5 6 7 8 9 10 11 12 13 14 15 16 17 18 19 20 21 22 23 24 25 26 27 28 29 30 31 32 33 34 35 36 37 38 39 40 41 42 43 44 45 46 47 48 49 50 51 52 53 54 55 56 57 58 59 60 61 62 63 64 65 66 67 68 69 70 71 72 73 74 75 76 77 |
!define table(x) class x << (T,mistyrose) >> !define view(x) class x << (V,lightblue) >> !define table(x) class x << (T,mistyrose) >> !define tr(x) class x << (R,red) >> !define tf(x) class x << (F,darkorange) >> !define af(x) class x << (F,white) >> !define fn(x) class x << (F,plum) >> !define fs(x) class x << (F,tan) >> !define ft(x) class x << (F,wheat) >> !define if(x) class x << (F,gaisboro) >> !define p(x) class x << (P,indianred) >> !define pc(x) class x << (P,lemonshiffon) >> !define x(x) class x << (P,linen) >> hide methods hide stereotypes skinparam classarrowcolor gray table(HumanResources.Employee) { BusinessEntityID: int <<pk>> <<fk>> NationalIDNumber: nvarchar LoginID: nvarchar OrganizationNode: hierarchyid OrganizationLevel: smallint JobTitle: nvarchar BirthDate: date MaritalStatus: nchar Gender: nchar HireDate: date SalariedFlag: Flag VacationHours: smallint SickLeaveHours: smallint CurrentFlag: Flag rowguid: uniqueidentifier ModifiedDate: datetime __ trigger __ dEmployee } table(Person.Person) { BusinessEntityID: int <<pk>> <<fk>> PersonType: nchar <<fk>> NameStyle: NameStyle Title: nvarchar FirstName: Name MiddleName: Name LastName: Name Suffix: nvarchar EmailPromotion: int AdditionalContactInfo: xml Demographics: xml rowguid: uniqueidentifier ModifiedDate: datetime __ trigger __ iuPerson } view(HumanResources.vEmployeeDepartmentHistory) { BusinessEntityID: int Title: nvarchar FirstName: Name MiddleName: Name LastName: Name Suffix: nvarchar Shift: Name Department: Name GroupName: Name StartDate: date EndDate: date } tf(dbo.ufnGetContactInformation) { @PersonID: int } dbo.ufnGetContactInformation -|> HumanResources.Employee:References dbo.ufnGetContactInformation -|> Person.Person:References HumanResources.vEmployeeDepartmentHistory -|> HumanResources.Employee:References HumanResources.vEmployeeDepartmentHistory -|> Person.Person:References HumanResources.Employee -|> Person.Person:FK |
All we have done is to give a list of the tables that we want a diagram for.
Here is the code:
|
1 2 3 4 5 |
Declare @ThePlantUMLCode Varchar(max) execute CreatePlantUMLCode @ObjectsToShow='HumanResources.employee person.person HumanResources.vEmployeeDepartmentHistory dbo.ufnGetContactInformation', @MyPlantUMLStatement=@ThePlantUMLCode output select @ThePlantUMLCode |
I have only shown how to execute the stored procedure I wrote. I have specified the four objects whose dependencies and relationships I’m interested in. You may want to see all the dependencies and relationship of any object but even just the directly linked objects can overwhelm the diagram. It is better to be selective. PlantUML will do its best to oblige but you are soon at the wallchart scale of activity.
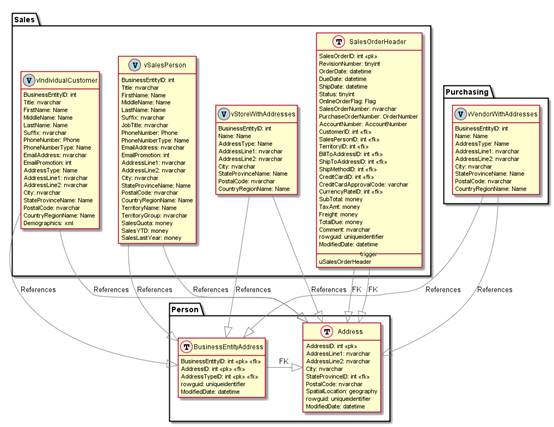
This stored procedure can do other things. What if you want to see a UML diagram of all the objects that reference person.address Here, it is
|
1 2 3 4 |
Declare @ThePlantUMLCode Varchar(max) execute CreatePlantUMLCode @DependsOn='person.address', @MyPlantUMLStatement=@ThePlantUMLCode output select @ThePlantUMLCode |
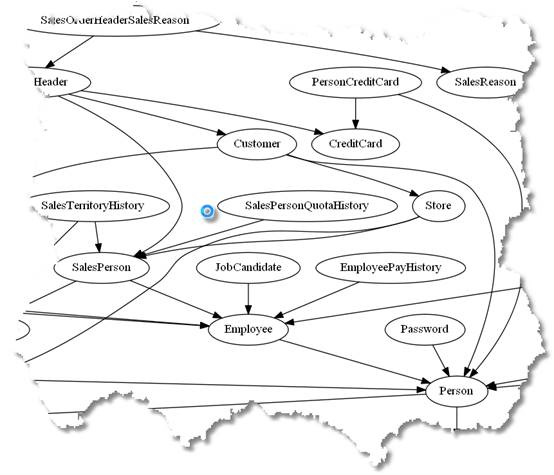
…giving you this, once the output is passed to PlantUML. …
… or this …
|
1 2 3 4 5 |
Declare @ThePlantUMLCode Varchar(max) execute CreatePlantUMLCode @DependenciesOf='person.address', @MyPlantUMLStatement=@ThePlantUMLCode output select @ThePlantUMLCode ThePlantUMLCode |
… giving you this … 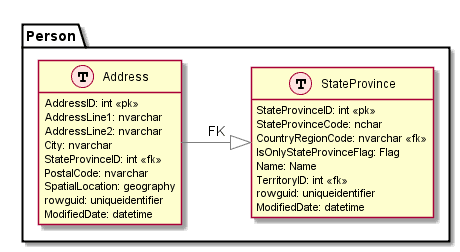
I’ve given the SQL code at the end of the article.
Modifying your diagrams
I have taken quite a few design decisions which you may not like. Fortunately, PlantUML has an excellent PDF manual which explains that you can change almost everything. It is so good that I’m not going to attempt to repeat anything from it. However, be assured that diagrams can be altered to suit your requirements: Related objects can be placed side by side, or vertically;, You can use dotted arrows or arrows with a different head; You can opt to avoid shadows, and change the colour of anything. My instinct is to leave GraphViz and PlantUML to do as much as possible by default.
PlantUML supports a flavour of markdown called Creole. This allows you to have formatted notes and descriptions. There is even a full set of icons from OpenIconic. Because PlantUML is based on GraphViz, you can use Graphviz raw. This allows you to do more general network visualisation diagrams for general software-engineering purposes. For database people, it is great for plotting out chains of dependencies in database data or in databases themselves.
GraphViz Dot Language
PlantUML can execute graphviz dot language files as well. We can therefore use PlantUML to draw ‘network’ diagrams, which is something thet GraphViz does extraordinarily well. Most of the time, you’d probably want to do it with data but you can do it for your SQL Server metadata. Here, for example is Northwind’s table dependency diagram based on foreign key relationships
|
1 2 3 4 5 6 7 8 9 10 11 12 13 14 15 16 |
@startdot digraph G { CustomerCustomerDemo -> CustomerDemographics; CustomerCustomerDemo -> Customers; Employees -> Employees; EmployeeTerritories -> Employees; EmployeeTerritories -> Territories; Order Details -> Orders; Order Details -> Products; Orders -> Customers; Orders -> Employees; Orders -> Shippers; Products -> Categories; Products -> Suppliers; Territories -> Region;} @enddot |
This code produced this diagram (you can click on it to enlarge it)
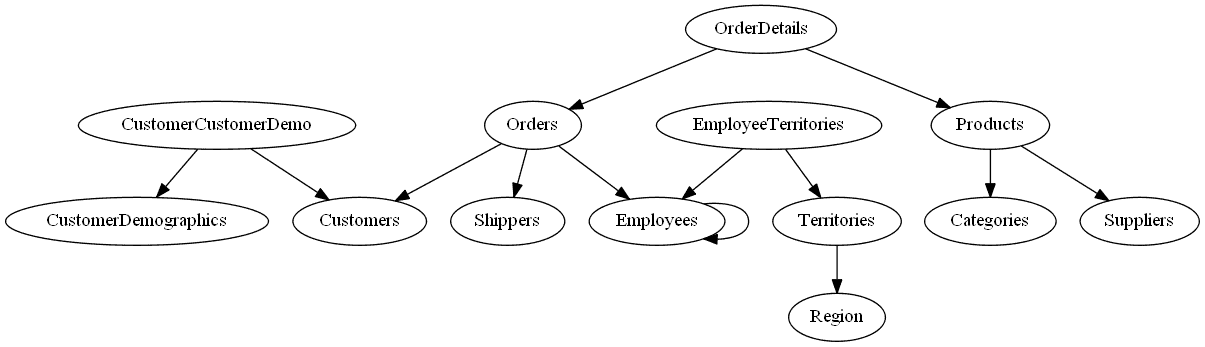
..but you’ll see that I’m cheating a bit by using a very small sample database. Even AdventureWorks produces a big mess.
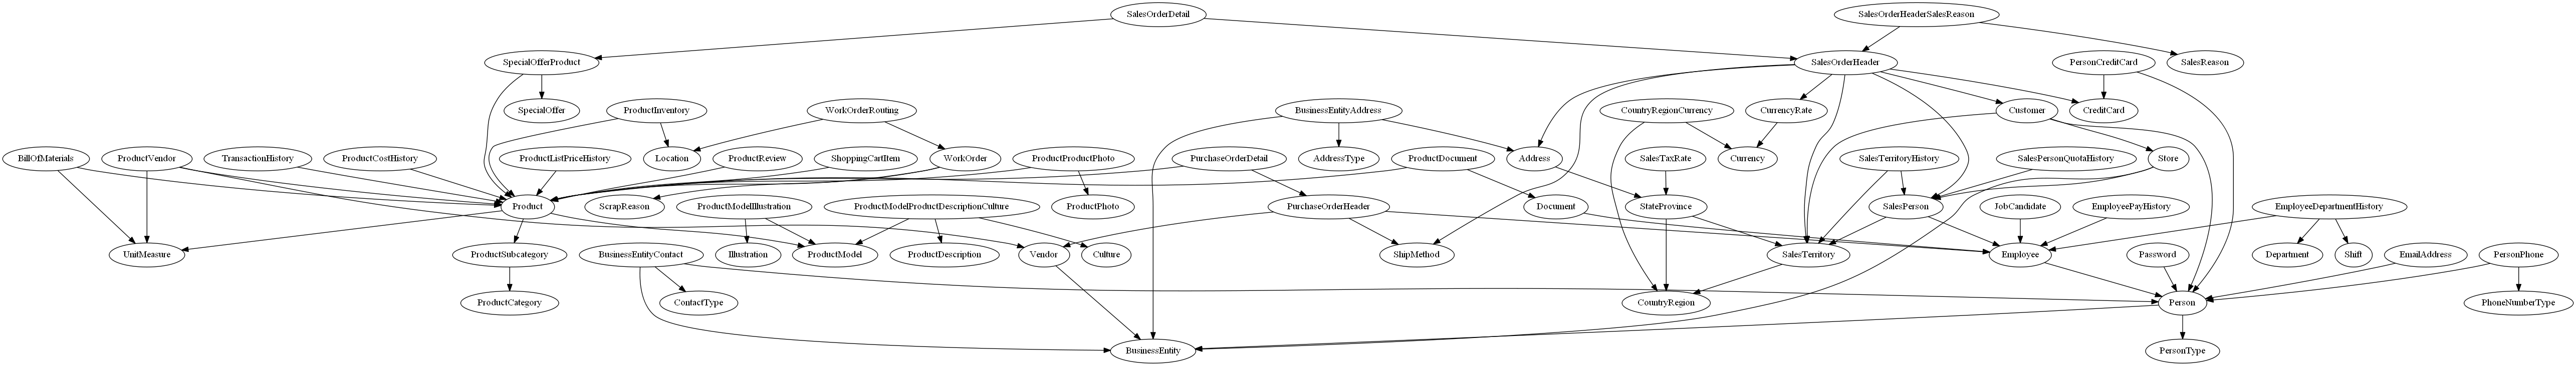
Which you can view if you have an image viewer that scrolls!
How did I do this? Just the same way as the first database UML diagrams. I just executed this in SSMS, and copied the result into a text editor, just to put in the top and tail as shown above.
|
1 2 3 4 |
Select distinct object_name(parent_object_ID) + ' -> ' + object_name(referenced_object_ID)+';' FROM sys.foreign_keys |
This can easily be refined into a stored procedure that takes out those illegal characters that make graphviz crash. GraphViz has a lot of power and it is worth looking around for examples and information.
References
- http://www.graphviz.org/This is the main site for Graphviz. There is plenty of information here, and it is from this site that you can get the GraphViz application and documentation
- http://plantuml.com/ This is the PlantUML site. It has a large number of resources including downloads and documentation.
- http://plantuml.com/PlantUML_Language_Reference_Guide.pdf The essential book of PlantUML. It is much less confusing to read than the PlantUML site that has some distracting google adverts.
- https://graphviz.gitlab.io/_pages/pdf/dotguide.pdf The equivalent book of GraphViz. It was written some time ago but still seems relevant.
- http://asciidocfx.com/ The site for ASCIIdocFX, which is a very cute and useful editor for ASCIIdoc (Markdown for grown-ups) which is intended for creating technical books with mixed text and diagrams. The editor is based on Atom, and you can use PlantUML, GraphViz and DITAA for drawing your diagrams.
- https://www.dokuwiki.org/dokuwiki# DocuWiki is a wiki that is geared towards technical documentation. The real power of Docuwiki is in the add-ins, one of which gives you PlantUML diagrams embedded in your documentation.
- http://www.agiledata.org/essays/umlDataModelingProfile.html A specification for using UML diagrams for databases by Simple-Talk author Scott W Ambler
The Code
|
1 2 3 4 5 6 7 8 9 10 11 12 13 14 15 16 17 18 19 20 21 22 23 24 25 26 27 28 29 30 31 32 33 34 35 36 37 38 39 40 41 42 43 44 45 46 47 48 49 50 51 52 53 54 55 56 57 58 59 60 61 62 63 64 65 66 67 68 69 70 71 72 73 74 75 76 77 78 79 80 81 82 83 84 85 86 87 88 89 90 91 92 93 94 95 96 97 98 99 100 101 102 103 104 105 106 107 108 109 110 111 112 113 114 115 116 117 118 119 120 121 122 123 124 125 126 127 128 129 130 131 132 133 134 135 136 137 138 139 140 141 142 143 144 145 146 147 148 149 150 151 152 153 154 155 156 157 158 159 160 161 162 163 164 165 166 167 168 169 170 171 172 173 174 175 176 177 178 179 180 181 182 183 184 185 186 187 188 189 190 191 192 193 194 195 196 197 198 199 200 201 202 203 204 205 206 207 208 209 210 211 212 213 214 215 216 217 218 219 220 221 222 223 224 225 226 227 228 229 230 231 232 233 234 235 236 237 238 239 240 241 242 243 244 245 246 247 248 249 250 251 252 253 254 255 256 257 258 259 260 261 262 263 264 265 |
/* we are just using this for chopping up a space-delimited list of database objects. If you have embedded spaces in your object names then tough. You'll have to do it differently*/ if exists (Select * from sys.xml_schema_collections where name like 'ObjectListParameter') drop XML SCHEMA COLLECTION ObjectListParameter go create xml schema collection ObjectListParameter as ' <xs:schema xmlns:xs="http://www.w3.org/2001/XMLSchema"> <xs:element name="Object"> <xs:simpleType> <xs:list itemType="xs:string" /> </xs:simpleType> </xs:element> </xs:schema>' go /* */ go -- does a particular procedure exist IF EXISTS ( SELECT 1 FROM sys.objects WHERE object_ID= object_ID('dbo.CreatePlantUMLCode')) SET NOEXEC ON GO -- if the routine exists this isn't executed CREATE PROCEDURE dbo.CreatePlantUMLCode AS Select 'created, but not implemented yet.'--just anything will do GO -- the following section will be always executed SET NOEXEC OFF GO Alter procedure CreatePlantUMLCode @ObjectsToShow NVarchar(400)=null, -- space-delimited list of database objects @dependenciesOf NVarchar(400)=null, --show the first order objects that reference or otherwise depend on it @dependsOn NVarchar(400)=null, --show the objects that it depends on @MyPlantUMLStatement varchar(max) output --the code to use for the diagram /* Examples of use: Declare @ThePlantUMLCode Varchar(max) execute CreatePlantUMLCode @ObjectsToShow='HumanResources.employee person.person', @MyPlantUMLStatement=@ThePlantUMLCode output select @ThePlantUMLCode Declare @ThePlantUMLCode Varchar(max) execute CreatePlantUMLCode @DependsOn='person.address', @MyPlantUMLStatement=@ThePlantUMLCode output select @ThePlantUMLCode Declare @ThePlantUMLCode Varchar(max) execute CreatePlantUMLCode @DependenciesOf='person.address', @MyPlantUMLStatement=@ThePlantUMLCode output select @ThePlantUMLCode Declare @ThePlantUMLCode Varchar(max) execute CreatePlantUMLCode @ObjectsToShow='HumanResources.employee person.person HumanResources.vEmployeeDepartmentHistory dbo.ufnGetContactInformation', @MyPlantUMLStatement=@ThePlantUMLCode output select @ThePlantUMLCode execute CreatePlantUMLCode @ObjectsToShow='dbo.ufnGetContactInformation', @MyPlantUMLStatement=@ThePlantUMLCode output select @ThePlantUMLCode Declare @ThePlantUMLCode Varchar(max) execute CreatePlantUMLCode @ObjectsToShow='HumanResources.employee person.person HumanResources.vEmployeeDepartmentHistory ', @MyPlantUMLStatement=@ThePlantUMLCode output select @ThePlantUMLCode execute CreatePlantUMLCode @ObjectsToShow='HumanResources.vEmployeeDepartmentHistory dbo.ufnGetContactInformation', @MyPlantUMLStatement=@ThePlantUMLCode output select @ThePlantUMLCode */ as --has the user given us a list of objects? Declare @ObjectsToDo table(Object_ID int primary key) --check only specified once! declare @xml_data xml(ObjectListParameter) set @xml_data='<Object>'+ @ObjectsToShow +'</Object>' Declare @ii int Select @ii=0 --what has been specified in the parameters if (@ObjectsToShow is not null) set @ii=@ii+1 if (@DependenciesOf is not null) set @ii=@ii+1 if (@DependsOn is not null) set @ii=@ii+1 if (@ii<1) begin raiserror('Sorry, but you''ll need to specify what to draw!', 16,1);return;end if (@ii>1) begin raiserror('Sorry, only one parameter can be used at a time', 16,1);return;end /* if he has given a list, then we need to parse the list and find the IDs of reach database object that has been specified */ if @ObjectsToShow is not null begin insert into @ObjectsToDo select object_ID(T.ref.value('.', 'sysname')) from (Select @xml_data.query(' for $i in data(/Object) return element item { $i } ')) A(list) cross apply A.List.nodes('/item') T(ref) end --does the user want to see the dependencies if @DependenciesOf is not null begin --get all the foreign key references insert into @ObjectsToDo Select referenced_object_ID from sys.foreign_keys where parent_object_id=object_ID(@DependenciesOf) union all --and all the objects that refer to it Select referenced_ID from sys.sql_expression_dependencies where referencing_id=object_ID(@DependenciesOf) and referenced_ID is not null and is_schema_bound_reference =0 union --and insert the object itself Select object_ID(@DependenciesOf) end if @DependsOn is not null begin --does the user want a diagram of all the objects that the object depends on? insert into @ObjectsToDo --insert all the foreign key relationships Select parent_object_ID from sys.foreign_keys where referenced_Object_id=object_ID(@DependsOn) union all --and all the references this object makes Select referencing_ID from sys.sql_expression_dependencies where referenced_id=object_ID(@DependsOn) and is_schema_bound_reference =0 union Select object_ID(@DependsOn) --and add the object itself end Select @MyPlantUMLStatement='!define table(x) class x << (T,mistyrose) >> !define view(x) class x << (V,lightblue) >> !define table(x) class x << (T,mistyrose) >> !define tr(x) class x << (R,red) >> !define tf(x) class x << (F,darkorange) >> !define af(x) class x << (F,white) >> !define fn(x) class x << (F,plum) >> !define fs(x) class x << (F,tan) >> !define ft(x) class x << (F,wheat) >> !define if(x) class x << (F,gaisboro) >> !define p(x) class x << (P,indianred) >> !define pc(x) class x << (P,lemonshiffon) >> !define x(x) class x << (P,linen) >> hide methods hide stereotypes skinparam classarrowcolor gray ' /* firstly, we'll create all the UML table diagrams. */ SELECT @MyPlantUMLStatement = @MyPlantUMLStatement + 'table(' + Object_Schema_Name(allTables.object_id) + '.' + name + ') { ' + ( SELECT DISTINCT c.name + ': ' + t.name + CASE WHEN PrimaryKeyColumns.Object_ID IS NOT NULL THEN ' <<pk>>' ELSE '' END + CASE WHEN fk.parent_object_id IS NOT NULL THEN ' <<fk>>' ELSE '' END + ' ' FROM sys.columns AS c --give the column names and the data types but no dimensions INNER JOIN sys.types AS t ON c.user_type_id = t.user_type_id LEFT OUTER JOIN sys.foreign_key_columns AS fk ON parent_object_id = c.object_id AND parent_column_id = c.column_id LEFT OUTER JOIN --the primary keys are a bit awkward to get (SELECT i.object_id, column_id FROM sys.indexes AS i INNER JOIN sys.index_columns AS ic ON ic.object_id = i.object_id AND ic.index_id = i.index_id INNER JOIN sys.key_constraints AS k ON k.parent_object_id = ic.object_id AND i.index_id = k.unique_index_id WHERE ic.object_id = allTables.object_id AND k.type = 'pk' ) AS PrimaryKeyColumns(Object_ID, Column_ID) ON c.object_id = PrimaryKeyColumns.Object_ID AND c.column_id = PrimaryKeyColumns.Column_ID WHERE c.object_id = allTables.object_id FOR XML PATH(''), TYPE ).value(N'(./text())[1]', N'varchar(max)') /* so now we can add any triggers. We could do indexes as well but I somehow felt this wasn't appropriate*/ + Coalesce('__ trigger __ ' + (SELECT name + ' ' FROM sys.triggers WHERE parent_id = allTables.object_id FOR XML PATH(''), TYPE ).value('.', 'varchar(max)'), '') + '} ' FROM sys.tables AS allTables INNER JOIN @ObjectsToDo AS ObjectsToDo ON allTables.object_id = ObjectsToDo.Object_ID; /* now let's do the views */ SELECT @MyPlantUMLStatement = @MyPlantUMLStatement + 'view(' + Object_Schema_Name(allViews.object_id) + '.' + name + ') { ' + (SELECT c.name + ': ' + t.name + ' ' FROM sys.columns AS c INNER JOIN sys.types AS t ON c.user_type_id = t.user_type_id WHERE c.object_id = allViews.object_id FOR XML PATH(''), TYPE ).value(N'(./text())[1]', N'varchar(max)') + '} ' FROM sys.views AS allViews INNER JOIN @ObjectsToDo AS ObjectsToDo ON allViews.object_id = ObjectsToDo.Object_ID; /* now we do anything that is capable of having parameters */ SELECT @MyPlantUMLStatement = @MyPlantUMLStatement + RTrim(Lower(Allroutines.type)) + '(' + Object_Schema_Name(Allroutines.object_id) + '.' + Allroutines.name + ') { ' /* note, a routine can exist without a parameter */ + Coalesce( (SELECT p.name + ': ' + Type_Name(p.user_type_id) + ' ' FROM sys.objects AS o INNER JOIN sys.parameters AS p ON o.object_id = p.object_id WHERE o.object_id = Allroutines.object_id FOR XML PATH(''), TYPE ).value(N'(./text())[1]', N'varchar(max)'), '') + '} ' FROM sys.objects AS Allroutines INNER JOIN @ObjectsToDo AS ObjectsToDo ON Allroutines.object_id = ObjectsToDo.Object_ID AND type IN ('AF', 'FN', 'FS', 'FT', 'IF', 'P', 'PC', 'TF', 'X'); /* just the types that can have parameters */ /* and now that we have a class diagram for every object, we now do the arrows.*/ SELECT @MyPlantUMLStatement = @MyPlantUMLStatement + Coalesce( ( SELECT Coalesce(Object_Schema_Name(referencing_id) + '.', '') + Object_Name(referencing_id) + ' -|> ' + referenced_schema_name + '.' + referenced_entity_name + ':References ' --AS reference FROM sys.sql_expression_dependencies INNER JOIN @ObjectsToDo AS ObjectsToDo ON referencing_id = ObjectsToDo.Object_ID INNER JOIN @ObjectsToDo AS ObjectsToDo2 ON referenced_id = ObjectsToDo2.Object_ID WHERE is_schema_bound_reference = 0 FOR XML PATH(''), TYPE ).value(N'(./text())[1]', N'varchar(max)'), ''); SELECT @MyPlantUMLStatement = @MyPlantUMLStatement + Coalesce( ( SELECT Object_Schema_Name(parent_object_id) + '.' + Object_Name(parent_object_id) + ' -|> ' + Object_Schema_Name(referenced_object_id) + '.' + Object_Name(referenced_object_id) + ':FK ' FROM sys.foreign_keys INNER JOIN @ObjectsToDo AS ObjectsToDo ON parent_object_id = ObjectsToDo.Object_ID INNER JOIN @ObjectsToDo AS ObjectsToDo2 ON referenced_object_id = ObjectsToDo2.Object_ID FOR XML PATH(''), TYPE ).value(N'(./text())[1]', N'varchar(max)'), ''); go |
The Coda
Just to show that, with some care with the way that you do the arrows, you can get some very satisfactory effects.
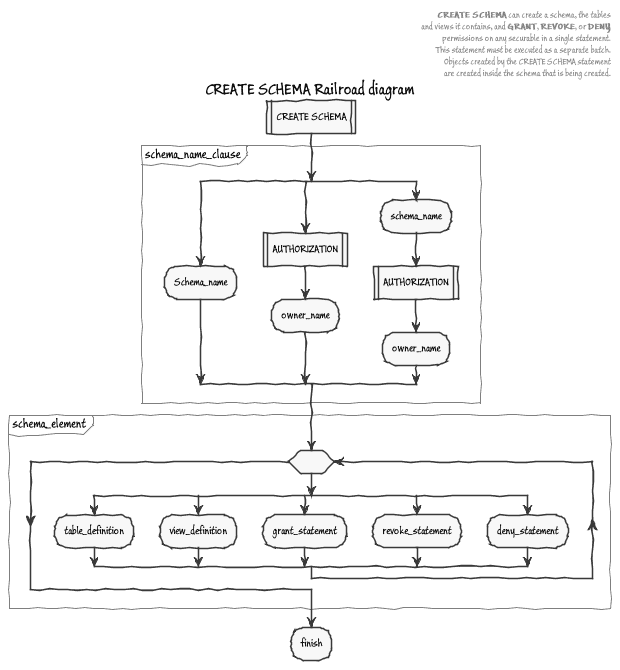
… and PlantUML can even do syntax railroad diagrams for SQL.


Load comments