
There comes a time with many Database Developers charged with doing management reports when the process of doing it properly gets very tedious. By ‘doing it properly’, I mean the ‘best practice’ of having to do the basic reporting in SQL and relying on a front-end application to do the presentation. This is particularly true where the management want simple aggregate reports, or ‘Pivot-table’ reports. Presentation is so closely tied with the data that splitting the process can sometimes lead to more problems than it solves. Of course, we have Reporting Services, Analysis Services and other external tools, but there are times when a simple solution based in TSQL has the upper hand.
Anyone who was weaned on Excel knows that these pivot tables are dead simple. You select your data, bang the button and with a bit of dragging and dropping, there it is. Why, they ask, is it so hard to get it out of the database? Why so hard to make changes?
What they want to see is something like this (using NorthWind so those stuck with SQL 2000 can join in)
No. Sales per year
| 1996 | 1997 | 1998 | Total | |
|---|---|---|---|---|
| Margaret Peacock | 31 | 81 | 44 | 156 |
| Janet Leverling | 18 | 71 | 38 | 127 |
| Nancy Davolio | 26 | 55 | 42 | 123 |
| Laura Callahan | 19 | 54 | 31 | 104 |
| Andrew Fuller | 16 | 41 | 39 | 96 |
| Robert King | 11 | 36 | 25 | 72 |
| Michael Suyama | 15 | 33 | 19 | 67 |
| Anne Dodsworth | 5 | 19 | 19 | 43 |
| Steven Buchanan | 11 | 18 | 13 | 42 |
| Sum | 152 | 408 | 270 | 830 |
Now, you’ll notice that we’ve taken a bit of trouble to add some formatting. In the average business, they’re fussy about such things as the alignment of numbers and the clear delineation of totals, and summary lines. It also is easier on the eye. It is therefore handy to format pivot table reports in HTML. We can send them via email them, straight from SQL Server, all in their correct formatting, or put the reports on an intranet and update them daily or hourly. With the contents of this workbench we show you how it is done, and how easy it is to do, all without a .NET programmer in sight!
However, first things first, we must first show you how to do a crosstab, or pivot table in Transact SQL
Crosstabs and Pivot tables
The basic code to do the report is pretty simple.
|
1 2 3 4 5 6 7 8 9 10 11 12 13 14 15 16 17 |
SELECT [No. Sales per year]=CASE WHEN row IS NULL THEN 'Sum' ELSE CONVERT(VARCHAR(80),[row]) END , [1996] =SUM( CASE col WHEN '1996' THEN data ELSE 0 END ), [1997] =SUM( CASE col WHEN '1997' THEN data ELSE 0 END ), [1998] =SUM( CASE col WHEN '1998' THEN data ELSE 0 END ), [Total]= SUM( data ) FROM (SELECT [row]=firstname+' '+lastname, [col]=YEAR(OrderDate), [data]=COUNT(*) FROM Employees INNER JOIN Orders ON (Employees.EmployeeID=Orders.EmployeeID) GROUP BY firstname+' '+lastname, YEAR(OrderDate) )f GROUP BY row WITH ROLLUP ORDER BY GROUPING(row),total DESC |
You’ll notice that the years are hard-coded into the column headings, which are a time bomb waiting to happen. You’ll also realize that the all-important formatting is missing. The structure of the query seems slightly more complicated than necessary, but you’ll see why soon. The PIVOT operator in SQL Server 2005 makes it rather easier but we wanted to make this relevant to the SQL Server 2000 users too
For any sort of portable solution that will work on SQL Server 2000, dynamic SQL is the traditional solution. Basically, the stored procedure generates the tedious code and then executes it. Why, one wonders. This is because there are a number of tweaks that have to be made, such as the order of the columns, and rows. After all, wouldn’t someone want the report ordered by the number of sales of the salesman rather than just alphabetic order? The same basic query may generate a lot of different aggregations. Pretty soon, some sort of automation will be required.
Keith Fletcher contributed to Simple-Talk the ingenious but complex stored procedure that did cross-tabs in his excellent article Creating cross tab queries and pivot tables in SQL. Because we were awed by its grandeur, we didn’t initially want to add our own contribution. However, we had two another objectives, firstly to show how easy the technique can be, and also because we wanted to do more, encouraging you to try things out, and secondly, because we wanted to show how one might mark up the presentation of the crosstab.
Here is a stored procedure that does the trick, along with some examples using NorthWind. (if you are stuck with SQL Server 2000, make the Varchar(MAX)s into Varchar(8000) and don’t be too ambitious with the complexity of your crosstabs!)
|
1 2 3 4 5 6 7 8 9 10 11 12 13 14 15 16 17 18 19 20 21 22 23 24 25 26 27 28 29 30 31 32 33 34 35 36 37 38 39 40 41 42 43 44 45 46 47 48 49 50 51 52 53 54 55 56 57 58 59 60 61 62 63 64 65 66 67 68 69 70 71 72 73 74 75 76 77 78 79 80 81 82 83 84 85 86 87 88 89 90 91 92 93 94 95 96 97 98 99 100 101 102 103 104 105 106 |
------------------------------------------------------------------------- CREATE PROCEDURE spDynamicCrossTab @RowValue VARCHAR(255), --what is the SQL for the row title @ColValue VARCHAR(255), --what is the SQL for the column title @Aggregate VARCHAR(255), --the aggregation value to go in the cells @FromExpression VARCHAR(8000), --the FROM, ON and WHERE clause @colOrderValue VARCHAR (255)=NULL, --how the columns are ordered @Title VARCHAR(80)='_', --the title to put in the first col of first row @SortBy VARCHAR(255)='row asc', --what you sort the rows by (column heading) @RowSort VARCHAR(80)=NULL, @ReturnTheDDL INT=0,--return the SQL code rather than execute it @Debugging INT=0 --debugging mode /* e.g. Execute spDynamicCrossTab @RowValue='firstname+'' ''+lastname', @ColValue='Year(OrderDate)', @Aggregate= 'count(*)', @FromExpression='FROM Employees INNER JOIN Orders ON (Employees.EmployeeID=Orders.EmployeeID)', @ColOrderValue='Year(OrderDate)', @Title ='No. Sales per year', @SortBy ='total desc' --what you sort the rows by (column heading) Execute spDynamicCrossTab @RowValue='firstname+'' ''+lastname', @ColValue='DATENAME(month,orderDate)', @Aggregate= 'sum(subtotal)', @FromExpression='FROM Orders INNER JOIN "Order Subtotals" ON Orders.OrderID = "Order Subtotals".OrderID inner join employees on employees.EmployeeID =orders.EmployeeID', @ColOrderValue='datepart(month,orderDate)', @Title ='Customers orders per month ' EXECUTE spDynamicCrossTab @RowValue='country', @ColValue='datename(quarter,orderdate) +case datepart(quarter,orderdate) when 1 then ''st'' when 2 then ''nd'' when 3 then ''rd'' when 4 then ''th'' end', @Aggregate= 'sum(subtotal)', @FromExpression='FROM Orders INNER JOIN "Order Subtotals" ON Orders.OrderID = "Order Subtotals".OrderID inner join customers on customers.customerID =orders.customerID', @ColOrderValue='datepart(quarter,orderDate)', @sortby='total desc', @Title ='value of orders per quarter' */ AS SET nocount ON DECLARE @Command NVARCHAR(MAX) DECLARE @SQL VARCHAR(MAX) --make sure we have sensible defaults for orders SELECT @ColOrderValue=COALESCE(@ColOrderValue, @ColValue), @Sortby=COALESCE(@SortBy,@RowValue), @rowsort=COALESCE(@RowSort,@RowValue) --first construct tha SQL which is used to calculate the columns in a --string SELECT @Command='select @SQL=coalesce(@SQL,''SELECT ['+@Title+']=case when row is null then ''''Sum'''' else convert(Varchar(80),[row]) end , '')+ ''[''+convert(varchar(100),' +@ColValue+')+''] =sum( CASE col WHEN ''''''+convert(varchar(100),' +@ColValue+')+'''''' THEN data else 0 END ), '' '+@FromExpression+' GROUP BY '+@ColValue+' order by max('+@ColorderValue+')' --Now we execute the string to obtain the SQL that we will use for the --crosstab query EXECUTE sp_ExecuteSQL @command,N'@SQL VARCHAR(MAX) OUTPUT',@SQL OUTPUT IF @@error > 0 --display the string if there is an error BEGIN RAISERROR ( 'offending code was ...%s', 0, 1, @command ) RETURN 1 END IF @debugging <>0 SELECT @Command --we now add the rest of the SQL into the string SELECT @SQL=@SQL+' [Total]= sum( data ) from (select [row]='+@RowValue+', [col]='+@ColValue+', [data]='+@Aggregate+', [sort]=max('+@rowsort+') '+@FromExpression+' GROUP BY '+@RowValue+', '+@ColValue+' )f group by row with rollup order by grouping(row),'+@Sortby --and execute it IF @ReturnTheDDL<>0 SELECT @SQL ELSE EXECUTE (@SQL) IF @@error > 0 BEGIN RAISERROR ( 'offending code was ...%s', 0, 1, @sql ) RETURN 1 END |
You’ll see that this is a developer’s tool. It is easy to crash the procedure by putting in bad SQL. SQL Injectors would love it. No sir, this is a back-office report-generating tool. Let’s try it out:
|
1 2 3 4 5 6 7 8 9 10 11 12 13 14 15 16 17 18 19 20 |
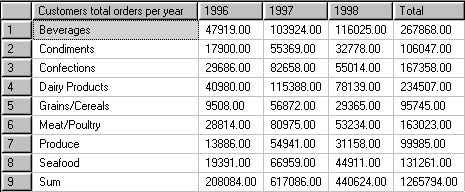
EXECUTE spDynamicCrossTab @RowValue='ProductName', @ColValue='Year(OrderDate)', @Aggregate= 'ROUND(SUM(CONVERT(decimal(14, 2), OD.Quantity * ( 1 - OD.Discount ) * OD.UnitPrice)),0)', @FromExpression='FROM [Order Details] OD, Orders O, Products P, Categories C where OD.OrderID = O.OrderID AND OD.ProductID = P.ProductID AND P.CategoryID = C.CategoryID', @Title ='Customers total orders per year' -- change the line... @RowValue='ProductName', -- ...to @RowValue='CategoryName', -- and see what happens! /*------------------------------------------------------------------- |
|
1 2 3 4 5 6 7 8 9 10 11 12 13 14 15 16 17 18 19 20 21 22 23 24 25 26 27 28 |
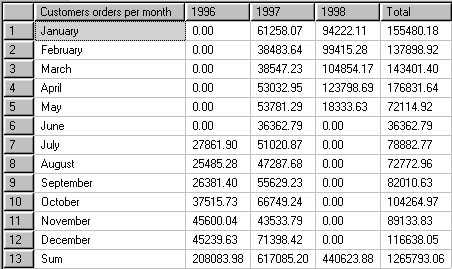
*/ -- -- add the row ... -- @SortBy ='total desc', --what you sort the rows by (column heading) -- before the @Title ='Customers total orders per year'-- Neat Huh? --now change -- @RowValue='CategoryName', -- @ColValue='Year(OrderDate)', --to -- @ColValue='CategoryName', -- @RowValue='Year(OrderDate)', --Instant Rotation! --Now try this, and notice how we get the columns and rows in the right order EXECUTE spDynamicCrossTab @colValue='DATENAME(year,orderDate)', @rowValue='DATENAME(month,orderDate)', @Aggregate= 'sum(subtotal)', @Rowsort='DATEpart(month,orderDate)', @FromExpression='FROM Orders INNER JOIN "Order Subtotals" ON Orders.OrderID = "Order Subtotals".OrderID inner join employees on employees.EmployeeID =orders.EmployeeID', @ColOrderValue='datepart(year,orderDate)', @Title ='Customers orders per month ', @sortby='max(sort) asc' /*------------------------------------------------------------------- |
HTML Crosstabs
Why bother with this when the Internet abounds with such Cross tab or pivot-table procedures? This is because we are going to take it one stage further so that, instead of just producing a resultset, we want to show how to produce HTML to produce the chart like the one at the beginning of the article.
To reproduce this…
value of orders per quarter
| 1st | 2nd | 3rd | 4th | Total | |
|---|---|---|---|---|---|
| USA | $81364.94 | $50525.40 | $58047.56 | $55646.73 | $245584.63 |
| Germany | $66823.20 | $64681.22 | $42550.91 | $56229.29 | $230284.62 |
| Austria | $32357.82 | $37346.79 | $17383.60 | $40915.63 | $128003.84 |
| Brazil | $47027.15 | $12127.25 | $22537.77 | $25233.60 | $106925.77 |
| France | $31085.27 | $11225.97 | $14407.11 | $24639.96 | $81358.31 |
| UK | $21302.05 | $17061.85 | $2292.70 | $18314.72 | $58971.32 |
| Venezuela | $21186.40 | $11991.60 | $12098.75 | $11533.89 | $56810.64 |
| Sweden | $13627.62 | $18234.86 | $8718.31 | $13914.35 | $54495.14 |
| Canada | $22746.94 | $7094.48 | $9225.70 | $11129.18 | $50196.30 |
| Ireland | $20500.54 | $8291.50 | $11376.50 | $9811.36 | $49979.90 |
| Belgium | $19410.67 | $3728.48 | $7740.70 | $2945.00 | $33824.85 |
| Denmark | $17049.90 | $2007.79 | $2127.25 | $11476.08 | $32661.02 |
| Switzerland | $4454.02 | $10928.70 | $7714.06 | $8595.88 | $31692.66 |
| Mexico | $3938.00 | $12432.71 | $4616.17 | $2595.20 | $23582.08 |
| Finland | $5532.80 | $5791.20 | $2884.41 | $4601.64 | $18810.05 |
| Spain | $7329.30 | $1875.80 | $4633.25 | $4144.85 | $17983.20 |
| Italy | $7082.09 | $2836.10 | $2484.37 | $3367.60 | $15770.16 |
| Portugal | $3335.79 | $4311.20 | $1519.24 | $2306.14 | $11472.37 |
| Argentina | $6684.10 | $716.50 | $0.00 | $718.50 | $8119.10 |
| Norway | $3354.40 | $822.35 | $500.00 | $1058.40 | $5735.15 |
| Poland | $587.50 | $1277.60 | $808.00 | $858.85 | $3531.95 |
| Sum | $436780.50 | $285309.35 | $233666.36 | $310036.85 | $1265793.06 |
…We need code like this (the first example in the body of the code was used to generate this Pivot-table)…
|
1 2 3 4 5 6 7 8 9 10 11 12 13 14 15 16 17 18 19 20 21 22 23 24 25 26 27 28 29 30 31 32 33 34 35 36 37 38 39 40 41 42 43 44 45 46 47 48 49 50 51 52 53 54 55 56 57 58 59 60 61 62 63 64 65 66 67 68 69 70 71 72 73 74 75 76 77 78 79 80 81 82 83 84 85 86 87 88 89 90 91 92 93 94 95 96 97 98 99 100 101 102 103 104 105 106 107 108 109 110 111 112 113 114 115 116 117 118 119 120 121 122 123 124 125 126 127 128 129 130 131 132 133 134 135 136 137 138 139 140 141 142 143 144 145 146 147 148 149 150 151 152 153 154 155 156 157 158 159 160 161 162 163 164 165 166 167 168 169 170 171 172 173 |
------------------------------------------------------------------------- CREATE PROCEDURE spDynamicHTMLCrossTab @RowValue VARCHAR(255), --what is the row header @ColValue VARCHAR(255), --what is the column header @Aggregate VARCHAR(255), --the aggregation value @FromExpression VARCHAR(8000), --the FROM, ON and WHERE clause @colOrderValue VARCHAR (255)=NULL, --how the columns are ordered @Title VARCHAR(80)='_', --the title to put in the first col of first row @RowSort VARCHAR(80)=NULL,--any special way the rows should be sorted @SortBy VARCHAR(255)='row asc', --what you sort the rows by (column heading) @UnitBefore VARCHAR(10)='',--the unit that each value has before (e.g. £ or $) @UnitAfter VARCHAR(10)='',--The unit that each value has after e.g. % @ReturnTheDDL INT=0,--we return just the DLL @Debugging INT=0,--we look at the intermediate code @output VARCHAR(MAX) ='none' output, @style VARCHAR(MAX)='<style type="text/css"> /*<![CDATA[*/ <!-- #MyCrosstab { font-family: Arial, Helvetica, sans-serif; font-size:small; } #MyCrosstab td{font-size:small; padding: 3px 10px 2px 10px; } #MyCrosstab td.number{ text-align: right; } #MyCrosstab td.rowhead{ border-right: 1px dotted #828282; font-weight: bold;} #MyCrosstab th{ font-size:small; border-bottom: 1px dotted #828282; text-align: center; } #MyCrosstab .sum{ border-top: 2px solid #828282; } #MyCrosstab .sumrow{ text-align: right } #MyCrosstab .total{ border-left: 1px solid #828282; } --> /*]]>*/ </style> ' /* Declare @HTMLString varchar(max) EXECUTE spDynamicHTMLCrossTab @RowValue='CompanyName', @ColValue='datename(quarter,orderdate) +case datepart(quarter,orderdate) when 1 then ''st'' when 2 then ''nd'' when 3 then ''rd'' when 4 then ''th'' end', @Aggregate= 'sum(subtotal)', @FromExpression='FROM Orders INNER JOIN "Order Subtotals" ON Orders.OrderID = "Order Subtotals".OrderID inner join customers on customers.customerID =orders.customerID', @ColOrderValue='datepart(quarter,orderDate)', @Unitbefore='$', @sortby='total desc', @Title ='value of orders per quarter', @Output=@HTMLString output Select @HTMLString Execute spDynamicHTMLCrossTab @RowValue='firstname+'' ''+lastname', @ColValue='DATENAME(year,orderDate)', @Aggregate= 'sum(subtotal)', @FromExpression='FROM Orders INNER JOIN "Order Subtotals" ON Orders.OrderID = "Order Subtotals".OrderID inner join employees on employees.EmployeeID =orders.EmployeeID', @ColOrderValue='datepart(year,orderDate)', @Unitbefore='$', @sortby='total desc', @Title ='Revenue per salesman per year ' Execute spDynamicHTMLCrossTab @RowValue='firstname+'' ''+lastname', @ColValue='Year(OrderDate)', @Aggregate= 'count(*)', @FromExpression='FROM Employees INNER JOIN Orders ON (Employees.EmployeeID=Orders.EmployeeID)', @ColOrderValue='Year(OrderDate)', @Title ='No. Sales per year', @SortBy ='total desc', --what you sort the rows by (column heading) @ReturnTheDDL =0, @debugging=0 */ AS SET nocount ON DECLARE @Command NVARCHAR(MAX) DECLARE @DataRows VARCHAR(MAX) DECLARE @HeadingLines VARCHAR(8000) --make sure we have sensible defaults for orders SELECT @ColOrderValue=COALESCE(@ColOrderValue, @ColValue), @rowsort=COALESCE(@RowSort,@RowValue), @Sortby=COALESCE(@SortBy,@RowValue) --first construct tha SQL which is used to calculate the columns in a --string DECLARE @StringTable TABLE ( MyID INT IDENTITY(1, 1), string VARCHAR(8000), waste numeric(19,8) ) SELECT @Command='Select @Headinglines=coalesce(@headinglines,''<div id="MyCrosstab"> <h3>'+@title+'</h3> <table cellpadding="0" cellspacing="0"> <thead> <tr class="header"><th> </th>'')+''<th>'' +convert(varchar(100),' +@ColValue+') +''</th>'', @DataRows=coalesce(@DataRows, ''SELECT [string]=''''<tr> <td class="rowhead'''' + case when grouping(row)<>0 then'''' sumrow'''' else '''''''' end +''''">''''+convert(varchar(100),case when row is null then ''''Sum'''' else [row] end)+''''</td> '') +''<td class="'''' + case when grouping(row)<>0 then''''sum'''' else '''''''' end +'''' number">''''+'''''+@unitBefore+'''''+convert(varchar(100),sum( CASE col WHEN '''''' +convert(varchar(100),' +@ColValue+') +'''''' THEN data else 0 END ))++'''''+@unitAfter+'''''+''''</td> '' '+@FromExpression+' GROUP BY '+@ColValue+' order by max('+@ColorderValue+')' --Now we execute the string to obtain the SQL that we will use for the --crosstab query EXECUTE sp_ExecuteSQL @command,N'@DataRows VARCHAR(MAX) OUTPUT, @Headinglines VARCHAR(MAX) OUTPUT', @DataRows output,@Headinglines OUTPUT IF @@error > 0 --display the string if there is an error BEGIN RAISERROR ( 'offending first-phase code was ...%s', 0, 1, @command ) RETURN 1 END IF @Debugging <>0 SELECT @Command INSERT INTO @StringTable(string) SELECT @Style INSERT INTO @StringTable(string) SELECT @Headinglines+'<th>Total</th></tr> </thead> <tbody>' SELECT @DataRows= @DataRows+'<td class="'' + case when grouping(row)<>0 then''sum'' else '''' end+'' number total">'' +'''+@unitBefore+'''+convert(varchar(100),sum( data ))+'''+@unitAfter +'''+''</td></tr>'', [total]=convert(numeric(19,8),sum( data )) from (select [row]='+@RowValue+', [col]='+@ColValue+', [data]='+@Aggregate+', [sort]=max('+@rowsort+') '+@FromExpression+' GROUP BY '+@RowValue+', '+@ColValue+' )f group by row with rollup order by grouping(row),'+@Sortby --and execute it IF @ReturnTheDDL<>0 SELECT @DataRows ELSE INSERT INTO @StringTable(string,waste) EXECUTE (@DataRows) IF @@error > 0 BEGIN RAISERROR ( 'offending second-phase code was ...%s', 0, 1, @DataRows ) RETURN 1 END INSERT INTO @StringTable(string) SELECT '</tbody></table></div>' IF @Output='none' SELECT string FROM @StringTable ORDER BY MyID ELSE SELECT @Output=COALESCE(@Output,'')+ string FROM @StringTable ORDER BY MyID |
(n.b this is the SQL Server 2005 version. The SQL Server 2000 version is included with the files you can download at the bottom of the article)
You will have noticed a few things here.
- The inputs are the same as the first stored procedure, spDynamicCrossTab. This means that you can try out your parameters in SSMS until you have things the way you want them and then you can just move to spDynamicHTMLCrossTab to concentrate on getting the presentation aspects as you want.
- We have separated the style from the code. All presentation is in an inline style block. This means you can change the way the crosstab looks to your heart’s content.
- with both stored procedures, you can specify the order of both the columns and rows precisely (it is always nice to have the months, or the days of the week in the correct order!
- you can specify the units, either before(e.g. ‘£’ or ‘$’) or after (e.g ‘%’) the aggregate values
- We provide you with an optional output variable so you can take the results and save it easily to a file, using the technique Phil described in his Blog ‘Using BCP to export the contents of MAX datatypes to a file’
You can change the appearance of the crosstab simply by changing the inline style. For example, this …
|
1 2 3 4 5 6 7 8 9 10 11 12 13 14 15 16 17 18 19 20 21 22 23 24 25 |
EXECUTE spDynamicHTMLCrossTab @RowValue='firstname+'' ''+lastname', @ColValue='Year(OrderDate)', @Aggregate= 'count(*)', @FromExpression='FROM Employees INNER JOIN Orders ON (Employees.EmployeeID=Orders.EmployeeID)', @ColOrderValue='Year(OrderDate)', @Title ='No. Sales per year', @SortBy ='total desc', --what you sort the rows by (column heading) @Style='<style type="text/css"> /*<![CDATA[*/ <!-- #MyCrosstab { font-family: "Times New Roman", Times, serif; font-size:small; } #MyCrosstab td{font-size:small; padding: 3px 10px 2px 10px; } #MyCrosstab td.number{ text-align: right; } #MyCrosstab td.rowhead{ background-color: #C5DC9C; font-weight: bold;} #MyCrosstab th{ background-color: #C5DC9C; font-size: small; border-bottom: text-align: center; } #MyCrosstab .sum{ border-top: 3px double #828282; } #MyCrosstab .sumrow{ border-top: 1px solid #828282; text-align: right } #MyCrosstab .total{ border-left: 1px solid #828282; } --> /*]]>*/ </style>' |
… will give you this
No. Sales per year
| 1996 | 1997 | 1998 | Total | |
|---|---|---|---|---|
| Margaret Peacock | 31 | 81 | 44 | 156 |
| Janet Leverling | 18 | 71 | 38 | 127 |
| Nancy Davolio | 26 | 55 | 42 | 123 |
| Laura Callahan | 19 | 54 | 31 | 104 |
| Andrew Fuller | 16 | 41 | 39 | 96 |
| Robert King | 11 | 36 | 25 | 72 |
| Michael Suyama | 15 | 33 | 19 | 67 |
| Anne Dodsworth | 5 | 19 | 19 | 43 |
| Steven Buchanan | 11 | 18 | 13 | 42 |
| Sum | 152 | 408 | 270 | 830 |
Lastly, although there is a lot more one can say about these procedures and the tricks one can use, especially with the CSS, here is an illustration of the way one might save the results of your crosstab to an HTML file for your management reporting intranet site. This uses Phil’s technique taken from his blog entry Using BCP to export the contents of MAX datatypes to a file (Phil: Thanks for the plug, Robyn!)
|
1 2 3 4 5 6 7 8 9 10 11 12 13 14 15 16 17 18 19 20 21 22 |
DECLARE @HTMLString VARCHAR(MAX) EXECUTE spDynamicHTMLCrossTab @colValue='DATENAME(year,orderDate)', @rowValue='DATENAME(month,orderDate)', @Aggregate= 'sum(subtotal)', @Rowsort='DATEpart(month,orderDate)', @FromExpression='FROM Orders INNER JOIN "Order Subtotals" ON Orders.OrderID = "Order Subtotals".OrderID inner join employees on employees.EmployeeID =orders.EmployeeID', @ColOrderValue='datepart(year,orderDate)', @Title ='Customers orders per month ', @sortby='max(sort) asc', @Output=@HTMLString output SELECT @HTMLString= '<!DOCTYPE HTML PUBLIC "-//W3C//DTD HTML 4.01 Transitional//EN" "http://www.w3.org/TR/html4/loose.dtd"> <html> <head><title>Customers orders per month</title></head> <body>'+@HTMLString+'</body>' EXECUTE spSaveTextToFile @HTMLString, 'C:\MyHTMLReport.html' |
So that’s it. We’ve enjoyed ourselves trying things out, and we’ve been surprised how far we can take the dynamic creation of pivot tables. We suggest you take the workshop and explore the ideas. If you discover anything interesting, we’d love to hear your comments! We’d particularly like to hear of interesting CSS layouts, though displaying them on Simple-Talk will be very difficult.
This document contains proprietary information and is protected by copyright law.
Copyright © 2026 Red Gate Software Limited. All rights reserved


Load comments