


Synchronous replicas in SQL Server Availability Groups promise no data loss, but they don’t promise zero delay; under heavy load they can still fall behind. To measure replication latency between synchronous replicas in SQL Server AlwaysOn Availability Groups, monitor two performance counters: Mirrored Write Transactions/sec and Transaction Delay.
These counters reveal how much time each transaction spends waiting for the secondary to acknowledge receipt – even in synchronous mode, latency accumulates under heavy I/O workloads like index rebuilds or bulk data loads. This article shows how to capture these counters over time, calculate effective replication delay, and use the data to schedule maintenance operations safely.
Why Measure Latency?
Availability Groups are useful for creating Highly Available (HA) database systems, but that doesn’t mean they are entirely immune to performance problems. In busy systems, limitations in the infrastructure can introduce replication lag that is severe enough to affect database performance in ways that aren’t immediately obvious.
In SQL Server Availability Groups, the relevant difference between synchronous and asynchronous replicas comes down to how and when a transaction on the primary server is considered “committed”: Although it is easy to measure the lag between asynchronous replicas by using the dashboard in SSMS or by querying the DMVs (Dynamic Management Views), it takes more work to find the latency between synchronous replicas. This article explains how to measure that latency using internal performance counters, offering a simple technique for monitoring the cost of synchronous replication.
The Effect of Stress on a Synchronous Replica
You might think that there would be no delay in committing the transaction on the primary only after it is safely on the secondary – after all it is supposed to be synchronous. However, if you work with a busy server using AlwaysOn including synchronous replicas, you may have seen high numbers of HADR_SYNC_COMMIT waits, especially during IO-intensive operations such as index rebuilds or data loads. This type of wait means ‘Your synchronous replica can’t keep up!’
By understanding why this happens, we can learn about the nature of the bottlenecks in our infrastructure and throttle or reschedule operations to reduce the risk of replication latency.
Read also: In-memory optimized tables for high-throughput workloads
Understanding the Counters
Our first (but not last!) step in understanding counters should be the documentation, so let’s take a look at https://learn.microsoft.com/en-us/sql/relational-databases/performance-monitor/sql-server-database-replica.
The two metrics that we will use are Mirrored Write Transaction/sec and Transaction Delay. Let’s see what the documents say:


Read also: Temporary tables and tempdb performance in SQL Server
Mirrored Write Transaction/sec
With these metrics, we can start by seeing what Mirrored Write Transaction/sec looks like on a system with no traffic. For this I will use the sys.dm_os_performance_counters dynamic management view (DMV) that lets you see the OS performance counters that SQL Server is presenting to the OS performance monitor.
|
1 2 3 4 5 6 7 8 9 |
SELECT instance_name ,CAST(cntr_value AS BIGINT) counter_value ,counter_name FROM sys.dm_os_performance_counters perf WHERE object_name LIKE 'SQLServer:Database Replica%' AND perf.counter_name LIKE 'Mirrored Write Transactions/sec%' AND instance_name = '_Total'; |
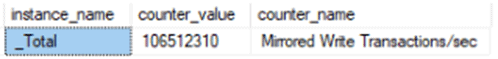
When you execute this statement, it returns:
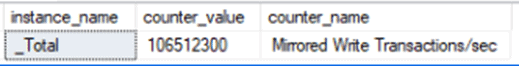
If the documentation is to be taken literally, this means that our offline system had 106,512,300 transactions in the last second – quite the load if you believe that number! If we wait about a minute and execute the query again on our system, the result shows a very similar number – 106,512,310. Too similar if you ask me! This smells like a tally rather than a metric: maybe a tally of how much time the server has spent waiting on synchronous replicas. We need to investigate.
By running this query several times, it becomes apparent that the counter actually tracks a cumulative number of transactions since the last reboot or counter reset, rather than reflecting activity within the last second.
With this understanding, we can rewrite the Microsoft definition:
Mirrored Write Transaction/sec: Number of transactions that were written to the primary database and then waited to commit until the log was sent to the secondary database, since the last reboot.
Transaction Delay
Thankfully, Transaction Delay does exactly what it says on the tin. The tin also helpfully notes that we can divide this value by the Mirrored Write Transactions/sec counter to get an average delay per transaction.
Dividing these counters will give us the average latency since the last reboot but this, by itself, is not particularly useful in this context. We are more likely to need to know how closely the latency relates to various types of server load.
Despite the /sec suffix, most of these counters are actually just cumulative tallies. You have to do your own math if you want the actual per-second rate.
Fast, reliable and consistent SQL Server development…
Storing the Counters
If we store these values over time, we can then calculate a minute-by-minute metric that is far more useful for understanding the speed and robustness of a system. To do this we will create a table to track these counters and a stored procedure to write to that table at a regular cadence.
Let’s start by creating a table to hold our observations:
|
1 2 3 4 5 6 7 8 9 |
IF (SELECT object_id('dbo.AGLagObservations')) IS NULL CREATE TABLE dbo.AGLagObservations ( id INT IDENTITY(1,1) ,instance_name SYSNAME ,trancount BIGINT ,totaldelayMS BIGINT ,ts DATETIME2(7) DEFAULT (getdate()) ) |
Since these counters are stored in the same column in sys.dm_os_performance_counters, our procedure will use a temp table to pivot them into separate columns, making further analysis easier.
|
1 2 3 4 5 6 7 8 9 10 11 12 13 14 15 16 17 18 19 20 21 22 23 24 25 26 27 28 29 30 31 32 33 34 35 36 37 38 |
CREATE OR ALTER PROC dbo.CreateAGLagObservation AS BEGIN CREATE TABLE #t ( instance_name SYSNAME ,counter_value BIGINT ,counter_name SYSNAME ) --Fetch all the counters we want into one temp table INSERT INTO #t (instance_name,counter_value,counter_name) SELECT instance_name ,CAST(cntr_value AS BIGINT) counter_value ,counter_name FROM sys.dm_os_performance_counters perf WHERE object_name LIKE 'SQLServer:Database Replica%' AND (perf.counter_name LIKE 'Mirrored Write Transactions/sec%' OR perf.counter_name LIKE 'Transaction Delay%') --Join the temp table to itself to flatten the two --counters into one row INSERT INTO dbo.AGLagObservations (instance_name, trancount,totaldelayMS) SELECT t1.instance_name ,t1.counter_value ,t2.counter_value FROM #t t1 --'Mirrored Write Transactions/sec%' JOIN #t t2 --'Transaction Delay%' ON t1.instance_name = t2.instance_name AND t1.counter_name LIKE 'Mirrored Write Transactions/sec%' AND t2.counter_name LIKE 'Transaction Delay%'; END GO |
Now we can start a loop to gather our data. This code can be placed in a SQL Agent Job or just kicked off from SSMS:
|
1 2 3 4 5 6 7 8 9 10 |
DECLARE @stop_time_local DATETIME2(7) = GETDATE() + 1 , @time_delay VARCHAR(10) = '00:01:00' , @now DATETIME2(7) = GETDATE() WHILE @now < @stop_time_local BEGIN EXEC dbo.CreateAGLagObservation SELECT @now = GETDATE() WAITFOR DELAY @TIME_DELAY END |
You could also just use a job that runs every minute or so to execute: EXEC dbo.CreateAGLagObservation, depending on your infrastructure.
Analyzing Latency Trends Over Time
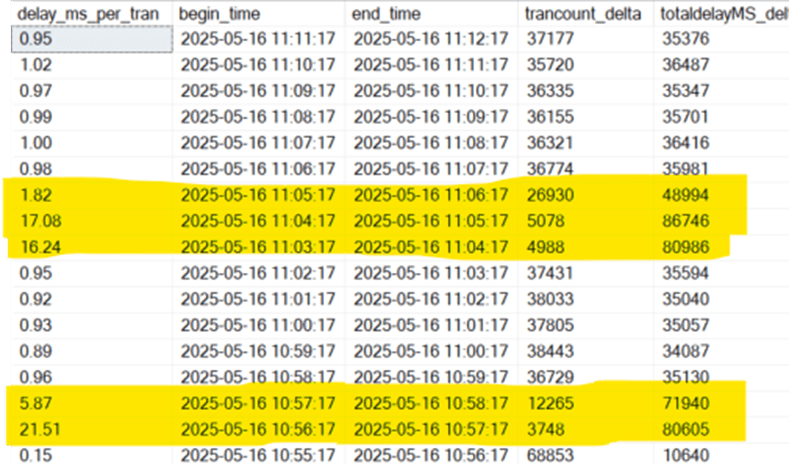
After the script has been running for a few minutes, we can calculate and view the lag from the observations we have captured. This code uses a CTE to compare each row with the row captured before it to show how much each counter changed in the last minute. Then it divides those delta values to show the average delay per transaction in that minute (delay_ms_per_tran). I’m filtering on instance_name here to show the total for all databases, but I have left this unfiltered in the stored procedure to allow tracking the latency for each database independently.
|
1 2 3 4 5 6 7 8 9 10 11 12 13 14 15 16 17 18 19 20 21 22 23 24 25 26 27 28 29 30 31 32 33 34 |
;WITH a AS ( SELECT begin_time = lag(CAST( ts AS DATETIME2(0))) OVER (PARTITION BY instance_name ORDER BY id ) ,end_time = CAST( ts AS DATETIME2(0)) ,instance_name ,id ,trancount_delta = trancount - lag (trancount) OVER (PARTITION BY instance_name ORDER BY id ) ,totaldelayMS_delta = totaldelayMS - lag (totaldelayMS) OVER (PARTITION BY instance_name ORDER BY id ) FROM dbo.AGLagObservations ) SELECT TOP 100 CAST( CASE WHEN trancount_delta > 0 THEN totaldelayMS_delta * 1.0 /trancount_delta ELSE 0 END AS NUMERIC(19,2)) AS delay_ms_per_tran ,begin_time ,end_time ,trancount_delta ,totaldelayMS_delta FROM a WHERE instance_name = '_Total' ORDER BY id DESC |
To show why this can be so useful, I ran these scripts on a testing system with an insert statement running in a loop. To generate a more intensive load and stress the system, I rebuilt some indexes and highlighted those times in the screenshot below. You can clearly see how the index rebuilds affected the latency of the synchronous replication, going from sub-millisecond lag to over 20 milliseconds:
Summary
We’ve shown how to measure the latency between synchronous replicas in an Availability Group using SQL Server’s own counters. While synchronous commit promises no data loss, it doesn’t guarantee no delay — and under load, the cost of keeping replicas in sync can be significant. Measuring that cost gives us a way to observe how well the infrastructure is coping, especially during IO-intensive operations like index maintenance or data imports.
Used over time, this technique can help to explain unexpected slowdowns, validate assumptions about AlwaysOn performance, and provide a solid basis for scheduling background tasks more safely. It’s also a gentle reminder that a “healthy” secondary replica isn’t just one that’s connected — it’s one that’s keeping up.
This kind of monitoring doesn’t just help DBAs troubleshoot issues after the fact; it can inform operational planning, change management, and the safe deployment of maintenance routines. Replication performance is part of system health, and this gives us a practical way to track it.
FAQs: How to measure replication latency in SQL Server AlwaysOn
1. How do you check replication lag in SQL Server AlwaysOn?
For asynchronous replicas, use the AlwaysOn dashboard in SSMS or query the sys.dm_hadr_database_replica_states DMV to see the log_send_queue_size and redo_queue_size. For synchronous replicas, standard DMVs won’t show meaningful lag. Instead, monitor the Mirrored Write Transactions/sec and Transaction Delay performance counters, which reveal the per-transaction cost of keeping synchronous replicas in sync.
2. What causes HADR_SYNC_COMMIT waits in SQL Server?
HADR_SYNC_COMMIT waits occur when the primary replica is waiting for the synchronous secondary to acknowledge that a transaction’s log records have been hardened to disk. High wait times typically indicate I/O bottlenecks on the secondary, network latency between replicas, or heavy concurrent workloads like index rebuilds overwhelming the secondary’s write throughput.
3. Does synchronous replication in SQL Server AlwaysOn guarantee zero latency?
No. Synchronous replication guarantees zero data loss (no committed transactions are lost on failover), but it does not guarantee zero delay. Every transaction on the primary must wait for the secondary to acknowledge receipt before committing. Under heavy I/O load, this delay can reach tens of milliseconds, adding up significantly over thousands of transactions.


Load comments