
Top 1000 Most Used Queries for the DBA
On a recent slow Friday afternoon I was practicing my Origami skills with approved expense reports and consolidating hundreds of queries that I’d collected over the past 10 years as a DBA. I was suddenly struck with what I thought was a good idea: why not put my most-used DBA queries on one of my Red-Gate thumb drives so as to have them always available? Because of the imminent deadline of a presentation for an upcoming SQL Server Users group meeting, I figured I would then share these queries with other SQL souls. Excitedly, I set about creating the DBA script thumb for the presentation. I dubbed it the “Green Thumb”, subtitled the “Top 1000 Most Used Queries for the DBA”.


I was left with a slight uneasiness. Could it be that the task of trudging through 1000 queries in would be impossible to do in a one-hour presentation? Was it possible to describe one every four seconds? No. So I narrowed it down to five. Of the five that I will present here, some can be demonstrated in less than one minute, others may take a bit longer. These are queries that DBAs may stumble upon in their course of their careers, and find that they are useful enough to pass on to others. So here are the 1000 queries, now reduced by 995, that I either:
- Developed
- Enhanced
- Use daily
- All of the above.
These five queries were designed to:
- Instantly find sizes of all databases on your servers (for the inquisitive server administrator)
- List the last good database backups
- Query a trace file with SQL
- Read error logs with T-SQL – not the error log viewer
- GO more than once
Database Sizes
The first query is one that I created from scratch, when I needed to monitor the space on a server, whether transaction logs or data files. This query will display all the information you immediately need and works for all versions of SQL from 2000 onwards. I have used this query to quickly ascertain which log files have grown to the point of eating most of the disk drive, and so must be reined in. This event is easily avoided, and so is very embarrassing to the DBA when it happens; but it does happen more often that I would like to admit.
The query uses the xp_fixeddrives and sp_MSForEachDB stored procedures to populate and query temp tables. Listing 1 shows the full query (prettified with RedGate Refactor’s “Layout SQL” function):
Listing 1
|
1 2 3 4 5 6 7 8 9 10 11 12 13 14 15 16 17 18 19 20 21 22 23 24 25 26 27 28 29 30 31 32 33 34 35 36 37 38 39 40 41 42 43 44 45 46 47 48 49 50 51 52 53 54 55 56 57 58 59 60 61 62 63 64 65 66 67 68 69 70 71 72 |
Set NoCount On --Check to see the temp table exists IF EXISTS ( SELECT Name FROM tempdb..sysobjects Where name like '#HoldforEachDB%' ) --If So Drop it DROP TABLE #HoldforEachDB_size --Recreate it CREATE TABLE #HoldforEachDB_size ( [DatabaseName] [nvarchar](75) COLLATE SQL_Latin1_General_CP1_CI_AS NOT NULL, [Size] [decimal] NOT NULL, [Name] [nvarchar](75) COLLATE SQL_Latin1_General_CP1_CI_AS NOT NULL, [Filename] [nvarchar](90) COLLATE SQL_Latin1_General_CP1_CI_AS NOT NULL, ) ON [PRIMARY] IF EXISTS ( SELECT name FROM tempdb..sysobjects Where name like '#fixed_drives%' ) --If So Drop it DROP TABLE #fixed_drives --Recreate it CREATE TABLE #fixed_drives ( [Drive] [char](1) COLLATE SQL_Latin1_General_CP1_CI_AS NOT NULL, [MBFree] [decimal] NOT NULL ) ON [PRIMARY] --Insert rows from sp_MSForEachDB into temp table INSERT INTO #HoldforEachDB_size EXEC sp_MSforeachdb 'Select ''?'' as DatabaseName, Case When [?]..sysfiles.size * 8 / 1024 = 0 Then 1 Else [?]..sysfiles.size * 8 / 1024 End AS size,[?]..sysfiles.name, [?]..sysfiles.filename From [?]..sysfiles' --Select all rows from temp table (the temp table will auto delete when the connection is gone. INSERT INTO #fixed_drives EXEC xp_fixeddrives Select @@Servername print '' ; Select rtrim(Cast(DatabaseName as varchar(75))) as DatabaseName, Drive, Filename, Cast(Size as int) AS Size, Cast(MBFree as varchar(10)) as MB_Free from #HoldforEachDB_size INNER JOIN #fixed_drives ON LEFT(#HoldforEachDB_size.Filename, 1) = #fixed_drives.Drive GROUP BY DatabaseName, Drive, MBFree, Filename, Cast(Size as int) ORDER BY Drive, Size Desc print '' ; Select Drive as [Total Data Space Used |], Cast(Sum(Size) as varchar(10)) as [Total Size], Cast(MBFree as varchar(10)) as MB_Free from #HoldforEachDB_size INNER JOIN #fixed_drives ON LEFT(#HoldforEachDB_size.Filename, 1) = #fixed_drives.Drive Group by Drive, MBFree print '' ; Select count(Distinct rtrim(Cast(DatabaseName as varchar(75)))) as Database_Count from #HoldforEachDB_size |
Figure 1 shows the output of the query, with the multiple result sets that provide an at-a-glance view of how much free space is available on the disk, and how much space is taken by all of the SQL database files on each drive:
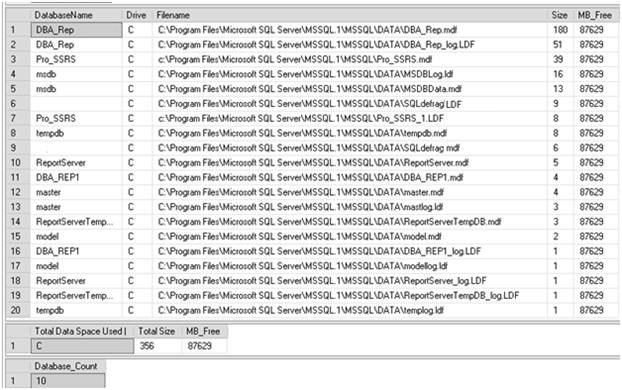
Figure 1: Investigating the space used by each SQL database file on my laptop
As you can see, there is no worry of running out of space on my laptop SQL Server, where this was run. However, if you discover (as I have, on occasion) that the MB_Free field is in double digits, then it is time to take some action.
Last Good Database Backups
Whether you use a third-party backup tool to backup your databases and log files, or you choose to use native SQL backups, the MSDB database that stores backup history can provide a wealth of information to you, as the DBA responsible for your company’s data. As the DBA, you may be managing over 100 SQL instances using standard backup scripts, so it is tempting to assume (or pray) that all backups are working successfully. Of course, if a backup fails you’d typically receive an alert via e-mail. However, Development and QA systems are not as stringently monitored as production.
I quite often use the simple query shown in Listing 2 to interrogate the MSDB database, searching for databases that have not been backed up, either in the past x number of days or ever. Jaws drop when the latter shows up, but you would be surprised what you may find. This query will not only inform you what has and has not been backed up, but will also tell you what type of backup has been performed, full database (D), transaction log(L) or differential(I).
Listing 2
|
1 2 3 4 5 6 7 8 9 10 11 |
SELECT sd.name, bs.TYPE, bs.database_name, max(bs.backup_start_date) as last_backup FROM master..sysdatabases sd Left outer join msdb..backupset bs on rtrim(bs.database_name) = rtrim(sd.name) left outer JOIN msdb..backupmediafamily bmf ON bs.media_set_id = bmf.media_set_id Group by sd.name, bs.TYPE, bs.database_name Order by sd.name,last_backup |
The output of the query from Listing 2 can be seen in Figure 2, where there are obviously several databases that have not been backed up, as indicated by a NULL value in the last_backup column. This is not something a DBA would want to see, especially when master and msdb are included in the list of databases not backed up:
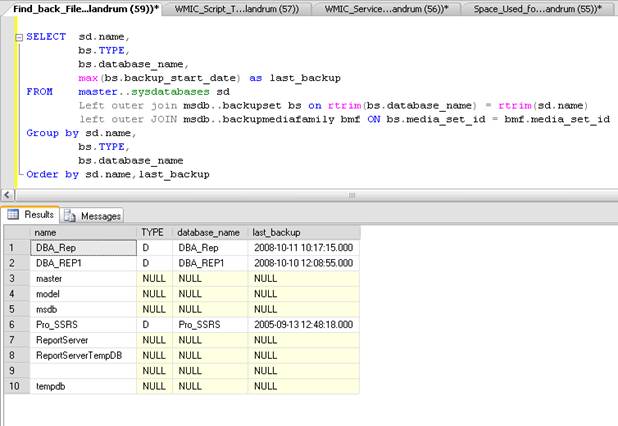
Figure 2: Finding the last good backup.
This query can also be easily modified to exclude TempDB, which never gets backed up, and to show any “missed” log backups. For example, with the query shown in Listing 3, it is possible to query a single database (in this case, the DBA_Info database) to see the full backups and log backups that have occurred in the past 10 days:
Listing 3
|
1 2 3 4 5 6 7 8 9 |
SELECT sd.name, bs.TYPE, bs.database_name, bs.backup_start_date as last_backup FROM master..sysdatabases sd Left outer join msdb..backupset bs on rtrim(bs.database_name) = rtrim(sd.name) left outer JOIN msdb..backupmediafamily bmf ON bs.media_set_id = bmf.media_set_id WHERE sd.name = 'DBA_Info' and bs.backup_start_date > getdate() - 10 Order by sd.name,last_backup |
Figure 3 shows the results, which can be quickly reviewed to make sure that the logs backups are happening successfully, beginning at 6:00 AM and executing every 2 hours until 4:00PM. You can see that there is a missing log backup, which will require further investigation:
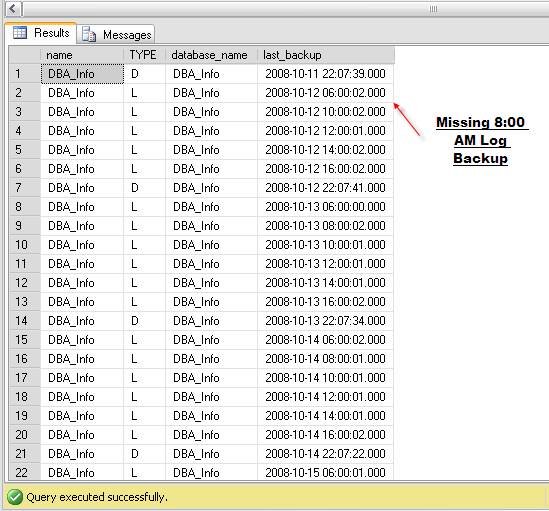
Figure 3: A missing log backup
Query a Trace File
DBAs know SQL, of course, so when the opportunity presents itself to analyze data, no matter what it is, they’d prefer to use a SELECT statement. A case in point would be a trace file. On any given week, DBAs will find themselves using SQL Profiler to capture SQL Server process information. SQL Profiler is the crystal ball that allows the DBA to see into the mysterious depths of the SQL Servers they manage.
Server-side traces are ideal for storing information in a database table for analysis. However, a single-use client-side trace file, created with SQL Profiler, can also be interrogated using T-SQL, without the need to save the trace to a database table.
Figure 4 shows saving a trace file that has captured several minutes of activity on a SQL Server 2008 instance. The file is saved as “Trace1.trc” in “C:\Documentation\SQL_Traces\”.
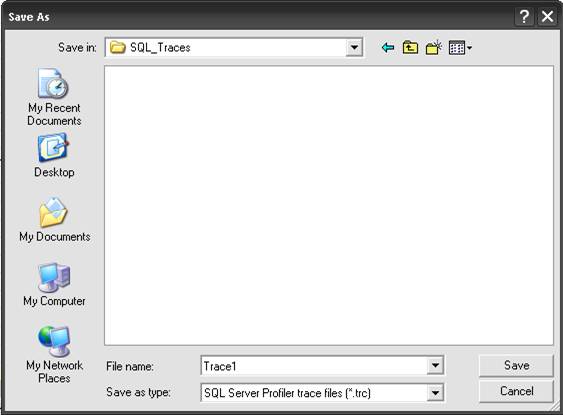
Figure 4: Saving a Profiler trace file to disk.
In SQL Profiler itself, the captured data can be viewed and searched, but it can take some time to find a specific issue. Figure 5 shows the sample data captured in SQL Profiler.
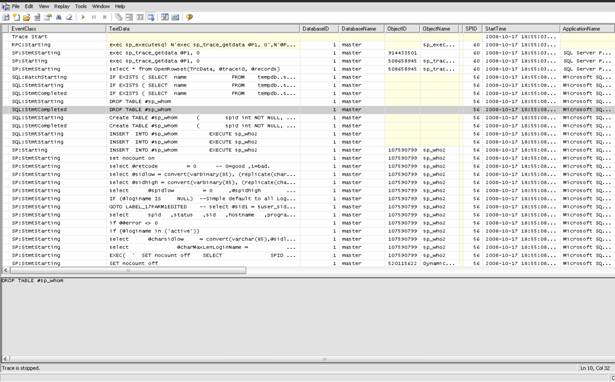
Figure 5: A trace file viewed in the Profiler GUI.
Thankfully, there is a much easier way to analyze this data, using a special function included in SQL Server to read a trace file. This function is called fn_trace_gettable. Here is a simple T-SQL query to read the trace file, Trace1.trc, that Profiler saved:
Listing 4
|
1 2 3 |
SELECT * FROM ::fn_trace_gettable('C:\Documentation\SQL_Traces\Trace1.trc', default) order by starttime GO |
What if, for example, we want to find any queries that include the word “DROP”, “TRUNCATE” or “DELETE”? That would be as easy as adding in criteria in a WHERE clause, as shown in Listing 5:
Listing 5
|
1 2 3 4 5 6 |
SELECT * FROM ::fn_trace_gettable('C:\Documentation\SQL_Traces\Trace1.trc', default) WHERE TextData like '%DROP%' OR TextData like '%TRUNCATE%' OR TextData like '%TRUNCATE%' GO |
With this new filtered query, even with hundreds of thousands of records, we can immediately detect if these statements were executed, by whom and at what time.
The output of the filtered query, Figure 6, shows only these transactions.
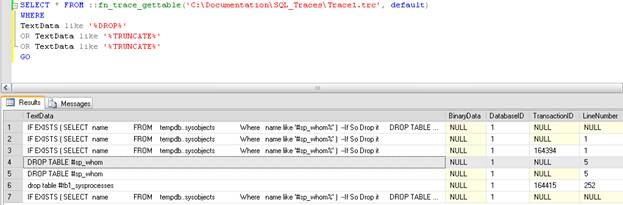
Figure 6: Who has been executing DROP, TRUNCATE or DELETE queries?
Of course, Profiler can save data to a SQL Server table directly (or you can save a .trc file into a database table). However, if you are provided a trace file for analysis, from a third party, and you want to dive in quickly, this method works well.
Read Error Logs the DBA Way
Unlike a lot of other DBAs that I know, I do not scour the SQL Error logs daily. I tend to review them when looking for a specific error, or when conducting a periodic security review. It is not that I think it is a waste of time to do it, I just think that I would much prefer to read the logs with T-SQL. Fortunately, SQL Server offers two stored procedures to make this possible, sp_enumerrorlogs and sp_readerrolog.
As Figure 7 shows, sp_enumerrorlogs simply lists the SQL Server error logs:
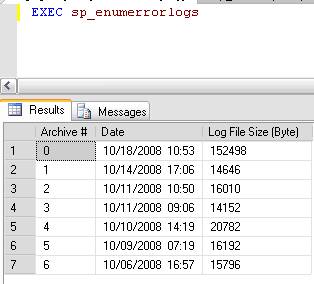
Figure 7: Querying the SQL Server error logs with sp_enumerrorlogs
The procedure sp_readerrorlog takes the “Archive #” from sp_enumerrorlogs as input and displays the error log in table form, as shown in Figure 8, where the first archived log file (1) is passed in as a parameter. Archive number 0 will be the current error log.
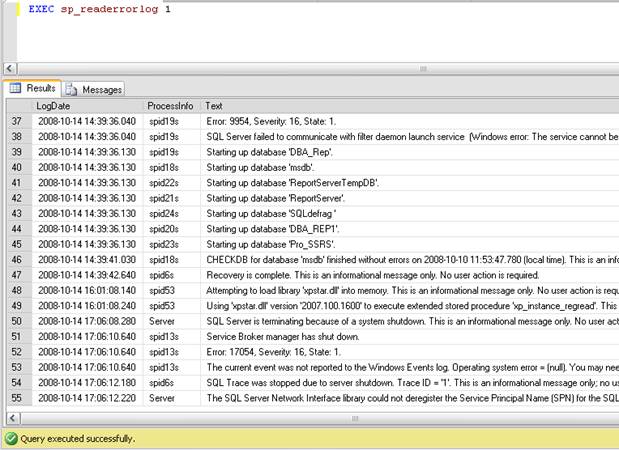
Figure 8: Using sp_readerrorlog
It is possible to load and query every error log file by combining the two stored procedures with a bit of iterative code. Listing 6 shows custom code used to loop through each log file, store the data in a temp table, and subsequently query that data to find more than 5 consecutive failed login attempts as well as the last good login attempt. Remember that you will need to have security logging enabled in order to capture both the successful and failed logins, as most production servers should do.
Listing 6
|
1 2 3 4 5 6 7 8 9 10 11 12 13 14 15 16 17 18 19 20 21 22 23 24 25 26 27 28 29 30 31 32 33 34 35 36 37 38 39 40 41 42 43 44 45 |
> DECLARE @TSQL NVARCHAR(2000) DECLARE @lC INT CREATE TABLE #TempLog ( LogDate DATETIME, ProcessInfo NVARCHAR(50), [Text] NVARCHAR(MAX)) CREATE TABLE #logF ( ArchiveNumber INT, LogDate DATETIME, LogSize INT ) INSERT INTO #logF EXEC sp_enumerrorlogs SELECT @lC = MIN(ArchiveNumber) FROM #logF WHILE @lC IS NOT NULL BEGIN INSERT INTO #TempLog EXEC sp_readerrorlog @lC SELECT @lC = MIN(ArchiveNumber) FROM #logF WHERE ArchiveNumber > @lC END --Failed login counts. Useful for security audits. SELECT Text,COUNT(Text) Number_Of_Attempts FROM #TempLog where Text like '%failed%' and ProcessInfo = 'LOGON' Group by Text --Find Last Successful login. Useful to know before deleting "obsolete" accounts. SELECT Distinct MAX(logdate) last_login,Text FROM #TempLog where ProcessInfo = 'LOGON'and Text like '%SUCCEEDED%' and Text not like '%NT AUTHORITY%' Group by Text DROP TABLE #TempLog DROP TABLE #logF |
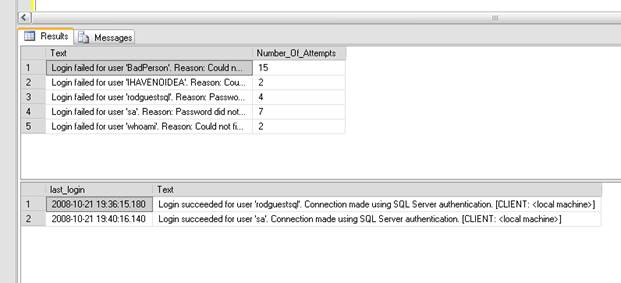
The results of this query are shown in Figure 9:
<
Figure 9: Querying for successful and unsuccessful login attempts.
We can see that there is a “BadPerson” out there who has tried 15 times to access this server. Also, questions often arise as to the last successful login for a certain account. The second result set in Figure 9 shows this information by using the MAX() function for the last_login field.
Go more than once
The final sample may not be one that you would put on your thumb, but at least you can keep it in the back of your mind. There are various ways using T-SQL, some better than others, to write iterative statements. For example, most would agree that it is a fairly simple task to write a set-based query, like that shown in Listing 7, to produce 1000 random numbers:
Listing 7
|
1 2 3 4 5 6 7 8 9 10 |
SET NOCOUNT ON DECLARE @i int DECLARE @therow int SET @i = 1 While @i <= 1000 BEGIN set @theRow = convert(int, rand() * 100) Select @therow Set @i = @i + 1 END |
What some may not know is that the GO statement can perform the same function, in one or more batch statements, simply by specifying the number of times the code should be executed. Listing 8 shows a quick way to get the same results, 1000 random numbers, using only one declared variable and a GO 1000 statement. It works well for Insert statements too.
|
1 2 3 4 5 |
Set NOCOUNT on DECLARE @therow int set @theRow = convert(int, rand() * 100) Select @theRow Go 1000 |
The final output of the query can be seen in figure 10:
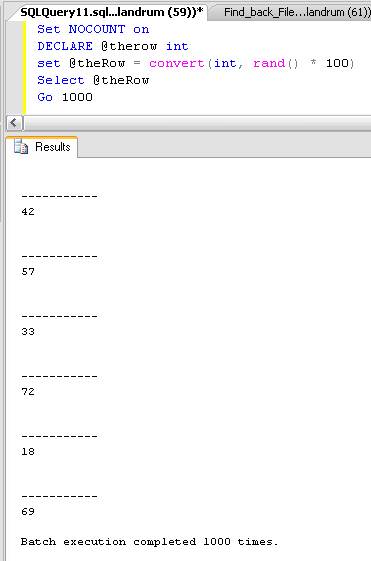
Figure 10: GO’ing 1000 times
Summary
One thing I have learned from being a DBA, and working with other experienced DBAs in the course of my career, is that we all tend to do things differently to get the same results. These are five queries that I find myself using every day. They can easily be expanded upon, and I know that there are enough great DBAs reading this who may do just that, or will choose to post their own versions. I welcome it. Now it is on to the other 995 queries.
This document contains proprietary information and is protected by copyright law.
Copyright © 2026 Red Gate Software Limited. All rights reserved
Load comments