
SQL Server has about 70 instance-level settings, depending on the version. These can have a significant effect on SQL Server’s behavior and performance. Most of these should be left at their default settings, but occasionally you will need to change some of them to suit your particular database environment. As the DBA, you should be familiar with all of the settings and what they do.
Now you may be wondering how to go about finding out what these 70-odd settings are for each of your instances, and how should they should best be configured. In this article I’ll show you how to easily collect this information, and I am going to explain what each setting does and the best way they typically should be configured. Of course, there is no way I can cover every conceivable server variation or need, so these recommendations are generic and should apply to most SQL Server instances. Just keep in mind that your environment might require a different setting than what I recommend in my best practices. Testing is the only way to determine exactly what setting works best for any individual SQL Server instance. I can only offer general advice.
How to Collect This Data?
While many of the SQL Server instance level configuration options can be viewed directly from various parts of SSMS, many of them cannot be directly viewed. Because of this, the easiest way to see the options is to run the following script.
|
1 2 3 4 |
SELECT * FROM sys.configurations ORDER BY name ; GO |
Or, you can run the following script if you like:
|
1 2 3 4 5 |
sp_CONFIGURE 'show advanced options', 1 RECONFIGURE ; GO sp_configure ; GO |
Either of the above scripts will list all of the server-level configuration settings for your server, although the first script is probably the best one to use, as it provides more information than the second script.
When you run the first script, you will see results similar to the following (click to enlarge):
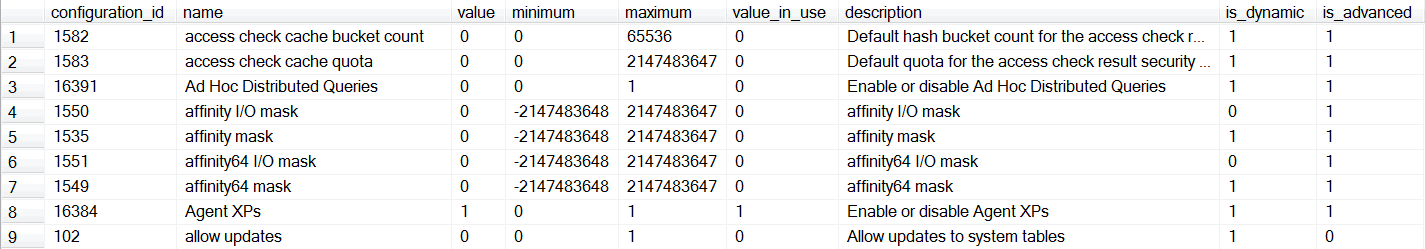
The output of the first script provides valuable information on how your instance-level configuration settings are currently set.
Let’s take a quick look at the different columns of data that are returned for each configuration setting (one rows equals one configuration setting).
- configuration_id: This is an arbitrary ID number for each of the configuration options, and generally is not that useful to know.
- name: This is the name of the configuration option, and you need to become familiar with each one of them.
- value: This is the value this option will take on once it is properly configured, assuming that it is different from the value_in_use. If the option has been properly configured, then it will be equal to the value_in_use. If you notice that the value and the value_in_use are not the same, and you have not changed this setting yourself, it is possible that someone tried to change this setting, but never fully completed all the necessary steps. These discrepancy should be investigated to find out why the option was never properly changed.
- minimum: The smallest legal value for the setting.
- maximum: The largest legal value for the setting.
- value_in_use: This is the value currently being used by SQL Server, and it should be the same as the value, as previously discussed.
- description: This is a brief description of the configuration option. Generally, it is not very descriptive or useful.
- is_dynamic: A value of 1 indicates that any changes to the value requires that the RECONFIGURE statement be executed before it equals the value of value_in_use. In other words, if you change a configuration option value using sp_configure, and don’t execute RECONFIGURE, the change won’t go into effect. A value of 0 means that the RECONFIGURE doesn’t have to be run after a change in the value using sp_configure.
- is_advanced: Some configuration settings are considered “advanced”, while others are not. This option is explained later in the chapter.
At this point, the above explanations may not mean a lot to you. But don’t worry, buy the time you finish this article, they will all make sense.
Collecting and Saving Configuration Information for a Number of Servers.
Besides using the above Transact-SQL scripts to gather SQL Server instance-level settings, you can also get these values via SMO. This is valuable because you can then save the settings in source control, and can keep track of all the changes for each of your instances. If you regularly schedule the collection of this information, then a source control system can inform you of any changes in your server configuration and, within reason, when it happened. You’ll may also want an easy way of checking the current configuration information for all your servers, preferably in an MS Office application, such as Excel.
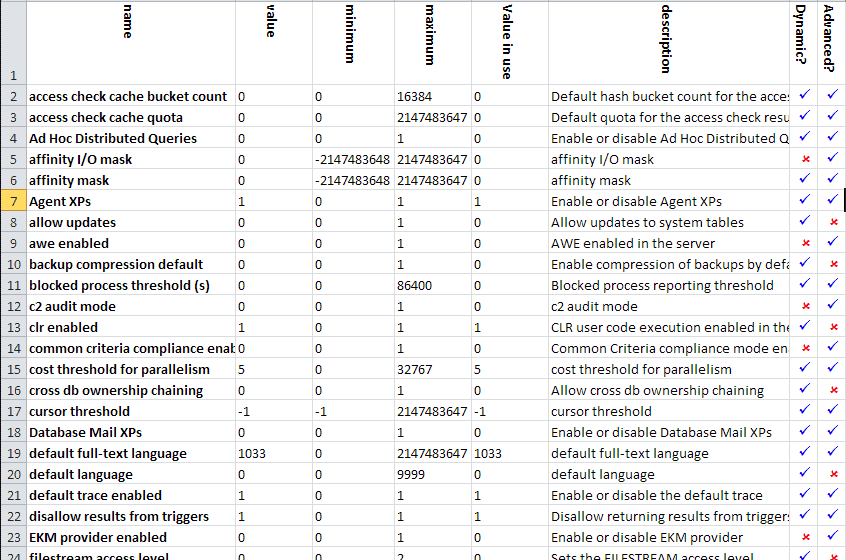
Below is as PowerShell script that saves the configuration information of a number of instances to a spreadsheet: Once the spreadsheet is created, the PowerShell script is no longer needed since the data can be refreshed from within Excel. This means that you will have a live record of the configuration settings of your instances.
|
1 2 3 4 5 6 7 8 9 10 11 12 13 14 15 16 17 18 19 20 21 22 23 24 25 26 27 28 29 30 31 32 33 34 35 36 37 38 39 40 41 42 43 44 45 46 47 48 49 50 51 52 53 54 55 56 57 58 59 60 61 62 63 64 65 66 67 68 69 70 71 72 73 74 75 76 77 78 79 80 81 82 83 84 85 86 87 88 89 90 91 92 93 94 95 96 97 98 99 100 101 102 103 104 105 |
<# This PowerShell routine creates an excel spreadsheet with the current configuration settings of all your servers. Each instance is on a different worksheet and the worksheets have the name of the instance. It works by using ODBC connections created locally on your workstation. Once the spreadsheet is created, the PowerShell script is no longer needed since the data can be refreshed from within Excel. This means that you will have a live record of the configuration settings of your instances. #> #change these following settings to your environment $DirectoryToSaveTo='E:\Scripts\' $Filename='DatabaseConfiguration' # <# Just make your list of servers here as an XML fragment these instance names are actually User ODBC DSNs DSNs. Better for Excel. We associate a version number with each just so you are sure of a script that will run (You can't get this info from the DSN, and Excel only allows one select statement in an Excel query #> $Servers=[xml] @' <serverList> <server version="2008" id="Angry"" /> <server version="2008" id="Grumpy"" /> <server version="2005" id="Dozy"" /> <server version="2000" id="Sleepy"" /> </serverList> '@ # constants. $xlCenter=-4108 $xlTop=-4160 $xlOpenXMLWorkbook=[int]51 # and we put the queries in here $SQL2005=@" SELECT name, value, minimum, maximum, value_in_use as [Value in use], description, is_dynamic AS [Dynamic?], is_advanced AS [Advanced?] FROM sys.configurations ORDER BY name ; "@ $SQL2008=@" SELECT name, value, minimum, maximum, value_in_use as [Value in use], description, is_dynamic AS [Dynamic?], is_advanced AS [Advanced?] FROM sys.configurations ORDER BY name ; "@ $SQL2000=@" SELECT Name, c.Value, low AS [minimum], high AS [Maximum], master.dbo.syscurconfigs.value AS [Value In Use], c.comment AS [Description] FROM master.dbo.spt_values v INNER JOIN master.dbo.sysconfigures c ON number = c.config INNER JOIN master.dbo.syscurconfigs ON number = master.dbo.syscurconfigs.config WHERE type = 'C' ORDER BY LOWER(name) "@ # before we do anything else, are we likely to be able to save the file? # if the directory doesn't exist, then create it if (!(Test-Path -path "$DirectoryToSaveTo")) #create it if not existing { New-Item "$DirectoryToSaveTo" -type directory | out-null } $excel = New-Object -Com Excel.Application #open a new instance of Excel $excel.Visible = $True #make it visible (for debugging more than anything) $wb = $Excel.Workbooks.Add() #create a workbook $currentWorksheet=1 #there are three open worksheets you can fill up foreach ($server in $servers.serverlist.server) { #only create the worksheet if necessary if ($currentWorksheet-lt 4) {$ws = $wb.Worksheets.Item($currentWorksheet)} else {$ws = $wb.Worksheets.Add()} #add if it doesn't exist $currentWorksheet += 1 #keep a tally if ($server.version -eq 2005) {$SQL=$SQL2005} #get the right SQL Script if ($server.version -eq 2008) {$SQL=$SQL2008} if ($server.version -eq 2000) {$SQL=$SQL2000} $currentName=$server.name # and name the worksheet $ws.name=$currentName # so it appears in the tab # note we create the query so that the user can run it to refresh it $qt = $ws.QueryTables.Add("ODBC;DSN=$currentName", $ws.Range("A1"), $SQL) # and execute it if ($qt.Refresh()) #if the routine works OK { $ws.Activate() $ws.Select() $excel.Rows.Item(1).HorizontalAlignment = $xlCenter $excel.Rows.Item(1).VerticalAlignment = $xlTop $excel.Rows.Item(1).Orientation = -90 $excel.Columns.Item("G:H").NumberFormat = "[Red][=0]û;[Blue][=1]ü" $excel.Columns.Item("G:H").Font.Name = "Wingdings" $excel.Columns.Item("G:H").Font.Size = 12 $excel.Rows.Item("1:1").Font.Name = "Calibri" $excel.Rows.Item("1:1").Font.Size = 11 $excel.Rows.Item("1:1").Font.Bold = $true $Excel.Columns.Item(1).Font.Bold = $true } } $filename=$filename -replace '[\\\/\:\.]',' ' #remove characters that can cause problems $filename = "$DirectoryToSaveTo$filename.xlsx" #save it according to its title if (test-path $filename ) { rm $filename } #delete the file if it already exists $wb.SaveAs($filename, $xlOpenXMLWorkbook) #save as an XML Workbook (xslx) $wb.Saved = $True #flag it as being saved $wb.Close() #close the document $Excel.Quit() #and the instance of Excel $wb = $Null #set all variables that point to Excel objects to null $ws = $Null #makes sure Excel deflates $Excel=$Null #let the air out # Hristo Deshev's Excel trick 'Pro Windows PowerShell' p380 [GC]::Collect() |
This will create one spreadsheet with each instance on a worksheet (with its name on the tab, of course) Each spreadsheet can be refreshed to give you the current configuration settings as long as your workstations have the ODBC devices set up with the right credentials. Here is a sample:
This is fine as a record of the configuration information for your instances but it doesn’t give you a record of what has changed, when and why. To do this, you will need to save it in Source control.
Below is a PowerShell script that uses SMO to generate a series of files, one for each instance, with a list of the configuration information. In order to automatically put this into source control, you can use the techniques described with some brilliance by Grant Fritchey in his article ‘Auditing DDL Changes in SQL Server databases’; but beware that each Source Control system has a different way of saving files into source control. The easiest technique is to save the information as a CSV file which will be treated by Source Control as if it were a script, and allow you to track changes.
|
1 2 3 4 5 6 7 8 9 10 11 12 13 14 15 16 17 18 19 20 21 22 23 24 25 26 27 28 29 30 31 32 33 34 35 36 37 38 39 40 41 42 |
# "Option Explicit" set-psdebug -strict $ErrorActionPreference = "stop" # Give a list of the servers that you'd like to have configuration and settings information on. $servernames=@('FirstServer', 'SecondServer', 'ThirdServer', 'fourthServer') #And the directory where you'd like this information stored (with the terminating backslash!) $DirectoryToSaveTo='E:\Mydirectory\' #Create the directory if it doesn't exist already if (!( Test-Path -path "$DirectoryToSaveTo")) #create it if not existing {$progress ="attempting to create $DirectoryToSaveTo" Try {New-Item "$DirectoryToSaveTo" -type directory | out-null } Catch [system.exception]{ Write-Error "error while $progress \n$_" return } } #Now we find and load SMO $v = [System.Reflection.Assembly]::LoadWithPartialName( 'Microsoft.SqlServer.SMO') if ((($v.FullName.Split(','))[1].Split('='))[1].Split('.')[0] -ne '9') { [System.Reflection.Assembly]::LoadWithPartialName('Microsoft.SqlServer.SMOExtended') | out-null } $My='Microsoft.SqlServer.Management.Smo' # and for each server... Foreach ($servername in $Servernames){#for each server in the list $s = new-object("$My.Server") $servername #create the server object if ($s.ServerType-ne $null) #if it managed to find a server { $filename="$servername"-replace '[\\\/\:\.]',' ' #remove characters that can cause problems #and write out the configuration information $s.configuration.properties | Sort-Object ` -Property DisplayName|ConvertTo-CSV ` >"$DirectoryToSaveTo$filename-Configuration.CSV" } else { "Sorry, but I couldn't find $servername" } $s.close } |
This will create a file for each server in CSV format ready for virtually any Source Control system, or reading into almost anything.
You’ll notice that neither SMO nor sp_configure actually store the default settings. Assuming you have a new installation, then the run_value is the default value. If you save this into Source Control at this point, you can be sure of tracking changes from this default setting. If you have a server that has been around awhile, and could have had some of the options changed, how do you know what the default value should be, and even if the value has been changed? One option is to look up the default value in Books Online, under “Setting Server Configuration Options”.
SQL Server Instance-Level Configuration Setting Best Practices
Now that you know how to gather all the instance-level configuration information from your SQL Servers, it’s time to learn what each one means, and what are the best practices for their configuration. As I mentioned earlier, most settings should stay at their default values. On the other hand, there are some settings that you may want to change to help ensure your instances are running optimally. The only way to know is to learn more about each option.
Before you begin reading through the options, there are two things you need to know. First, some of the options are related to one another, and because of this, I have grouped these together to make them easier to understand. Also, some of these configuration options vary, depending on which version of SQL Server you have. Because of this, I have indicated which setting is applicable to which version using the following key: (1) 2005, (2) 2008, (3) 2008 R2, (4) 64-bit only, (5) Deprecated.
access check cache bucket count (2)
(3)access check cache quota (2) (3)
The “access check cache bucket count” and the “access check cache quota” options are directly related to one another, and any change to one should also include a change to the other. Both of these settings affect an internal structure in SQL Server called the “access check result cache”. This cache is used to keep track of whenever any database objects are accessed. In some very rare cases, performance problems can result if these settings, which affect the size of the “access check result cache” are too low or too high. The default setting for these two options is “0”, which means that these settings are dynamically set internally by SQL Server. If you change these default values, then the dynamic aspect of sizing the “access check result cache” goes away, and the values you enter become hardcoded values that will now be used until they are again changed. Because the need to change these values is so rare, Microsoft recommends that you don’t change these values unless you have been told to do so by a Microsoft Customer Support Services. Find out more from this Microsoft Knowledge Base article: KB 955644.
ad hoc distributed queries (1) (2) (3)
By default, as a security precaution, SQL prevents distributed ad hoc queries from using either the OPENROWSET or the OPENDATASOURCE Transact-SQL statements to access remote data sources using OLE DB. If you need to employ this functionality in your instance, then you will need to change the default setting from “0” to “1”. The downside to doing this is that any authenticated SQL Server user can access the OLE DB provider, which may present a security risk. If you don’t need this feature, then leave this option at its default value of “0”.
affinity I/O mask (1) (2) (3)
affinity64 I/O mask (1) (2) (3) (4)
The “affinity I/O mask” and the “affinity64 I/O mask” options are used to bind SQL Server disk IO to specific CPUs. These options should rarely ever need to be used and their default value of “0” should not be changed unless you are an expert and have thoroughly tested the settings in a proper lab environment to see if they would be beneficial in your production environment.
affinity mask (1) (2) (3) (5)
affinity64 mask (1) (2) (3) (4) (5)
The “affinity mask” and “affinity64 mask” options are used to bind processors to specific threads, which can sometimes boost performance on very busy SQL Servers with many cores. These two options are deprecated and should not be used if running SQL Server 2008 R2 and higher. If you are using SQL Server 2008 R2 or higher, use ALTER SERVER CONFIGURATION instead if you need similar functionality. So not change this setting unless you are an expert and have thoroughly tested the settings in a proper lab environment, as selecting the correct settings can be complex, and incorrect settings can lead to poor performance.
Agent XPs (1) (2) (3)
Agent XPs are extended stored procedures required by the SQL Server Agent to run. So if you plan to run the SQL Server Agent service on your instance, which is the most common practice, then this option must be set to “1”, which means they are enabled. Technically speaking, the default value is “0”, but you probably won’t ever see this value, as whenever the first time the SQL Server Agent is started, the setting is automatically changed from “0” to “1”. The only reason you would every set then option to “0” is if you no longer intend to run the SQL Server Agent service with your SQL Server instance, and you want to reduce the security surface area of your instance.
allow updates (5)
This feature is deprecated and does not work on SQL Server 2005 and higher, and in fact, will cause an error if you do try to change it. Do not change it from the default value of “0”.
awe enabled (1) (2) (3) (5)
This feature is depreciated, although it is very useful if you are still running any 32-bit version of SQL Server with more than 4 GM of RAM on Windows 2003 or earlier. When using a 32-bit version of the operating system and SQL Server, this setting must be turned on if you have more than 4 GB of RAM, and if you want SQL Server to use any of the RAM above 4 GB. The default value of “0” means that this option is off, and a value of “1” means that it is on. This option does not apply to any 64-bit version of SQL Server.
backup compression default (2) (3)
SQL Server 2008 Enterprise Edition, or SQL Server 2008 R2 Standard or Enterprise edition, both offer a limited type of native backup compression. This instance level configuration setting has minimal usefulness, as all it does is to set the default setting for backups if the WITH COMPRESSION or WITH NO_COMPRESSION options are not used as part of the BACKUP DATABASE or BACKUP LOG statements. For example, if the “backup compression default” option is left at the default “0” value, then if either the BACKUP DATABASE or BACKUP LOG statements are issued without the WITH COMPRESSION or WITH NO_COMPRESSION options, then a native backup without compression is performed. On the other hand, if the “backup compression default” option is set to “1”, then if either the BACKUP DATABASE or BACKUP LOG statements are issued without the WITH COMPRESSION or WITH NO_COMPRESSION options, then a native backup with compression is performed. Using WITH COMPRESSION or WITH NO_COMPRESSION will always override the value for the “backup compression default” option.
Instead of using this configuration setting, always specify the specific options you want, such as specifically adding WITH COMPRESSION or WITH NO_COMPRESSION to the BACKUP DATABASE or BACKUP LOG statements in your scripts. As a DBA, you should not be relying on defaults such as this, as the end effect of your script may not be what you expect.
blocked process threshold (1) (2) (3)
Blocked processes are a problem that many DBAs regularly troubleshoot, and this configuration option can come in handy to help identify and diagnose them. This option is off by default, set to “0”, but when it is turned on, a blocked process report is produced every “n” seconds, where “n” equals the number of seconds between when blocked process reports are created. For example, if “blocked process threshold” is set to “60”, then every 60 seconds a blocked process report will be generated, which includes any processes that were being blocked at the time the blocked process report was created. So where do these blocked process reports appear? Blocked process reports create an event that can best be captured using SQL Trace (or Profiler). In addition, an alert can be created that fires when the blocked process report captures a blocked process. The smallest time frame that can be specified for “blocked process threshold” is 5 seconds. While values of 1-4 seconds will not result in an error message, blocked process reports will not work unless the setting is 5 seconds or higher.
The blocked process report uses server resources, so it should be turned on and off when needed, and not left on all the time. In addition, the more often a blocked process report is generated (the fewer seconds between reports), the more resources that are used.
c2 audit mode (1) (2) (3)
The “c2 audit mode” is used to implement the U.S. Department of Defense’s outdated C2 Security Standard, which records failed and successful attempts to access objects and statements within SQL Server. This option is very resource intensive and uses large amounts of disk space. It is recommended that this option not be used, as this standard has been superseded by the Common Criteria Security Standard, which is an option that also can be turned on, and will be discussed shortly. The only reason the “c2 audit mode” should ever be used for an instance is if it has been mandated by law or regulation that it be used.
clr enabled (1) (2) (3)
By default, SQL Server will not run user CLR (Common Language Runtime) assemblies. This is done as a way to reduce the security surface area. If user CLR assemblies are not required by an application, then the “clr enabled” configuration option should be left to this default setting of “0”. Of course, if user CLR assemblies are required, then this option must be turned on, set to “1”. The “clr enabled” option is mutually exclusive with the “lightweight pooling” option, which will be described soon. In other words, if “clr enabled” is turned on, then “lightweight pooling” has to be turned off.
common criteria compliance enabled (1) (2) (3)
The “common criteria compliance enabled” instance setting is used to help make a SQL Server instance compliant with the Common Criteria security standard established by the NSA DBMS Protection Profile. When this setting is changed from its default value of “0” to “1”, this is the first step to becoming compliant. The second step is to run a special script available from download at http://www.microsoft.com/sqlserver/en/us/common-criteria.aspx. Once all of this is done, the SQL Server will begin collecting auditing data and performing security-related internal tasks. This option should only be turned on if required by law or regulation, as it can impose a performance penalty and use a lot of disk space.
cost threshold for parallelism (1) (2) (3)
As the query optimizer evaluates a query for creating an execution plan on a server with two or more available CPUs, it estimates how much time it thinks the query will take to execute. If that estimated time is below a specified threshold, then a serial execution plan will be created. But if the estimated time is over the specified threshold, this it may decide to parallelize it, hopefully boosting the query’s performance. By default, this threshold is 5 seconds. For some OLTP systems, query parallelization can become more of a problem than a help, and one way to help alleviate this potential problem is to raise the threshold from 5 second to a higher number. There is no ideal number that can be suggested, as each instance is different. As a rule of thumb, you shouldn’t change this setting unless you have specific evidence that parallel queries are causing a performance issue, and only then if you experiment to determine what threshold value is best. In addition, there are other options to deal with problematic parallel queries, such using the MAXDOP hint or the “max degree of parallelism” configuration option, which will be discussed shortly. The estimated time calculated by the query optimizer is based on the available statistics. If the statistics are outdated or skewed, the query optimizer may make an incorrect guess. Because of this, it is important that index and column and index statistics are always current.
cross db ownership chaining (1) (2) (3)
Ownership chaining within a single database is a handy way to manage security within a database because it reduces the amount of work needed to set object permissions. While single database ownership chains are a standard feature of SQL Server, by default, ownership chaining across different databases on the instance is turned off by default as a way to reduce the security surface area. This feature is controlled by the “cross db ownership chaining” option, which is set to “0”, which means ownership chaining across databases is not allowed. This option should only be turned on, set to “1”, if all the databases on an instance need to participate in cross database ownership chaining, which is a rare occurrence. If only some of the databases on an instance need to participate in cross ownership chaining, then this feature should be turned on at the database level using the ALTER DATABASE statement, not at the server level, which is what this option does.
cursor threshold (1) (2) (3)
If you follow database application coding best practices, you won’t have any cursors in your production applications and this option is superfluous. By default, the “cursor threshold” setting is set to “-1”, which means that all cursor keysets are to be created synchronously. For smaller keysets, this can benefit performance. If the “cursor threshold” setting is set to “0”, then all cursor keysets are created asynchronously. This can sometimes help benefit the performance of larger keysets. Or, if you don’t like these all or none options, you can use a value from 1 through 2147483647. If you enter any one number from this range, it will act as a threshold as to whether the keyset is created synchronously or asynchronously. For example, if you change the value of “cursor threshold” to “1000”, then if the estimated number of rows in the keyset is less than 1000, then it will be performed synchronously. If the estimated number of rows is greater than 1000, then it will be performed asynchronously. The estimated time calculated by the query optimizer is based on the available statistics. If the statistics are outdated or skewed, the query optimizer may make an incorrect guess. Because of this, it is important that index and column and index statistics be current.
Experimenting with this option is generally a waste of time. If you are having problems with cursor performance, then get rid of the cursors.
Database Mail XPs (1) (2) (3)
To reduce the security surface area of SQL Server, Database Mail is turned off when SQL Server is first installed. This is reflected in the “Database Mail XPs” configuration option, where the default value of “0” is used to indicate that Database Mail is turned off. If your instance doesn’t need Database Mail, then leave it off. On the other hand, Database Mail is often very useful, and you shouldn’t be afraid to turn it on. Typically, the best way to change this setting is to let SSMS do it for you. For example, when you use SSMS to configure Database Mail, it will automatically change this setting to “1”, so you don’t have to.
default full-text language (1) (2) (3)
This option is used by the Full-Text Search Service, so if you are not using this service, this setting is irrelevant. The value for “default full-text language” configuration option should match the default language you want the Full-Text Search service to use when it perform linguistic analysis on indexed data. If that language is English, then the value for this option is “1033”. To find out the values that represent other languages, check out Books Online.
default language (1) (2) (3)
Don’t confuse this option with the “default full-text language” above, which uses a different numbering system to refer to languages used by SQL Server. The “default language” configuration option tells SQL Server what default language you want to be assigned for all newly created logins, assuming that you have not selected the DEFLANGUAGE option of CREATE LOGIN statement. A value of “0” means to use English as the default language. To find out which other languages (and their associated language IDs) are available, query the sys.syslanguages table in the master database. Generally, this setting does not need to be changed.
default trace enabled (1) (2) (3)
By default, SQL Server always runs a background SQL Trace that captures key data that can be used for troubleshooting problems. While there is a little bit of overhead associated with this, it is minor, and the best practice is to leave it running. The “default trace enabled” option is on by default, with a setting of “1”. To turn it off, set it to “0”. There is one good reason why you might turn the default trace off, and that is if you want to create your own customized trace that captures different information that collected by the default trace. In other words, you will be replacing the default trace with a “default” trace of your own creation.
disallow results from triggers (1) (2) (3) (5)
This feature is deprecated and should not be used. When “disallow results from triggers” is set to the default value of “0”, this means that SQL Server does not permit triggers to return result sets. This is because returning result sets from triggers can cause unexpected behavior, including error messages. This option should always be “0” for existing instances of SQL Server.
EKM provider enabled (2) (3)
EKM (Extensible Key Management) is a feature of SQL Server that allows third-party vendors to provide software and hardware solutions to manage encryption keys for SQL Server. In other words, Microsoft is only providing an API that allows vendors to create products for key management, and you have to purchase third-party tools to implement the key management. If your instance is not using such a product, the “EKM provider enabled” option should stay at its default setting of “0”, which means that the EKM feature is disabled. If you should purchase a third-party product for SQL Server, installing it may automatically turn this option on for you, or instructions for turning it on may be included with the product.
filestream_access_level (2) (3)
The “filestream_access_level” configuration option will be set to a value depending on the Filestream options you selected when you first installed SQL Server, or based on the Filestream settings manually configured using the SQL Server Configuration Manager after installation. A value of “0” indicates that Filestream support is not enabled. A value of “1” means that Transact-SQL Filestream access has been enabled. And a value of “2” means that both Transact-SQK and Win32 streaming Filestream have been enabled. These settings should rarely, if ever, be changed manually. Instead, if you need to change this setting, do so using the SQL Server Configuration Manager. This is because simply changing this setting is not enough to fully implement Filestream. If this setting is a “1” or “2”, and Filestream is not being used on this instance, then turn Filestream off using the SQL Server Configuration Manager in order to conserve resources, which will also change this configuration option for you automatically.
fill factor (1) (2) (3)
If you follow best practices for creating and rebuilding indexes, you will manually set the FILLFACTOR option of the CREATE INDEX or the ALTER INDEX statements, thus making this configuration option of little value. What the “fill factor” configuration option does is to specify the default fill factor to be used by the CREATE INDEX or the ALTER INDEX statements if the FILLFACTOR option is not specifically included. By default, the “fill factor” setting is set to the default value of “0”, which means that100% of the available space on the leaf-level pages of an index are filled to capacity. While some indexes can benefit from a 100 fill factor, other indexes need different fill factors for optimum performance. It is a poor choice to use the same fill factor for all of your indexes, and relying on the “fill factor” default often leads to indexes that all have a 100 fill factor (after first being created, or after having just be rebuilt).
ft crawl bandwidth (max): (1) (2) (3) (5)
ft crawl bandwidth (min): (1) (2) (3) (5)
ft notify bandwidth (max): (1) (2) (3) (5)
ft notify bandwidth (min): (1) (2) (3) (5)
The above four full-text related configuration options are all deprecated and should not be used. Originally, they were designed to help control how the Full-Text Search service uses memory, assuming it is being used. For now, leave these settings at their default values, unless told to change them from Microsoft SQL Server Customer Support Services. The (max) settings above default to “100” and the (min) settings default to “0”.
index create memory (1) (2) (3)
The default value for “index create memory” is “0”, which tells SQL Server to automatically allocate the amount of memory necessary for creating indexes. In some rare cases, it is possible an index won’t be created due to a lack of memory, and you will receive an error message after attempting to create one. If you repeatedly receive such error messages, you may want to consider changing the “index create memory” option so that more memory is allocated. But there are two problems with this. First, how much memory should you allocated? And second, any memory that you allocate for index creation will take away memory from other SQL Server processes, potentially hurting SQL Server’s overall performance. So if you decide to manually assign memory for index creation, it is very critical to test various settings, and then to monitor your instance’s performance in order to determine the optimum amount of RAM to allocate.
If you are getting memory error about index creation, instead of changing this option and increasing the memory allocated to index creation, perhaps there are other routes you can take. For example, does your database have partitions? If so, ensure that the data and indexes are aligned, as if they are not aligned, the index creation error can occur. Or, are you trying to rebuild many different large indexes at the same time? If so, consider spreading out the index rebuilds over time to reduce the need for index creation memory. In other words, often changing how you manage indexes can fix this problem, which is a much better solution than trying to manually find the ideal configuration setting through trial and error.
in-doubt xact resolution (1) (2) (3)
The “in-doubt xact resolution” option is only used if you are using MSDTC as part of your SQL Server instance. The default value of “0” means that if MSDTC can’t resolve any problematic transactions on its own, that it should abort the transaction. Value “1” tells MSDTC that if it runs into any problematic transactions, that it should presume they are OK and commit the transaction. Value “3” tells MSDTC that if there are any problematic transactions, don’t try to resolve them, just abort them. This option should not be changed from its default unless you know exactly how your application will deal with the non-default behaviors.
lightweight pooling (1) (2) (3)
The “lightweight pooling” option is only to be used in very rare instances on very large multi-core systems with excessive context switching, maxed out CPU utilization, and generally only when using Windows 2003 and earlier. If used correctly, it can slightly boost CPU performance under very specific conditions. If used incorrectly, it can hurt CPU performance. This is difficult to diagnose and is best left up to an experienced SQL Server expert, or used upon recommendation by Microsoft SQL Server Customer Support Services. In fact, you should try all other performance tuning tricks before you try this one as a last ditch measure. In addition, “lightweight pooling” cannot be used in conjunction with the CLR, so if the CLR is enabled using the “clr enabled” configuration option, then “lightweight pooling” cannot be used. Leave this option set to its default value of “0”, which means lightweight pooling is not enabled.
locks: (1) (2) (3) (5)
This option is deprecated and should not be used. By default, the “locks” configuration option is set to “0”, which means that SQL Server is left to determine how much memory it is to be allocated for tracking locks. If you enter your own value, you are telling SQL Server to use a maximum number of locks, and as a result, limit the amount of memory used for locking. Some DBAs use this option in order to prevent locks from taking too much memory away from other SQL Server processes. This is a zero sum game, and this option should remain at its default setting. If memory pressure is a problem on the server, either take actions that reduce the need for SQL Server to use more memory, or add more RAM to the server.
max degree of parallelism (1) (2) (3)
By default, on multiple-core SQL Servers, the query optimizer can choose to run a query serially or in parallel. The default setting of “0” for the “max degree of parallelism” tells the query optimizer that it can use as many or as few of the available cores it wants when executing a query. The query optimizer considers many different things when it makes this decision, including taking into consideration the setting for the “cost threshold for parallelism”, which was discussed earlier. Most of the time, the query optimizer makes the right choices when to use and not use parallelism, and performance is fine.
But in some OLTP environments, parallelism might actually hinder the performance of some queries. Once parallelism is identified as being an actual problem, slowing down queries, the DBA has several choices on how to deal with this. One option is to use the MAXDOP hint in the problem queries to limit or prevent parallelism on a case by case basis. Another option is to increase the “cost threshold for parallelism” so that fewer queries are able to be parallelized.
On the other hand, some DBAs use the “max degree of parallelism” option to prevent this problem. For example, they set the “max degree of parallelism” to “1”, which turns off parallelism for all queries on the server. This is a baseball bat way of solving the problem, as it affects all parallel queries, not just the problem queries. While it might be the best solution for some edge cases, it is generally not a great solution because of its brute force approach.
But before experimenting with using the MAXDOP hint or turning parallelism off, you should try the following recommendations first. This information is loosely based from the Microsoft Knowledge Base article #KB 2023536, and it is the best advice I have seen regarding best practices for setting the “max degree of parallelism” option for SQL Servers that have typical workloads (mixed OLTP and OLAP activity).
- For servers that have eight or less physical cores, leave the “max degree of parallelism” to its default value of 0. In other words, start running your system using the default, and allow SQL Server to make the best decisions.
- If your server has more than eight physical cores, then set the “max degree of parallelism” to eight. In other words, the recommendation is to limit the query optimizer to only eight cores.
- If your server is configured for NUMA, the “max degree of parallelism” should not exceed the number of cores that have been assigned to each NUMA node, with a maximum number of eight.
- For servers that have hyper-threading enabled on modern chipsets, the “max degree of parallelism” should not exceed the number of physical cores. For example, if you have a four-core server with hyper-threading on, then the “max degree of parallelism” should be four.
These are just general recommendations for SQL Server and are a good starting point for setting the “max degree of parallelism” option. Of course, your environment may be different and require different settings. If you follow the above general recommendations, and you discover that the query optimizer is actually creating some poor parallel execution plans, then you should experiment with using the MAXDOP hint or modifying the “cost threshold for parallelism” options to see how the affect the problem queries. If these options don’t work, then consider reducing the number of CPUs available for parallelism. Whichever method you choose, you will need to perform formal testing to ensure that the final choice you make actually increases performance and doesn’t hurt it.
max full-text crawl range (1) (2) (3)
This option is only used if you are using the Full-Text Search service. When the Full-Text Search service performs a full crawl (which means that it is essentially looking at all the specified data and creating a full-text index of it), this process can be CPU intensive. SQL Server considers a number of factors when considering how much of the available CPU resources to use during a crawl, but you can influence it by changing this option. For example, let’s say that the full crawl is scheduled during a time when the instance is not very busy. If this is the case, the time it takes to perform the crawl can be speed up if more CPU resources are devoted to the effort. You can influence this by increasing the default value of 4 for the “max full-text crawl range” to a higher number. Some DBAs who specialize in the full-text engine suggest that the value for this option should match the number of physical cores in your server. On the other hand, if the time period when a full crawl takes place is when SQL Server is very busy, the default value of 4 can be lowered. This will reduce the amount of CPU resources used for the crawl, and at the same time cause it to take longer to complete. This option should only be changed if you have determined, through extensive testing, that changing this option provides you the results desired.
max server memory (1) (2) (3)
min server memory (1) (2) (3)
Because these settings are so closely related, we will talk about them together. In addition, because these two options are so critical, we will be spending extra time discussing them.
These two settings determine what the minimum and maximum amount of memory is used by the buffer pool. Essentially, the buffer pool is a part of RAM that is allocated by SQL Server for storing data, execution plans, and a variety of other data that needs to be in RAM from a performance perspective. It is very important to keep in mind that these two settings are exclusively for setting the lower and upper limits of the buffer pool, and not for other SQL Server components, or other consumers of memory, such as theads. In other words, these settings don’t have any effect on the memory requirements for other parts of SQL Server, which also require memory to run.
Be default, the “min server memory” is set to “0” and the “max server memory” is set to 2147483647. If you leave these settings at their defaults, then SQL Server dynamically manages the amount of memory used by the buffer pool. In addition, this is also telling SQL Server that it can allocate as much memory as it wants to the buffer pool, as long as the operating system allows it. In other words, the operating system and SQL Server are supposed to work together in order to ensure that there is enough memory for the SQL Server buffer pool, other SQL Server components, the operating system itself, and any other processes running on the same server. Unfortunately, this cooperation is sometimes one-sided, with SQL Server often having the greatest influence. To better understand this, let’s look at an example with these two settings set at their defaults.
Let’s say that our server has Windows 2008, SQL Server (let’s assume the 64-bit version for the OS and SQL Server), SSIS (SQL Server Integration Services), and SSRS (SQL Server Reporting Services). In addition, let’s assume that both Profiler and Performance Monitor are run on the server on a regular basis.
When the server is turned on, the OS first loads, and the SQL Server services, including the SQL Server Engine, SQL Server Agent, SSIS, and SSRS. For now, let’s assume that Profiler and Performance Monitor are not loaded right away. At this point no user activity is taking place, so each of the services only takes as much memory as needed to initialize themselves.
Now let’s assume that user’s begin to connect to the SQL Server engine and that they begin running queries; really large ad hoc queries. This means that SQL Server needs more RAM for the buffer pool in order to store the data requested by the queries. Since the server has plenty of available RAM at this time, the OS gives SQL Server the RAM it requests.
Because the “max server memory” is set to 2147483647, SQL Server can continue to request more and more RAM as it is needed until the OS tells SQL Server that there is no more available RAM. In other words, the buffer pool is taking advantage of its ability to cache a lot of data, which helps to speed user queries, as the data is in RAM and not on disk. Generally speaking, this is a good thing.
Now, let’s assume that SQL Server is getting very busy, and in fact, it may start to aggressively move data to and from the buffer pool from disk because there is no more RAM for the buffer pool to grab. In other words, SQL Server is under memory pressure itself.
For fun, now let’s assume that a SSIS package kicks in that is used to import 5 million rows into the database, that users begin to run reports from SSRS, and that the DBA decides to kick off both Profiler and Performance Monitor at the same time in order to troubleshoot the performance problems the server is currently experiencing.
As SSIS and SSRS begin to perform work, they need more memory and ask for more from the OS. The same is true when Profiler and Performance Monitor are both started. When other processes need more memory, in theory, the OS communicates to SQL Server, asking it to give up some of its buffer pool RAM so that it can be used by the other applications. If SQL Server weren’t under memory pressure, then SQL Server would slowly give up some of its RAM, but it won’t be instantaneous. But in our example, SQL Server is already under heavy memory pressure. In this case, SQL Server doesn’t want to give back RAM from the buffer pool, at least not right away, and because of this, the other processes that just kicked in don’t have the RAM they need to run as they should. Because of this, the OS will begin to have to do a lot of paging to the Pagefile, which can negatively affect performance. In extreme cases, the lack of available RAM can create instability in some processes; causing them, or even the OS, to crash.
I think you will agree that the above scenario is not a good thing, and as the DBA, it is your job to prevent such a potential catastrophe. Fortunately, there is a way to do this, and that is to change the default setting for the “max server memory” from its default value of 2147483647, to a value that is smaller than the amount of RAM installed in your server. This way, SQL Server can only use a maximum amount of RAM for the buffer pool, leaving the remaining RAM for the SQL Server services, the OS, and other processes to work without being starved for RAM.
Sound easy, right? Well, sort of. All you have to do is to select a “max server memory” that is big enough so that SQL Server can perform optimally, but not so much that the OS or other processes run out of RAM. The hard part is determining how much RAM is needed by the OS, the parts of SQL Server outside of the buffer pool, and any other processes that you need to run on the server. Unfortunately, there is no single answer, as each SQL Server is different from another and each have different requirements. All I can do is to provide you with a general guideline, then you will have to take it from there, based on your own particular circumstances.
The following recommendations come from Slava Oks’s blog. He works for Microsoft and is intimately familiar with how SQL Server uses memory. Many DBAs I know use his recommendations as a good starting point for determining what the “max server memory” should be. The hard part is taking into consideration all of the possible ways RAM can be used by the OS, SQL Server, and other services or applications running on the physical server. Rather than adding all of these together, which would get difficult, it is better to indirectly calculate the “max server memory” by looking at a Performance Monitor Counter that you are probably already familiar with, and that is Memory: Available MBytes. This counter measures the amount of RAM that is available for allocation by the OS. In other words, it is RAM that is not currently being used.
In order to figure out what value to set the “max server memory” in order to prevent potential server performance and instability problems, essentially you want to ensure that your production server (while under a typical load) has a Memory: Available MBytes in the following ranges.
Note: The following “general” recommendation is based on a 64-bit Windows server running a single instance of the 64-bit version of SQL Server.
| Amount of RAM Installed | Available MBytes |
| < 4 GB | 512 – 1024 MB |
| 4-32 GB | 1024 – 2048 MB |
| 32-128 GB | 2048 – 4096 MB |
| 128+ GB | 4096 MB |
While the above table is a great place to start, it is not the only way to help determine the optimum “max server memory” setting. For example, the PAL tool from Microsoft (pal.codeplex.com) suggests a different method. It recommends that the optimum Available MBytes should be 10% of the installed RAM when the instance is under a typical load. While either option will work as a starting point, the following example will use the data from the table, although you can use either option.
Based on the above recommendations, how do you calculate the value for the “max server memory”? Essentially, you want to use the highest value you can for the “max server memory” that when implemented, results in the Available MBytes as described above.
For example let’s say your server has 32 GB of RAM, that the “max server memory” is set at its default value, and that the Available MBytes, when the server is currently in production under a typical load, is 1024 MB. Based on the above table, a server with 32 GB of RAM should have about 2048 MB of Available MBytes. This means, for this example, that the “max server memory” setting needs to be reduced to the point where the Available MBytes increases to 2048 MB.
So what number should “max server memory” be for the Available MBytes to be around 2048 GB? Well, the only way to really know is to do a little bit of trial and error work. You know that you need to free up 1024 MB of RAM, so what you can do is to lower the “max server memory”, until 2048 MB of Available MBytes shows up in Performance Monitor.
For example, given that there is 32 GB of RAM, I might want to try setting the “max server memory”, to 30720 (30 GB, or 2 GB less than the amount of RAM in the server), and then wait awhile (changes generally occur fairly quickly) for the SQL Server to adjust to this new setting, then check the Available MBytes and see how close it is to 2048 MB. If my guess is too high or too low, then I can try a lower or higher number setting for “max server memory” until I get an Available Mbytes of about 2048 MB.
How do you know where to start the trial and error process? In the above example I used 30 GB, so how did I come up with this number? Roughly speaking, the number I select as a starting point is the amount of RAM in the server minus the Available MBytes number in the chart above. If you look at the chart, you will notice that at 32 GB of installed RAM, that the recommended Available MBytes is 2,048 MB (2 GB). So I subtracted 2 GB from 32 GB to come up with 30 GB. This may or may not be the ideal value for “max server memory”, but using this formula gives you a good starting point from which to experiment. This example presumes that SQL Server engine and the SQL Server Agent are the only active services. If other SQL Server services are installed and running, then I generally add 1-2 GB on top of what the chart says as my starting point, then use trial and error until I find a number that produces the Available MBytes I am shooting for.
This recommendation is not meant to be precise, but to be approximate. So as long as you get close to your goal, you should be fine. You may require several iterations to find a “max server memory” that is best for your server, but eventually you will. And of course, I would recommend that you watch the Available MBytes over time to see that it stays at the 2048MB level, and if this amount changes over time, then you may need to adjust the “max server memory” over time as well to maintain the desired amount of Available MBytes.
OK, now let’s assume that you do identify the optimum “max server memory” setting and that you implement it, but then you notice that SQL Server has now come under memory pressure because you took the RAM it had away before from it? This is possible, and if so, you may need to add more RAM to the server, or take other actions that reduce how much RAM SQL Server needs in order to reduce this extra pressure.
Up to this point, the focus has been on the “max server memory” setting, but what about the “min server memory” setting. Generally speaking, if you are running only a single instance of SQL Server, and if there aren’t a lot of non-SQL Server applications running on it, then leaving this at the default value of “0” is fine. The only reason why you might want to increase this value is if there are other processes (such as another SQL Server instance), that might want to steal the RAM from SQL Server’s buffer pool, and you want to prevent this by specifying a specific minimum amount of RAM is available for an instance. On the other hand, if you are running into problems where other applications are preventing SQL Server from getting the RAM it needs, then you probably need to add more RAM to the server, or move the other applications to another server.
This brings us to a brief discussion of running multiple instances of SQL Server on the same host. Personally, I have not recommended it because of administrative and performance complications. For example, if you do have two or more instances of SQL Server running on the same host computer, you will need to manually set both the “min server memory” and “max server memory” settings for each instance so that one instance doesn’t starve the other instance for RAM. This is a tricky proposition. Because I don’t recommend that you run multiple instances, I am going to leave it up to you to figure out what the best settings are, as guessing what the optimal settings for such a scenario is difficult.
You may have also noticed that the recommendations above have focused on 64-bit SQL Server. This is because 32-bit memory can be difficult to optimize, given the limited RAM you have. But in general, you can use the above recommendations for the minimum and maximum memory settings for 32-bit as well, as a starting point, but this assumes that your 32-bit memory configuration settings are all correct.
max text repl size (1) (2) (3)
This option won’t apply to most instances, but if you are using transactional replication or Change Data Capture; and if any affected tables include text, ntext, varchar(max), nvarchar(max), varbinary(max), xml or image data; and you get error messages related to any of these data types exceeding 65536, then you will need to increase this setting. By default, the “max text repl size” setting is set to 65536, which is the maximum size in bytes that any of the above data types can be if using transactional replication or Change Data Capture. If your data exceeds this maximum, you will get one of several different messages. One fix is not to include these data types in replication or Change Data Capture. But if you have to, then you will need to increase this value to a large enough number, up to 2147483647, so that this data can be handled by SQL Server. But when you do this, you are also increasing the resources SQL Server needs to operate, and performance could degrade as a result.
max worker threads (1) (2) (3)
By default, the “max worker threads” option is set to “0”, which means that SQL Server will automatically calculate the number of worker threads a SQL Server instance uses. A worker thread is an internal process within SQL Server used to perform work, such as execute a query. This option should be left to the default in almost all cases. Under some loads and environments, changing this value can improve performance, but it should only be done by an expert, and thoroughly tested, before implementing it into production; otherwise it is possible for performance to decrease. If you do manually change this setting, the maximum recommended setting for 32-bit systems is 1024, and the maximum setting for 64-bit settings is 2048.
media retention (1) (2) (3)
This option is a remnant of the old days when some DBAs performed backups directly to tape, although the command will work with any backup set. This option sets the instance-level default value for the number of days you want to retain a backup set before it can be overwritten. If you try to overwrite a backup set before the expiration date, then an error message is displayed. In effect, you don’t need to use this option, and it should remain at its default value of “0”. If you for some odd reason want to specify a media retention number, you are better off doing this using the RETAINDAYS option of the BACKUP command, which allows this option to be documented in your Transact-SQL code, instead of being hidden in this setting.
min memory per query (1) (2) (3)
When an execution plan is created for a query, the query optimizer will guess as to how much memory it will take for the query to run, and will attempt to allocate it. By default, 1024 KB of memory, at a minimum, is always allocated, and this is the default value for “min memory per query”. The minimum value is 512 and the maximum value is 2147483647.
In most cases, leaving the “min memory per query” setting at its default value is best. On the other hand, if your server, under full load has over 10% of Available MBytes, and there is no sign of memory pressure whatsoever on the server, increasing the “min memory per query” setting to a higher number may boost performance for complex queries that are processor intensive, especially those that use a lot of hashing and sorting. The downside is that every query is allocated this minimum amount of memory, so increasing this value will quickly use up memory, even for the smallest of queries. If you decide to experiment with this option, be sure to test memory pressure and query performance before and after the change to see if it made any difference, good or bad in performance.
nested triggers (1) (2) (3)
This option determines if AFTER triggers can be nested (cascaded) or not. By default, “nested triggers” is set to “1”, which means this option is on and that nesting is fine. If you want to prevent nested AFTER triggers, then set this option to “0”. It is not recommended that you change this setting as it affects the default behavior of your instance.
network packet size (1) (2) (3)
The “network packet size” setting is a misnomer. According to Books Online, “Use the network packet size option to set the packet size (in bytes) used across the entire network. Packets are the fixed-size chunks of data that transfer requests and results between clients and servers. The default packet size set by SQL Server is 4,096 bytes.” The problem with this explanation is that the explanation ignores something very important, that your network couldn’t really care less about this setting. In other words, it is your network, not SQL Server, that really determines the size of packets sent across the network.
Generally speaking, if you are using an Ethernet network, network packets are generally 1500 bytes in size, much smaller than the 4,096 setting used by the “network packet size” setting. This means that if SQL Server is trying to send 4,096 byte packets, it really isn’t. What happens is that SQL Server passes off the data to the network to be sent, and Ethernet networks chop this up into packets up to 1500 bytes in size. In order to send more than 1500 bytes at a time on an Ethernet network, all aspects of the network must support what are called Jumbo Frames, which can support up to 9000 bytes. In other words, to really benefit from the “network packet size” setting, you need to also implement Jumbo Frames in your Ethernet network.
If your Ethernet network supports Jumbo Frames, then increasing the “network packet size” setting from 4,096 to 8,060 can help in situations where a lot of data needs to be moved quickly, such as when performing some SSIS or backup operations. OLTP applications will probably not benefit from Jumbo Frames. The 8,060 upper limit is recommended because using a number higher than this, depending on the server, can result in error messages and a litany of different problems.
So my recommendation for the “network packet size” setting is to leave it at its default setting. Only SQL Server experts, who are also experts in networking, should attempt to change this setting in order to boost performance. This is not to say that changing this setting might help in some cases, as it can, but the cases where it can help performance are edge cases and should be left to the experts who have a lot of experience in this area.
Ole Automation Procedures (1) (2) (3)
Transact-SQL batches offer the ability to use OLE Automation objects to perform a variety of tasks, such as to access the file system and create a file. Some of the system stored procedures that allow this include: sp_OACreate, sp_OAMethod, sp_OADestroy, among others. This is a legacy feature of SQL Server that should not be used today. Most DBAs who need this capability use CLR code instead, as it is more efficient and secure.
By default, the “Ole Automation Procedures” option is used to turn all of OLE Automation capability off, using the setting of “0”. This reduces the security surface area by preventing any of the OLE Automation system stored procedures to execute. Leave this option to off, unless you have some legacy code that requires its use.
open objects (5)
This feature is depreciated and should not be used. In fact, it only exists for backward compatibility with legacy scripts, and changing its value has no effect on SQL Server’s behavior. This option should always stay at its default value of “0”.
optimize for ad hoc workloads (2) (3)
The “optimize for ad hoc workloads” option was introduced in SQL Server 2008. To understand what this option does when it is turned on, you first must understand what happens when it is off.
Generally speaking, when an ad hoc query is run in SQL Server, a query plan is created and stored in the plan cache. The next time the same ad hoc query is run, the query optimizer can use the existing execution plan stored in the plan cache instead of taking the time and resources to create a new execution plan. This way, over time as the same ad hoc query runs over and over, the overall performance of SQL Server is boosted. Assuming that the same ad hoc plans are used over and over, this is a great behavior built into SQL Server. Unfortunately, you can’t assume that an ad hoc plan will be used more than once. Depending on the application that is creating the ad hoc queries, it is quite possible that the great majority of ad hoc queries are never reused. Is this a bad thing? It can be. If a lot of ad hoc queries have their execution plans stored in the plan cache, and if they are never reused, then a lot of plan cache may be wasted that could be better put to use by SQL Server. This particular problem is known as “plan cache bloat”.
So if your instance has “plan cache bloat”, what can you do about it? That’s where the “optimize for ad hoc workloads” option comes into play. When this option is turned on, the plan caching behavior of ad hoc queries change. Here’s what happens. When an ad hoc query is submitted to the query optimizer for the first time, an execution plan is created and the query is executed. Normally, this also mean that the execution plan is cached in the plan cache. But with “optimize for ad hoc workloads” option turned on, the very first time an ad hoc query is executed, the entire execution plan is not stored in the plan cache. Instead of the entire execution plan, what is stored instead is what is called a compiled plan stub. Essentially, this stub has just enough data so that the next time the same ad hoc query is executed, the query optimizer recognizes that the ad hoc query has run before, and now this time around, the execution plan will be recreated and will be stored in the plan cache. The net result of this is that if an ad hoc query is only run once, then only a small stub is stored in the data cache, using very little memory. If your instance experiences a lot of these one-time ad hoc queries, then the “plan cache bloat” problem goes away, freeing up RAM that can better be put to use by the SQL Server data cache to boost performance.
So should you change the “optimize for ad hoc workloads” option from its default of off (“0”) to on (“1”)? If you find out if your instance suffers from “plan cache bloat”, then yes, as this option can free up a lot of wasted RAM that can be better used by SQL Server. But as with any of these suggestions, you should only turn it on if you know that your instance suffers from “plan cache bloat,” and of course, you should test the performance of your server before and after the change to see how much performance boost you get, if any, from making the change.
PH_timeout (1) (2) (3)
This option is only relevant for instances using Full-Text Search. In order for the Full-Text Search engine to index data stored in tables, is must first connect to the SQL Server engine using the Protocol Handler portion of the Filter Daemon Host process. This is similar to how any client connects to SQL Server to access data from tables. By default, the attempted connection times out in 60 seconds if SQL Server doesn’t respond. The “PH_timeout” option is used to specify the time out value. The default value is “60”, and can be as high as “3600”. The only time you might need to use this option is if there are network issues preventing the connection from connecting in the specified time period. A better solution would be to fix the network problem, not increasing the time out value.
precompute rank (1)
This option is only relevant for instances using Full-Text Search. In addition, its functionality has been removed from SQL Server 2008 and higher (although you can still see it when you run SP_CONFIGURE). In SQL Server 2005, this feature is used to help improve the performance of FREETEXTTABLE queries that use the top_n_by_rank parameter. The “precompute rank” feature is turned off by default (“0”), and it is recommended that it remain off, unless you have specifically tested the option and can confirm that it helps, rather than hinders, performance.
priority boost (1) (2) (3) (5)
This option has been depreciated and should not be used. The purpose of “priority boost” is to manually force Windows to give SQL Server a higher CPU scheduling priority. The problem is that when turned on, it can potentially starve the OS from needed CPU cycles, resulting in shutting down SQL Server, causing unexpected failovers in a cluster, or causing some OS operations to become unresponsive. This option should never be used.
query governor cost limit (1) (2) (3)
This option is seductive, in that it gives you the illusion that you are able to prevent long running queries from executing on your server. The problem is that while the concept is good, the execution is poor. The “query governor cost limit” option, by default is set to “0”. This means that any query can execute on your instance and take as long as it wants to run. In theory, if you change the default value to any number between 1 and 2147483647 (these represent seconds), then if the query optimizer thinks the query will take longer than “n” seconds to run, then it will prevent the query from running in the first place, preventing the query from tying up SQL Server’s resources. This feature sounds great to DBAs.
Unfortunately, there are a number of problems with this option. Some of them include:
- This setting is instance-wide, which means that all queries could potentially be affected, even known long running queries that literally take a long time to run, such as a yearly report. In other words, it can prevent legitimately long running queries from running at all.
- The query optimizer has to guess how long it thinks a query will take to run. It makes this guess by using the index and columns statistics that are available to it. So if any statistics that the query optimizer looks at is out of date, or highly skewed, then it can’t make a very good guess, and there will be cases where very fast queries may be cancelled and long queries still be allowed to run. And even if all the statistics are perfect, the query optimizer doesn’t know the speed of your IO system or how busy it is, so any guesses it makes are just that, guesses.
- Because the query optimizer is just guessing, sometimes it might let a query run, and the next time it might not let it run. This would cause you a huge number of headaches as users complained about not being able to run their applications.
Because of the potential problems with the “query governor cost limit” option, I recommend that it not be used. If you need the capability to deal with long-running, resource-intensive queries, and assuming you have the Enterprise Edition of SQL Server 2008 or higher, then you should use the Resource Governor to control how much CPU utilization is assigned to resource-intensive queries. If you don’t have the Enterprise Edition of SQL Server 2008 or higher, another option would be to identify long running queries (using DMVs, Profiler, or a third-party monitoring application) so that you can track down who ran it and be able to find out how the query might be optimized for better performance.
query wait (1) (2) (3)
Most DBAs don’t realize that some queries submitted to the query optimizer may not be instantly executed. For example, if a complex query is submitted to a server under memory pressure, SQL Server many not be able to instantly allocate it the memory it needs to run, and will therefore put the query in a queue. Once the memory resources become available, then the query is removed from the queue and executed. If the server is under tremendous memory pressure, it is possible that a query in the queue may time out, sending an error message to the client application. In addition, the waiting query may result in blocking locks, or even deadlocks, if it is part of a larger transaction, because the query cannot be completed. Of course, if your instance has plenty of memory, this should never be a problem.
The “query wait” configuration option allows you to manually change how long a query will wait in the queue before it times out. The default setting is “-1”, which means, according to Books Online, “the time-out value is calculated by SQL Server (25 times the estimated cost of the query)”. This seems to me to be an odd calculation, as the estimated cost of a query is not a measurement of time, but just a number that allows you to compare the relative cost of one query to another. But if taken literally, if the cost of a query happens to be 10, then if you multiply that by 25, the query will time out after being in the queue for 250 seconds. Of course, the cost of a query is based on the index and column statistics available to the query optimizer, and if the statistics are out of date or skewed, then the estimate may be significantly different than the actual cost, further complicating this time-out calculation.
If you don’t like the results the default calculation provides, you can use the “query wait” option to set your own time-out value in seconds, with a range from 1 to 2147483647. Microsoft recommends that the default setting not be changed, and I agree as well. If your instance is returning errors related to queries times out due to a lack of memory, the solution is to tune the problematic queries, or to add more RAM to the server.
recovery interval (1) (2) (3)
A recovery interval is the amount of time it takes SQL Server to recover all of the databases on an instance after it is restarted. This includes rolling back uncommitted transactions and rolling forward committed transactions that were not written to the MDF file when the instance stopped.
The amount of time that it takes to recover a server is strongly influenced by the “recovery interval” configuration option. The default setting is “0”, which tells SQL Server to automatically determine the recovery interval. In most cases on a busy production server, this means a recover interval of less than a minute, but there are exceptions. The “recovery interval” option only takes into account the amount of time to roll forward transactions, not the time it takes to roll back uncommitted transactions. So if it takes 15 minutes to roll back an uncommitted transaction, then the recovery interval would be at least 15 minutes.
SQL Server helps to control how long the recovery interval will be by determining how often checkpoints occur. In general, the more often checkpoints occur, the shorter the recovery interval; and the less often checkpoints occur, the longer recovery interval is. But what is important to understand is that SQL Server does not use time to determine when a checkpoint is to occur, but instead uses the amount of data that is changed in a database. In other words, for databases with few data modifications, checkpoints may not occur very often. For databases with many data modifications, checkpoints may occur very often. The end result of all this is that changing the “recovery interval” directly affects how often checkpoints occur.
When the “recovery interval” option is changed from its default value of “0”, the number you enter (1 – 32767) refers to the maximum number of minutes that SQL Server guesses it will take to recover a server. For example, if you set “recovery interval” to 5, then SQL Server will try to enforce a maximum recovery time of 5 minutes (subject to the limitation of rolling back long-running transactions). As a result of increasing the recovery time, the number of checkpoints will also be reduced, and this brings us to why you might want to consider changing the “recovery interval” option.
One reason that the “recovery interval” is increased is in order to reduce how often checkpoints occur. For example, if you notice that frequent checkpoints cause significant IO problems, then you might be able to reduce this IO contention by reducing how often checkpoints occur. But this is a two-edged sword. Even though checkpoints will occur less often, when they do occur, they will take longer to complete, as they still have to do the same amount of disk IO. In effect, changing how often a checkpoint occurs only delays the inevitable. In some cases, doing this might help IO contention, and in other cases, it might hurt IO contention.
My recommendation is to leave this setting at its default. If you have IO contention that occurs during checkpoints, I instead recommend taking the following action(s):
- Ensure that the virtual log files in the transaction log are set appropriately, as too many virtual log files can increase checkpoint IO.
- Isolate log files on their own disk array.
- Ensure that disk latency is less than 5 ms for reads and writes, with an ideal goal of keeping them under 2 ms. Use whatever IO hardware (RAID 10, lots of spindles) as necessary to attain this performance.
If you follow the above recommendations, then the likelihood of checkpoints causing IO contention is significantly minimized.
remote access (1) (2) (3) (5)
This option is deprecated and should not be used. It only exists for backwards compatibility with the sp_addserver command, which is also deprecated. Instead, use the sp_addlinkedserver command.
remote admin connections (1) (2) (3)
The “remote admin connections” option determines if a sysadmin can connect to a remote SQL Server using the DAC (Dedicated Administrator Connection). By default, the setting is “0”, which means that a sysadmin cannot connect to a remote SQL Server using the DAC. This is done in order to reduce the security surface area of SQL Server. But since most SQL Server instances are remotely managed, and in spite of increasing the security surface area, I suggest this option be turned on for all remotely managed SQL Server instances. If it is not turned on, and if you can’t physically access the server directly, and a problem arises that only can be fixed through the use of the DAC, then you are out of luck. Set the “remote admin connections” to “1” to turn it on.
remote login timeout (1) (2) (3)
The “remote login timeout” option simply controls the number of seconds you have to wait until you are notified of a failed login to a remote server. The default setting is 20 seconds with a range of 1 to 2147483647 (sixty-eight years!). While you can change this to suit your needs, I don’t see any point in changing it for most servers.
remote proc trans (1) (2) (3) (5)
This feature is deprecated and should not be used. It is used to provide backward compatibility with applications that use remote stored procedure calls within the context of a MSDTC transaction. Instead, the recommendation is to use distributed queries and linked servers.
remote query timeout (1) (2) (3)
The “remote query timeout” option determines how long a remote query waits until it times out. In other words, once a remote query is initiated, if the query doesn’t return any results within this period, the query times out. The default setting is 20 seconds (or 600, depending on your version of SQL Server) with a range of 1 to 2147483647. If your remote queries time out, first try to tune them so they run faster. If they are running as fast as they can, but take longer than the “remote query timeout” option setting, then increase this value to the number of seconds that will cover the time of your longest running remote query.
Replication XPs Option (1) (2) (3)
This option is not documented by Microsoft and is apparently reserved for internal use. Leave this option at its default value of “0”.
scan for startup procs (1) (2) (3)
A startup stored procedure is a stored procedure that is automatically executed every time SQL Server starts up. In order to use startup stored procedures, the “scan for startup procs” has to be changed from its default value of “0” to “1”. Actually, you don’t have to perform this task yourself, as when you use the sp_procoption system stored procedure to designate a stored procedure as a startup stored procedure, SQL Server will automatically change this setting for you. Only turn this option on if you are using startup stored procedures.
server trigger recursion (1) (2) (3)
By default, the “server trigger recursion” option is set to “1”, which means that server-level triggers are permitted to fire recursively. If you want to turn off direct trigger recursion (not indirect trigger recursion), change the option to “0”. Only make this change if your application requires this setting, as it changes the expected behavior of SQL Server.
set working set size (5)
This option is deprecated and its functionality has been turned off.
show advanced options (1) (2) (3)
The instance-level configuration options described in this section are divided into “regular” and “advanced” options. By default, you can only view and change “regular” options. In order to view or change “advanced options”, then the “show advanced options” must be changed from its default value of “0” to “1”. I recommend that this setting be set to “1” so that you can view and modify advanced options as needed.
SMO and DMO XPs (1) (2) (3)
By default, SMO (SQL Management Objects) and SQL-DMO (SQL Distributed Management Objects) are turned on, allowing applications to access SQL Server via SMO or SQL-DMO). This is a good thing, as if this option is turned off (set to “0”), SSMS, PowerShell, or any application that needs to access SQL Server via SMO or SQL-DMO will not connect. This option should not be changed from its default value of “1”.
SQL Mail XPs (1) (2) (3) (5)
This option is deprecated and should not be used. SQL Mail is SQL Server’s old way to send mail. Instead, use Database Mail. This setting should remain at its default value of “0”.
transform noise words (1) (2) (3)
This option only affects instances that use Full-Text Search. If you create full-text queries that use the CONTAINS predicate, and the query also includes a Boolean operation that includes a noise word, a run-time error will occur. This is because, by default, noise words are not transformed by the Full-Test Search Engine. If you want to override this behavior, you can change the “transform noise words” option from the default value of “0” to “1”. After making this change, the error messages will go away because SQL Server replaces the noise words with an “*” for phrase queries. Using a “*” in a full-text query specifies that the query will search all full-text indexed columns in the specified table. Only use this option if you are fully aware of the implications of this behavior change.
two digit year cutoff (1) (2) (3)
This option is designed for dealing with applications that use a two-digit year instead of a four-digit year. Because two-digit years are ambiguous as to which century they belong to, SQL Server has to make an assumption about which century a two-digit year belongs to. By default, SQL Server assumes that any two-digit date of 49 or smaller belongs in the twenty-first century, and that any two-digit date of 50 or more belongs to the twentieth century. If this assumption does not produce the results you expect, then you can change SQL Server’s default behavior by using the “two digit year cutoff” option and setting it from the default value of “2049” to any year that works for your application. Only change if required by an application. Better yet, rewrite the application so that it uses a four-digit year.
user connections (1) (2) (3)
SQL Server automatically determines the maximum number of connections it needs, up to the limit specified in the “user connections” option. If “user connections” is set to its default value of “0”, then the maximum number of connections is 32,767 (depending on the version of SQL Server being used and the hardware resources available). In almost all cases, the “user connections” option should remain at “0”.
Keep in mind that the number of user connections doesn’t literally mean the number of users who can connect to SQL Server, as multiple users can share a single connection, and applications can also create connections. Instead of thinking of “user connections,” it is better to think in terms of “connections.” This way, there is less chance of becoming confused as to what this option actually limits.
In some edge cases, it might be desirable to limit the number of connections a particular instance can use in order to reduce its load. However, while reducing the maximum allowed number of connections can reduce the load on an instance, it will also prevent all the users who want to connect from connecting, which could be problematic. If your problem you are trying to fix with this option is trying to not overload a SQL Server instance, there are many other options available that you should explore before trying this option.
user options (1) (2) (3)
Whenever a new connection is established with SQL Server, a number of default global SET options (not all available SET options are affected by this option) are automatically used. To find out what these options are (as they can vary), run the following statement in a query window.
|
1 2 |
DBCC USEROPTIONS ; GO |
In the United States, the following are the default SET options used for new connections.
These default SET options include:
| Set Option | Value |
| textsize | 2147483647 |
| language | us_english |
| dateformat | mdy |
| datefirst | 7 |
| lock_timeout | -1 |
| quoted_identifier | SET |
| arithabort | SET |
| ansi_null_dflt_on | SET |
| ansi_warnings | SET |
| ansi_padding | SET |
| ansi_nulls | SET |
| concat_null_yields_null | SET |
| isolation level | read committed |
The “user options” configuration option can be used to change these default SET options on an instance-wide level if desired by changing the default value of “0” to a number corresponding to which SET options you would prefer to have. Changing this option can have unexpected results, such as breaking applications that assume that the default SET options are the ones that are used. Because of this, don’t change this setting. Instead, if you want to change the SET options for a connection, change them at the time the connection is created using the SET command. This gives you much more flexibility than changing them at the instance level.
Web Assistant Procedures (1)
This option was deprecated in SQL Server 2005 and removed from SQL Server 2008 and later. Do not use this option.
xp_cmdshell (1) (2) (3)
The xp_cmdshell command allows commands to be passed to the operating system. By default, xp_cmdshell is turned off in order to reduce the security surface area of SQL Server, as accessing the operating system entails a number of security risks. If you need to use this command, you can change the default setting of “0” to “1”, but only do so if you understand the security implications of doing so.
We have finally got to the end of the instance-wide configuration settings. This was a lot of work, but as you can see, many of these settings can have a significant impact, positive or negative, if they aren’t set correctly. That’s why it is so important that these settings be optimized for your particular environment.
Summary
The goal of this article was to get you thinking about the 70 or so SQL Server instance-level settings available to you, and how their settings can have a significant effect on an instances’ behavior, performance and availability. Hopefully, by now you have a good feeling for what each of the settings do, and what each setting should be. On the other hand, this article can’t offer every detail about every setting. If you are still unclear about some of these settings, or are considering changing some of them from their default values, be sure to take some extra time to learn more about the property settings by reading about them in Books Online and by searching for more information about them on the web. Knowledge is the DBA’s most powerful weapon, so use it wisely.
Acknowledgements
PowerShell Scripts by Phil Factor
Load comments