
SQL Server Business Intelligence Development Studio (BIDS) provides several tools you can use to troubleshoot the data flow of a SQL Server Integration Services (SSIS) package. The tools let you sample a subset of data, capture data flow row counts, view data as it passes through data paths, redirect data that generates errors, and monitor package execution. You can use these tools for any package that contains a data flow, regardless of the data’s source or destination or what transformations are being performed.
The better you understand the debugging tools, the more efficiently you can troubleshoot your data flow. In this article, I demonstrate how each debugging tool works. To do so, I set up a test environment that includes a comma-separated text file, a table in a SQL Server database, and an SSIS package that retrieves data from the text file and inserts it into the table. The text file contains data from the Person.Person table in the AdventureWorks2008R2 database. To populate the file, I ran the following bcp command:
|
1 |
bcp "SELECT TOP 10000 BusinessEntityID, FirstName, LastName FROM AdventureWorks2008R2.Person.Person ORDER BY BusinessEntityID" queryout C:\DataFiles\PersonData.txt -c -t, -S localhost\SqlSrv2008R2 -T |
After I created the file, I manipulated the first row of data in the file by extending the LastName value in the first row to a string greater than 50 characters. As you’ll see later in the article, I did this in order to introduce an error into the data flow so I can demonstrate how to handle such errors.
Next I used the following Transact-SQL script to create the PersonName table in the AdentureWorks2008R2 database:
|
1 2 3 4 5 6 7 8 9 10 11 12 |
USE AdventureWorks2008R2 GO IF OBJECT_ID('dbo.PersonName') IS NOT NULL DROP TABLE dbo.PersonName GO CREATE TABLE dbo.PersonName ( NameID INT PRIMARY KEY, FullName NVARCHAR(110) NOT NULL ) |
After I set up the source and target, I created an SSIS package. Initially, I configured the package with the following components:
- A connection manager to the AdventureWorks2008R2 database.
- A connection manager to the text file with the source data.
- An Execute SQL task that truncates the PersonName table.
- A Data Flow task that retrieves data from the text file, creates a derived column, and inserts the data into the PersonName table.
Figure 1 shows the data flow components I added to the package, including those components related to troubleshooting the data flow.
NOTE: You can download the SSIS package from the bottom of the article.
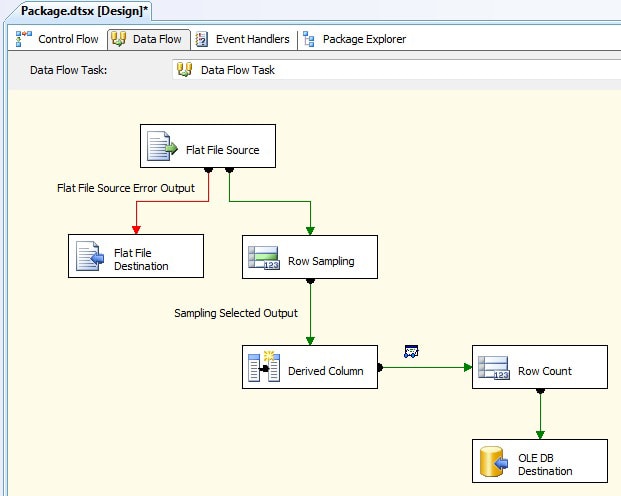
Figure 1: Setting up the data flow in the sample SSIS package
The data flow components specific to processing the Person data are the OLE DB Source, Derived Column, and OLE DB Destination components. The Derived Column transformation concatenates the first and last names into a single column named FullName. The other components in the data flow are specific to debugging and are discussed in detail in the rest of the article.
Working with a Data Sample
When you’re developing an SSIS package that retrieves large quantities of data, it can be helpful to work with only a subset of data until you’ve resolved any issues in the data flow. SSIS provides two data flow components that let you work with a randomly selected subset of data. The Row Sampling Transformation component lets you specify the number of rows you want to include in your random data sample, and the Percentage Sampling Transformation component lets you specify the percentage of rows.
Both components support two data outputs: one for the sampled data and one for the unsampled data. Each component also lets you specify a seed value so that the samples are the same each time you run the package. (The seed value is tied to the operating system’s tick count.) When you don’t specify a seed value, the data sample is different each time you run the data flow.
If you refer back to Figure 1, you’ll see that I added a Row Sampling Transformation component right after the Flat File Source component. Figure 2 shows the Row Sampling Transformation Editor. Notice that I configured the component to retrieve 1000 rows of sample data, but I did not specify a seed value.
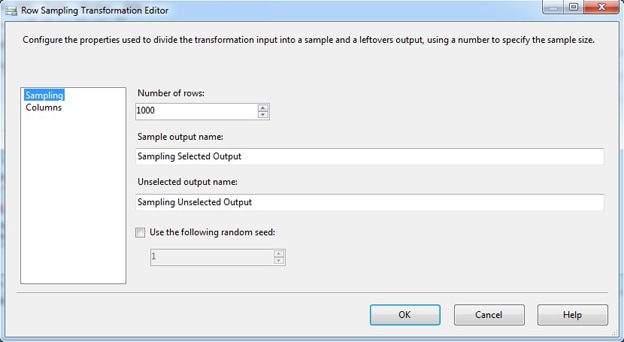
Figure 2: Selecting a data sample from the data flow
If you want, you can name the outputs for the sample and non-sample data. In this case, I’ve left the default names and used the Sampling Selected Output data path to connect to the next component in the data flow. Now the data flow will include only the random 1000 rows.
Verifying Row Counts
When data passes through a data flow, the SSIS design surface displays the number of rows passing along each data path. The count changes as data moves through the pipeline. After the package has finished executing, the number displayed is the total number of rows that passed through the data path in the last buffer. If there were multiple buffers, the final number would not provide an accurate count.
However, you can add a Row Count Transformation component to the data flow. The transformation provides a final count that adds together the rows from all buffers and stores the final count in a variable. This can be useful when you want to ensure that a particular point in the data flow contains the number of rows you would expect. You can then compare that number to the number of rows in your source or destination.
To retrieve the row count from the variable, you can use whatever method you like. For instance, you can create an event handler that captures the variable value and saves it to a table in a SQL Server database. How you retrieve that value is up to you. The trick is to use the Row Count Transformation component to capture the total rows and save them to the variable.
In my sample SSIS package, I created a string variable named RowCount, then, after the Derived Column component, I added a Row Count Transformation component. Figure 3 shows the component’s editor. The only step I needed to take to configure the editor was to add the variable name to the VariableName property.
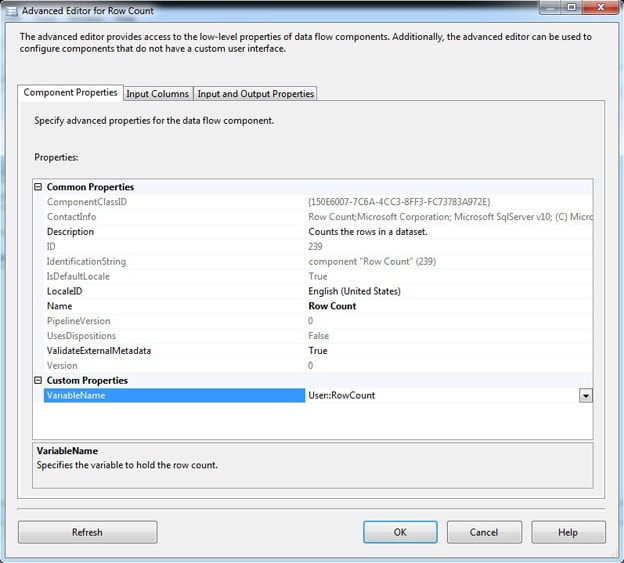
Figure 3: Verifying the row counts of data passing along a data path
When the package runs, the final count from that part of the data flow will be saved to the RowCount variable. I verified the RowCount value by adding a watch to the control flow, but in an actual development environment, you’d probably want to retrieve the value through a mechanism such as an event viewer, as mentioned above, so you have a record you can maintain as long as necessary.
Adding Data Viewers to the Data Path
When troubleshooting data flow, it can be useful to view the actual data as it passes through a data path. You can do this by adding one or more data viewers to your data flow. SSIS supports several types of data viewers. The one most commonly used is the grid data viewer, which displays the data in tabular format. However, you can also create data viewers that display histograms, scatter plot charts, or column charts. These types of data viewers tend to be useful for more analytical types of data review, but for basic troubleshooting, the grid data viewer is often the best place to start.
To create a grid data viewer, open the editor for the data path on which you want to view the data, then go to the Data Viewers page, as shown in Figure 4.
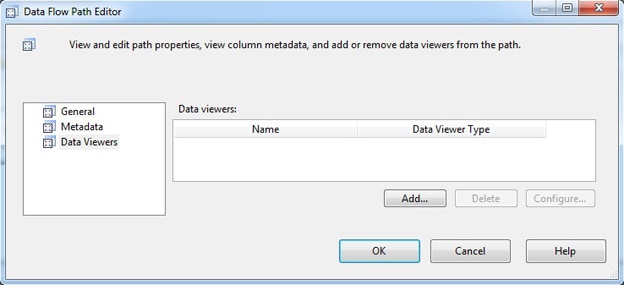
Figure 4: Editing the properties of the data flow path
The Data Flow Path editor is where you add your data viewers, regardless of the type. To add a data viewer, click the Add button to launch the Configure Data Viewer dialog box, shown in Figure 5. Here you select the type of viewer you want to create and provide a name for that viewer.
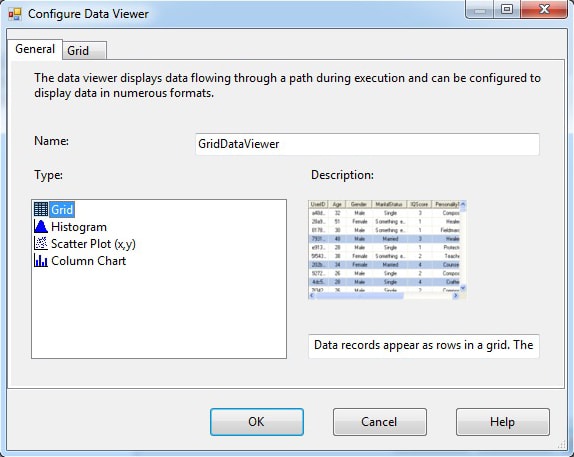
Figure 5: Creating a grid data viewer on a data path
After you select the Grid option from the Type list and provide a name, go to the Grid tab, shown in Figure 6. This is where you determine what columns you want to include in the grid. At this point, we’re interested only the BusinessEntityID and FullName columns because those are the columns in our target table.
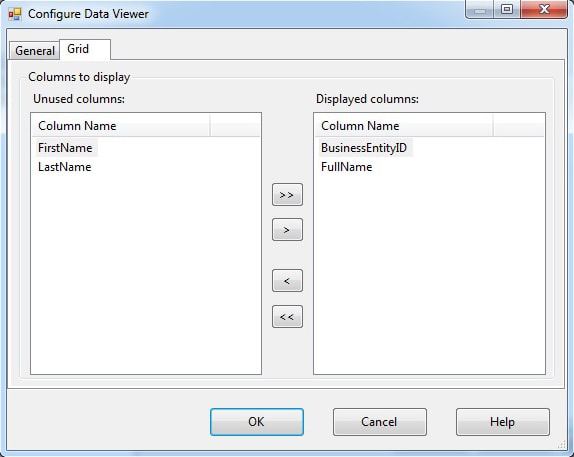
Figure 6: Configuring a grid data viewer
After you specify the columns to include in the grid, click OK. You’ll be returned to the Data Flow Path Editor. The new grid data viewer should now be displayed in the Data Viewers list. In addition, a small icon is added next to the data path (shown in Figure 1).
When you debug a package in which a data viewer has been defined, the package will stop running at the viewer’s data path and a window will appear and display the data in that part of the data flow. Figure 7 shows the grid data viewer I configured on my data flow.
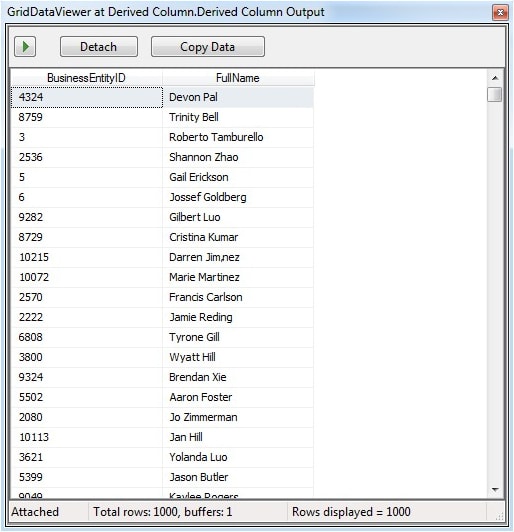
Figure 7: Viewing sample data through a grid data viewer
Notice that the data viewer displays the BusinessEntityID and FullName values for each row. You can scroll down the list, detach the viewer from the data flow, resume the data flow, or copy the data to the clipboard. The data itself and the ultimate outcome of the package are unaffected.
Configuring Error-Handling on the Components
Many data flow components let you specify how to handle data that might generate an error. By default, if data causes an error, the component fails; however, you can configure some components to redirect problem rows. For instance, if you refer back to Figure 1, you’ll see that the Flat File Source has an additional data path output, which is red. You can use the red data path to capture any bad rows outputted by the component, when the component is properly configured.
I connected the red data path to a Flat File Destination component so I can store rows the generate errors to a text file. When you connect an error output to another component, the Configure Error Output dialog box appears, as shown in Figure 8. Notice that for each column, you can configure what action to take for either errors or truncations. An error might be something like corrupt data or an incorrect data type. A truncation occurs if a value is too long for the configured type. By default, each column is configured to fail the component whether there is an error or truncation.
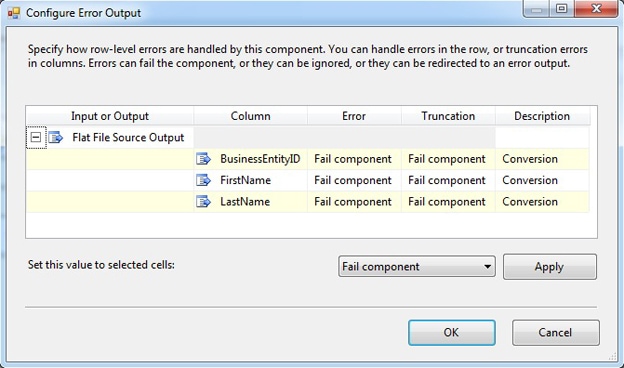
Figure 8: Configuring a data flow component to redirect rows
You can override the default behavior by specifying that the row be redirected. In this case, I chose to redirect all columns whether there was an error or truncation. To do so, I changed the Error and Truncation options for each row and column to Redirect row. Next, I configured the Flat File Destination component with a new data source that points to a text file that will be used to capture the outputted rows, if there are any errors or truncations. As you’ll recall from earlier in the article, I modified the last name in the first row of the source file by making the last name too long. As a result, I would expect the first row to fail and be redirected to the new error file.
When you configure the destination component and connection manager, you’ll notice that one column is created for the outsourced row, one column for the numeric error code, and one column for the identifier of the source column that generates the error. When a row is redirected to the error output, it is saved to the error file, along with the error number and column identifier. The values in the redirected row are separated by commas, but treated as one value.
Monitoring Package Execution
The final tools for troubleshooting the data flow are related to the package execution and SSIS design surface. When a package is running, you can watch the data flow to see what is happening with each component. Row counts are displayed next to the data paths and the components change colors as they’re being executed. By observing these colors, you can observe the state of execution:
- White. Component has not yet been executed.
- Yellow. Component is currently extracting, transforming, or loading data.
- Green. Component has completed its operation.
- Red. Component generated errors and package execution stopped.
Of course, if a component turns red, you have a problem. But sometimes a component will turn yellow and hang there. In which case, you still have a problem. However, if everything is running fine, the components will first turn yellow and then green, as shown in Figure 9.
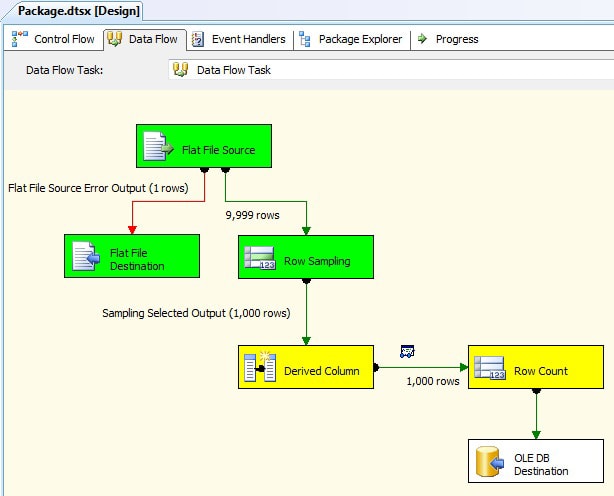
Figure 9: Viewing the data flow progress on the design surface
Notice that the number of rows that passed through the data paths during the last buffer show up on the design surface. As you can see, one row has been redirected to the error file. Also, there are 9,999 rows in the data path that leads to the Row Sampling transformation, but only 1,000 rows after the transformation.
If an execution is not successful (red or hanging yellow), you should refer to the Progress tab for information about the package execution. There you can find details about each component and the data that is flowing through those components. Figure 10 shows the Progress tab after I finished running my package.
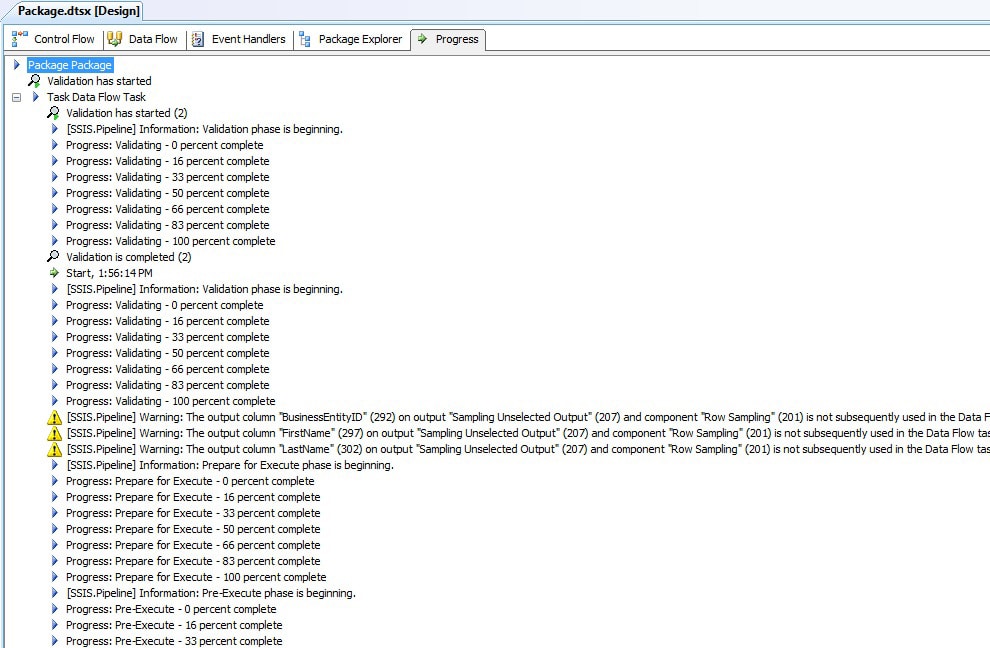
Figure 10: Viewing the Progress tab during package execution
Notice that the Progress tab shows details about the Data Flow task and its data pipeline. The details shown here are only part of the displayed information. You need to scroll down to view the rest. However, as you can see, there are several warning messages, along with all the information messages. In this case, the warning messages indicate that the unsampled data is not being used, as we already knew. But some warnings can be useful information to have. In addition, the Progress tab also displays error messages, along with all the other events that are fired during execution.
The Data Flow Debugging Tools
You might not need to use all the tools that SSIS provides for debugging your data flow, but whatever tools you do implement can prove quite useful when trying to troubleshoot an issue. By working with data samples, monitoring row counts, using data viewers, configuring error-handling, and monitoring package execution, you should be able to pinpoint where any problems might exist in your data flow. From there, you can take the steps necessary to address those problems. Without the SSIS troubleshooting tools, locating the source of the problem can take an inordinate amount of time. The effort you put in now to learn how to use these tools and take advantage of their functionality can pay off big every time you run an SSIS package.
This document contains proprietary information and is protected by copyright law.
Copyright © 2026 Red Gate Software Limited. All rights reserved


Load comments