
So much about parameters tuning, but does it always help?
Welcome to the third and final blog of the “magic of parameters” series. In two previous blogs, we discussed how tuning PostgreSQL parameters could help improve overall system performance. However, the very first paragraph of the very first blog on this topic stated that:
Although some parameter tuning can indeed improve the database performance, we are usually talking about 10%, 20%, and in rare cases, up to 50% performance improvement if some parameters are set poorly. That might sound like impressive numbers, but individual query optimization routinely makes queries run several times faster, in some cases, ten or more times faster, and restructuring applications can improve overall system performance by hundreds of times!
In this first blog, we didn’t provide any examples of the practical impact of parameters tuning on performance. Indeed, it is challenging to model such an impact on the training database.
In this blog, we will segue from discussing PostgreSQL system parameters best practices to other ways of performance tuning. Moreover, we will demonstrate that essential database performance tuning goes beyond choosing the appropriate parameters settings.
Measuring impact
With this in mind, let’s examine the impact of parameters modifications and alternative ways of performance tuning. To run our experiments, we will use a database that I have created for performance tuning examples: postgres_air database. If you want to repeat the experiments described in this article, download the latest version of this database (file postges_air_2023.backup) and restore it on a Postgres instance where you are going to run these experiments. We suggest that you do it on your personal device or any other instance where you have a complete control of what’s going on, since you will need to restart the instance a couple of times during these experiments. We ran the examples on version 15.2, however, they will work the same at a minimum on versions 13 and 14.
The restore will create a schema postgres_air populated with data but without any indexes except for the ones which support primary/unique constraints. To be able to replicate the examples, you will need to create a couple of additional indexes:
|
1 2 3 4 5 6 7 8 9 |
SET search_path TO postgres_air; CREATE INDEX flight_departure_airport ON flight(departure_airport); CREATE INDEX flight_arrival_airport ON flight(arrival_airport); CREATE INDEX flight_scheduled_departure ON flight (scheduled_departure); |
Let’s examine the execution plan of the query which calculate the number of passengers on each flight:
|
1 2 3 4 5 6 7 8 9 10 11 12 13 |
SELECT f.flight_no, f.actual_departure, count(passenger_id) passengers FROM postgres_air.flight f JOIN postgres_air.booking_leg bl ON bl.flight_id = f.flight_id JOIN postgres_air.passenger p ON p.booking_id=bl.booking_id WHERE f.departure_airport = 'JFK' AND f.arrival_airport = 'ORD' AND f.actual_departure BETWEEN '2023-08-08' and '2023-08-12' GROUP BY f.flight_id, f.actual_departure; |
First, we will run it with default memory allocation parameters:
|
1 2 |
shared_buffers=128MB work_mem=4MB |
Note: to check the parameters settings, you can run show all command for a complete list of parameters or show <parameter_name> for a specific parameter value. So executing SHOW work_mem will return the current setting of that parameter.
To make sure we compute not only the execution plan itself, but also the actual runtimes and buffers usage, execute the EXPLAIN command with the following parameters:
|
1 2 |
EXPLAIN (ANALYZE, BUFFERS, TIMING) SELECT … |
The execution plan for this query is presented in Figure 1. Your results may differ a bit, especially in some of the actual numbers, but should be very similar if you restored a copy of the Air database and added the indexes that were indicated. The query plan will show up in text as a result set in whatever tool you are using.
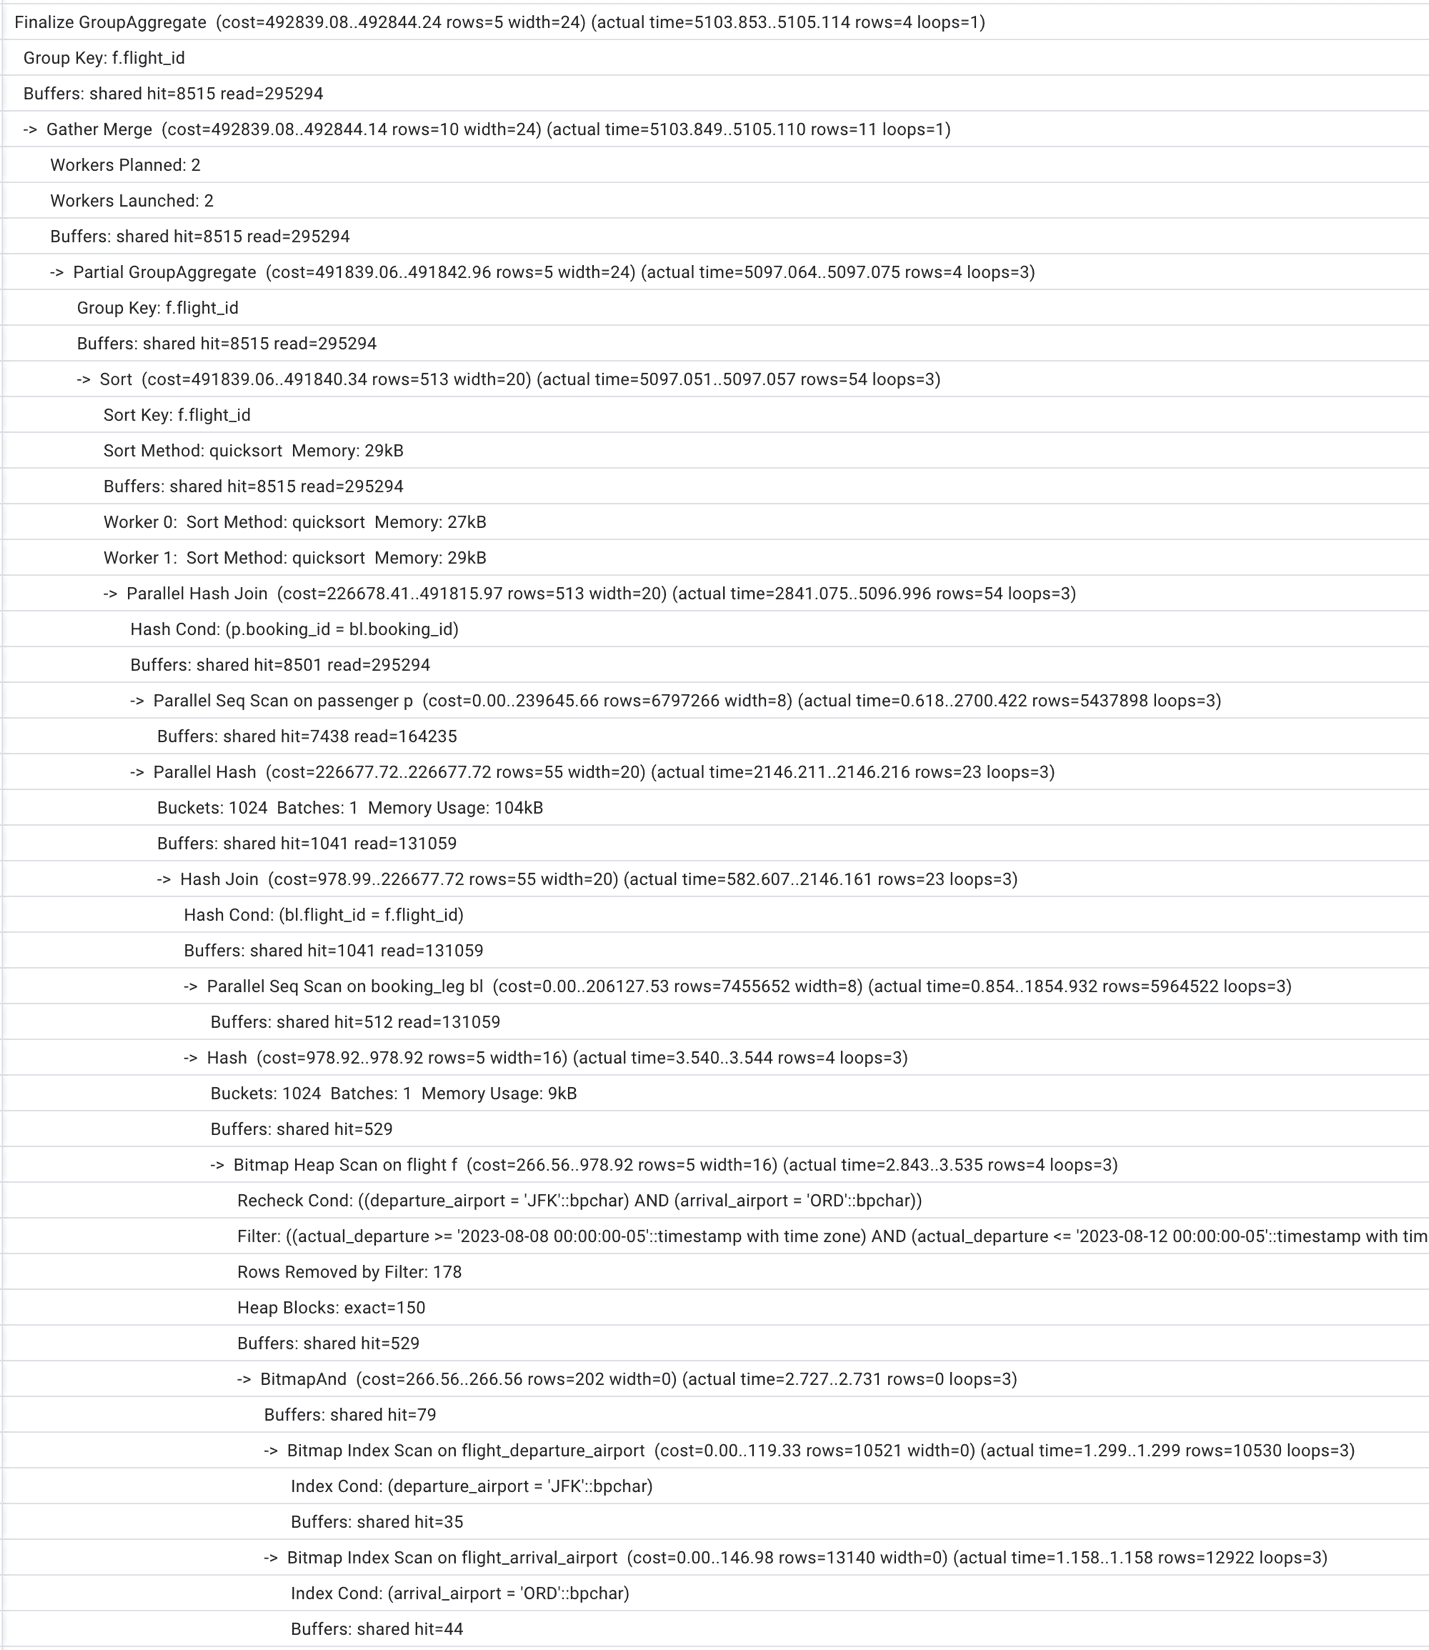
Figure 1. Execution plan with default memory allocations
Looking at this query plan, we can see that the optimizer uses two indexes on table flight,
and then scans all the blocks checking for the actual departure.
We can also notice that the number of shared buffers is insufficient (to achieve consistent results, run the same query or EXPLAIN ANALYZE more than once) and that PostgreSQL chooses to run two parallel workers to speed up the process. The total execution time is a little but over one second.
Since we are not modelling the effect of multiple simultaneously running queries, the parameters which might make a material impact on the query execution time are shared_buffers (the change requires restart) and work_mem (can be modified in session). Let’s first try to increase the size of work_mem, then change the shared_buffers parameter to 1 GB, restart the database cluster and repeat the work_mem changes.
Changing the work_mem parameter does not require restart – you can change it locally for a current session and repeat the experiment. Gradually increasing work_mem up to 1GB, we won’t notice any significant changes in the execution plan and execution time. The limiting factor appears to be the insufficient shared_buffers size. We do not see any disk usage which means that there is enough work_mem from the start.
Figure 2 presents the execution plan with 128MB shared_buffers and 500 MB work_mem. Total execution time is fluctuating around 1 sec on my computer for these current parameters. The plan after this change:
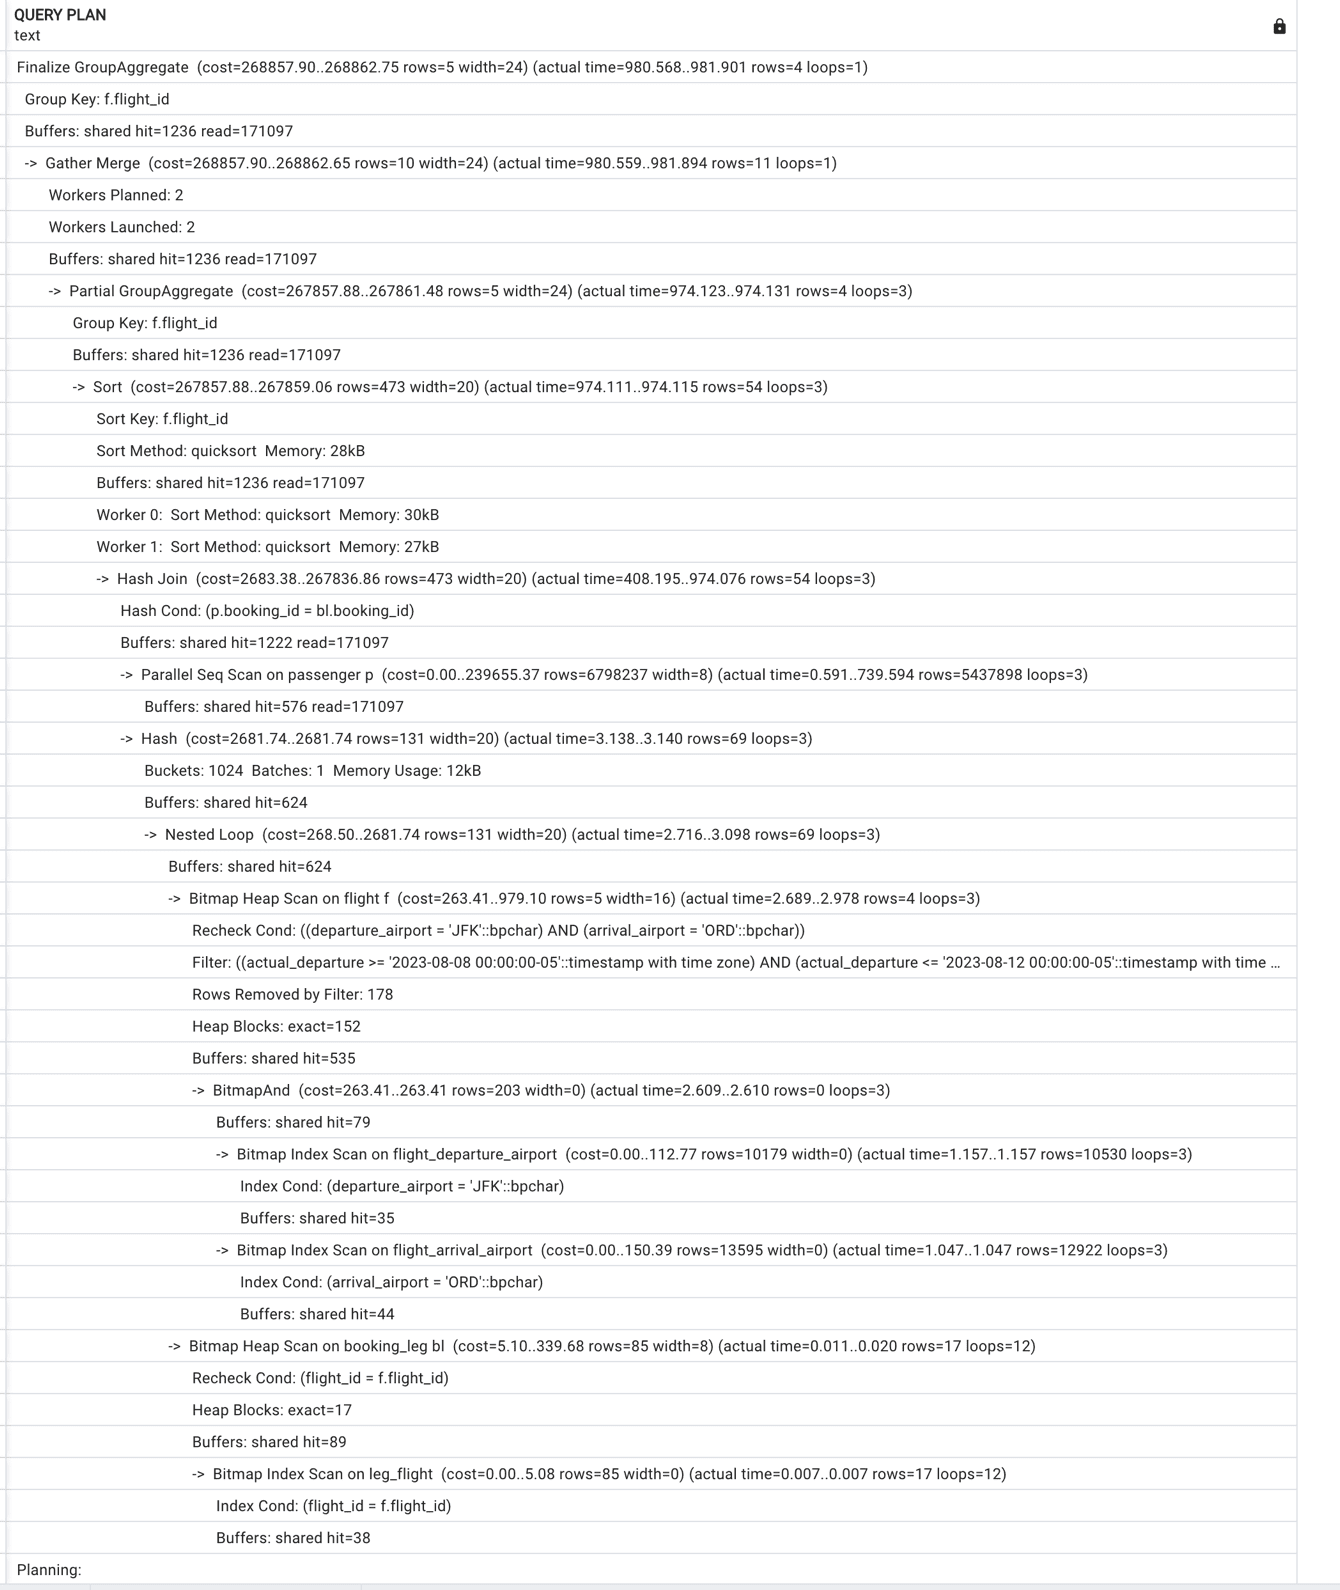
Figure 2. Execution plan with increased work_mem and default shared_buffers
Now, let’s increase shared_buffers to 1GB. TO do this, you will need to edit this parameter in the postgresql.conf file and restart our Postgres instance. Before we start measuring the execution time, we run this query a couple of times making sure that whatever can fit into the shared buffers is there.
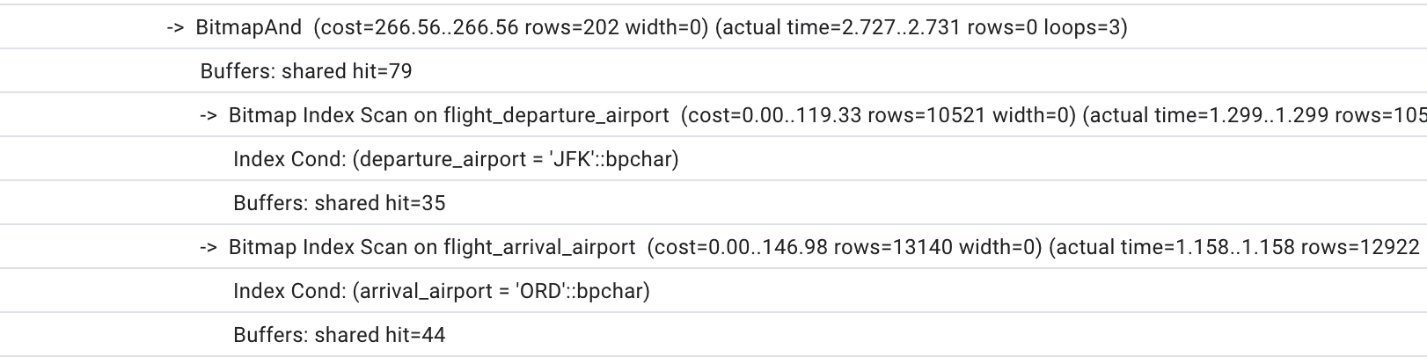
Unfortunately, the execution time decrease will be insignificant. The execution plan will stay the same with the only difference of slightly less reads due to increased shared_buffers (see Figure 3 for a portion of the execution plan)
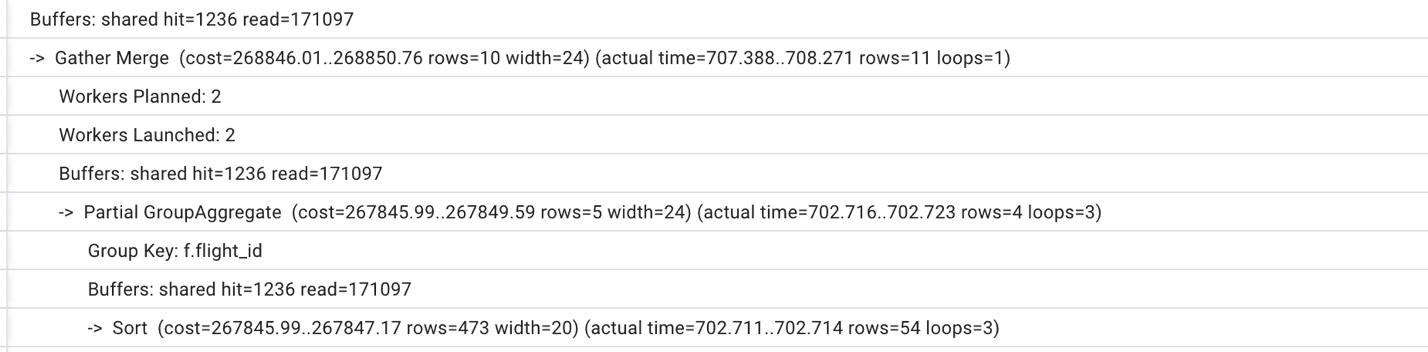
Figure 3. A part of the execution plan with increased shared_buffers which shows less reads than on Figure 2.
If we keep increasing the work_mem to 200MB, 500MB, 1 GB, we will notice slow decrease in the execution time, finally getting as low as 750ms. However, we need to be mindful that such increase in work_mem won’t be possible on production server for multiple sessions simultaneously. Anyway, this query does not seem to be too complicated. Are there other ways to improve its performance?
Are there better ways to tune this query?
Looking at all the execution plans which were produced during our experiments, we can notice one major deficiency: Postgres has to read the heap (table rows) in order to find records where the actual departure is within the range from August 8 to August 12. That indicates that an index on this attribute might help. Let’s go ahead and create the missing index:
|
1 2 |
CREATE INDEX flight_actual_departure ON postgres_air.flight (actual_departure); |
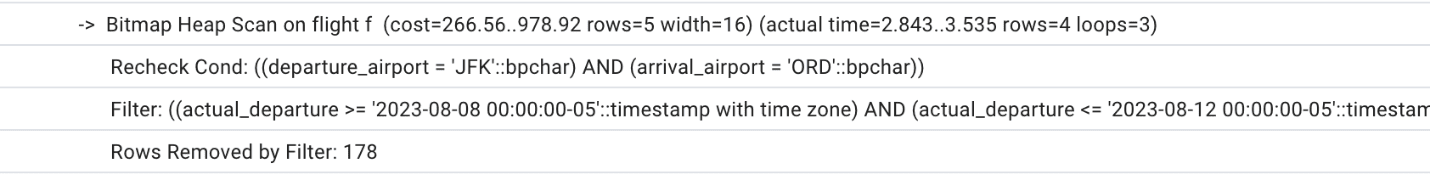
Immediately, we notice the difference in the execution plan (see Figure 4)
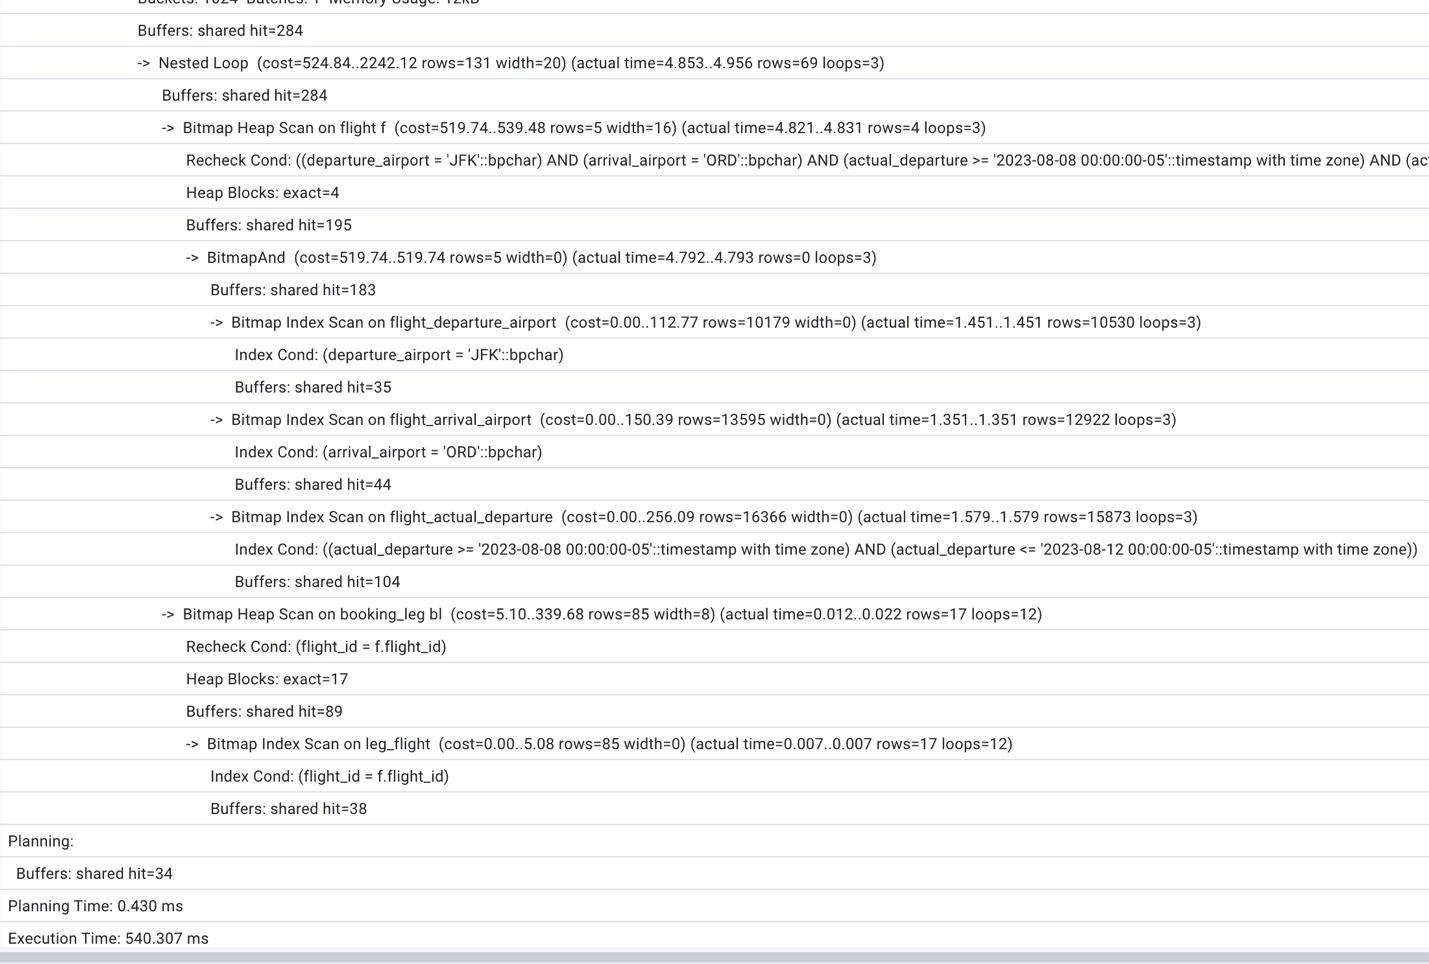
Figure 4. Truncated execution plan with index on actual_departure column.
Also, we can see that the execution time finally started to decrease, and we are down to 0.5 sec execution time. However, the difference is still not so dramatic as we would like it to be. Continuing examining the execution plan we notice that Postgres performs a full scan on the passenger table (see Figure 5).
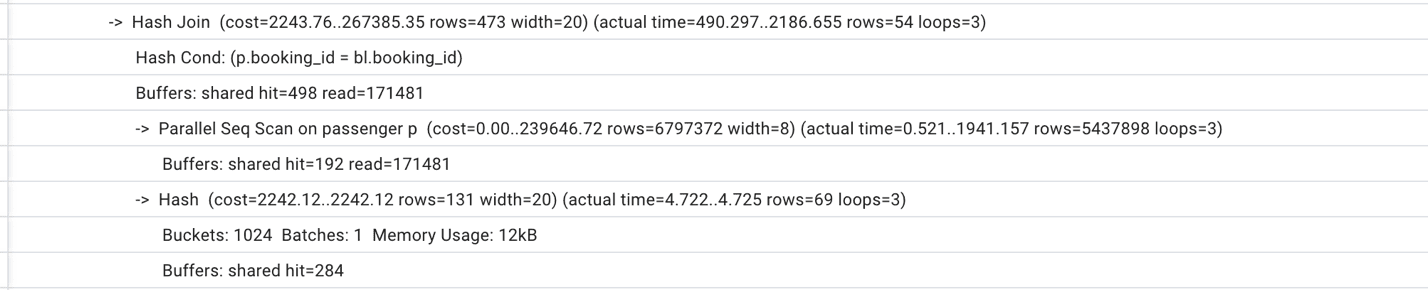
Figure 5. A part of the execution plan with full table scan.
Looking at the join condition and at the foreign key constraint on the booking_id field, we can conclude that the index on booking_id might help. Indeed, if we create a new index:
|
1 2 |
CREATE INDEX IF NOT EXISTS passenger_booking_id ON postgres_air.passenger (booking_id); |
The execution plan will change dramatically – see Figure 6. Now, the total execution time is just 10 ms, which is fifty times shorter than with best possible parameters tuning.
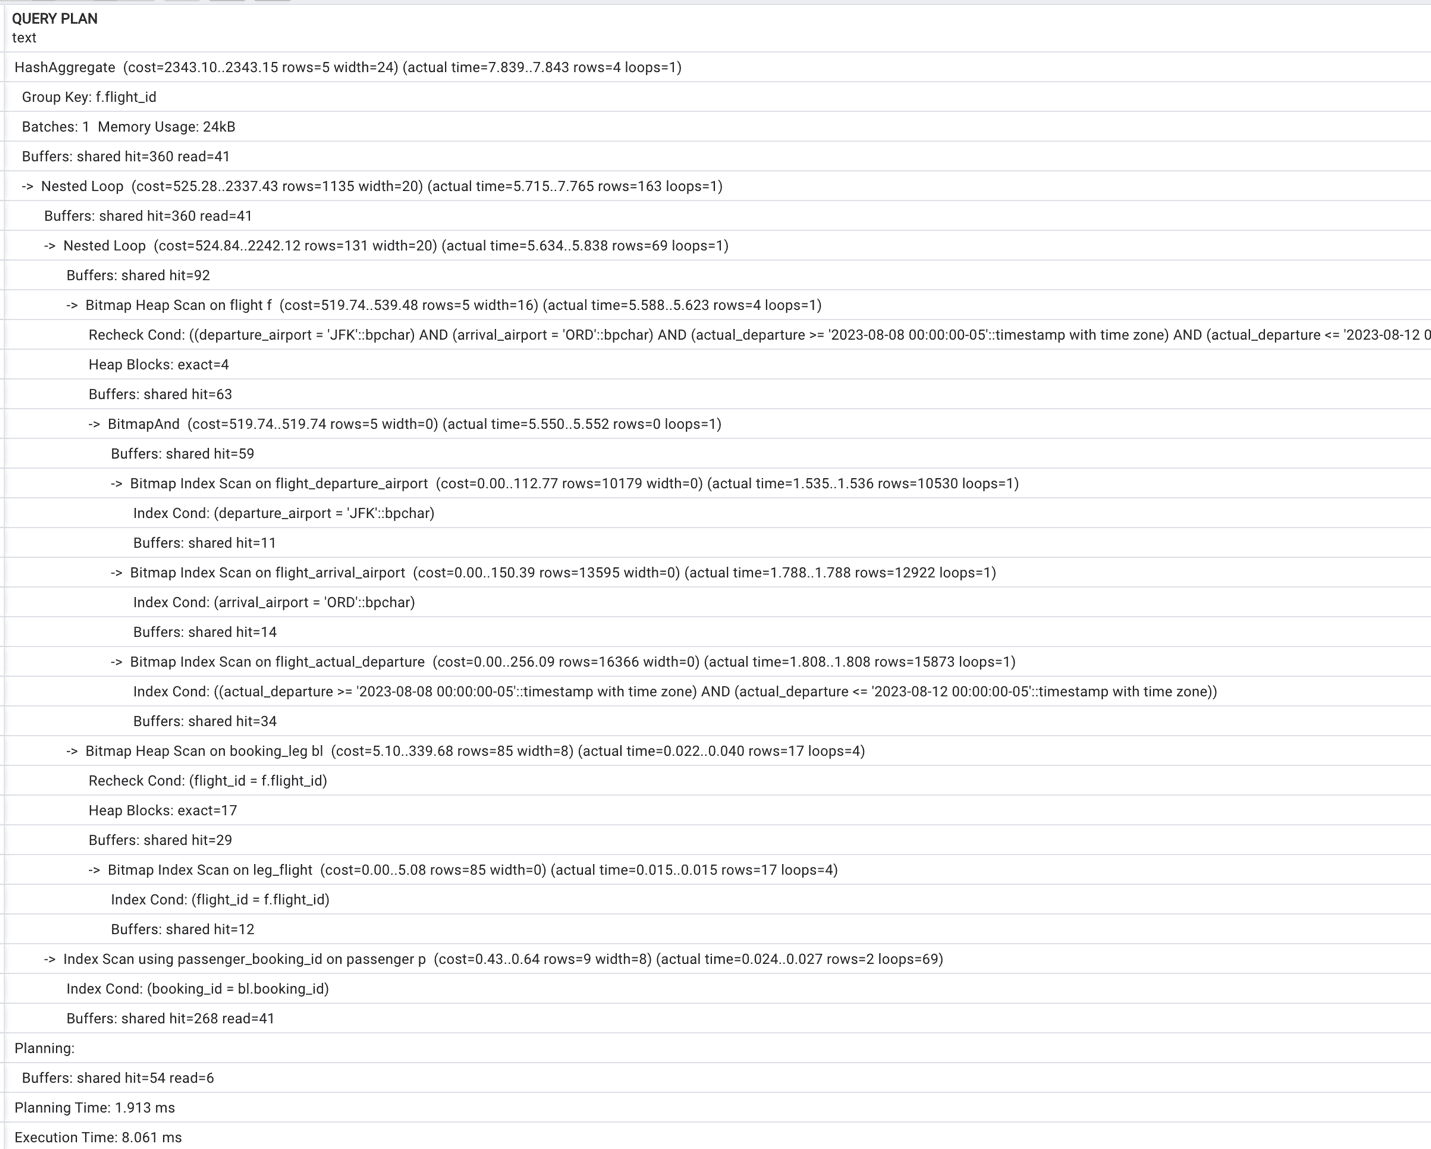 Figure 6. Execution plan with two indexes.
More importantly, if we roll back the system parameters to the default settings and reduce the shared_buffers to 128MB, nothing will change either in the execution plan or in the execution time. No wonder – looking closely at the new execution plan in Figure 6, we can see that since we do not need massive table scans, we do not need that many shared buffers!
Other Limitations of Parameters Tuning
When we think about the meaning of the Postgres configuration parameters, it’s important to remember that, in essence, all we are doing is communicating to the query planner what hardware resources it has available. Postgres is agnostic to what is the size of the RAM of the host it is running, what is the type or storage, how many cores are available, and what other systems are running on the same host. We provide some “input parameters” for optimization by setting up parameters to specific values.
For example, if we define shared_buffers=128MB while the host has 16 GB of RAM, the query planner won’t be able to use most of the memory. However, it could choose another way to make queries faster, such as running it with multiple parallel processes, as we saw in Figures 1 – 3.
The opposite is also true. If we have the same 16 GB of RAM, and we allocate 4 GB for shared buffers, and at the same time set default work_mem=200MB and max_connections=700, there are high chance that Postgres will get an “out of memory” error from the operating system.
Another example. The random_page_cost parameter helps the optimizer estimate the cost of index-based access. The default value of 4 in the older Postgres versions reflected the disk characteristics which were available ten years ago. Nowadays, keeping this value at 4 might stop the optimizer from choosing the best execution plan. However, if we reduce this value for the system which utilizes the slow disks, the result will be the opposite.
Conclusion
Although it is important to set up Postgres configuration parameters in the best possible way for a specific system, it is far from enough to achieve the best performance. As we demonstrated, parameters tuning usually helps to improve system performance by ten or twenty percent, and maybe in some cases even more. At the same time, the creation of missing indexes can make the queries run dozen times faster, and the same time reduce resource usage.
In subsequent blog post series, we will talk about multiple techniques that make this optimization possible.
This document contains proprietary information and is protected by copyright law.
Copyright © 2026 Red Gate Software Limited. All rights reserved
Load comments