

This article is part of Robert Sheldon's continuing series on Mongo DB. To see all of the items in the series, click here.
In the previous article in this series, I demonstrated how to build and run an aggregate statement in MongoDB Shell. An aggregate statement makes it possible to group and summarize a collection’s document data, as well as transform the data and control its output.
For the examples in that article, I used the version of MongoDB Shell that is embedded in MongoDB Compass. This article continues the discussion on aggregate statements, except that the focus is now on the graphical components built into the Compass interface.
Through the interface, you can build and edit complex aggregation pipelines that pull data from a MongoDB collection. The interface includes a rich set of features for building each stage in the pipeline and for visualizing your progress as you refine your stage definitions.
To use these features effectively, however, you should have a basic understanding of how an aggregate statement works and what it takes to create an aggregation pipeline. For this reason, I highly recommend that you read the previous article before starting in on this one, unless you’re already familiar with creating aggregations. The examples I demonstrate in this article build on many of the concepts introduced in the previous article, so the better the understand those concepts, the more you’ll get out of this article.
Specifically, this article walks you through the process of using the Compass GUI to build an aggregation pipeline. The article assumes that you already have a basic understanding of pipeline concepts and how to define the individual stages. If you’ve reviewed the previous article, you should have no problem following along with the examples in this article. My focus here is primarily on using the interface, rather than in explaining stage elements I’ve already covered.
Note: For the examples in this article, I used MongoDB Atlas and MongoDB Compass. The last section of the article—“Appendix: Preparing your MongoDB environment”—provides information about how to set up your environment and includes a link to a .json file that you’ll need to download if you want to try out these examples for yourself.
Introducing aggregations in the MongoDB Compass GUI
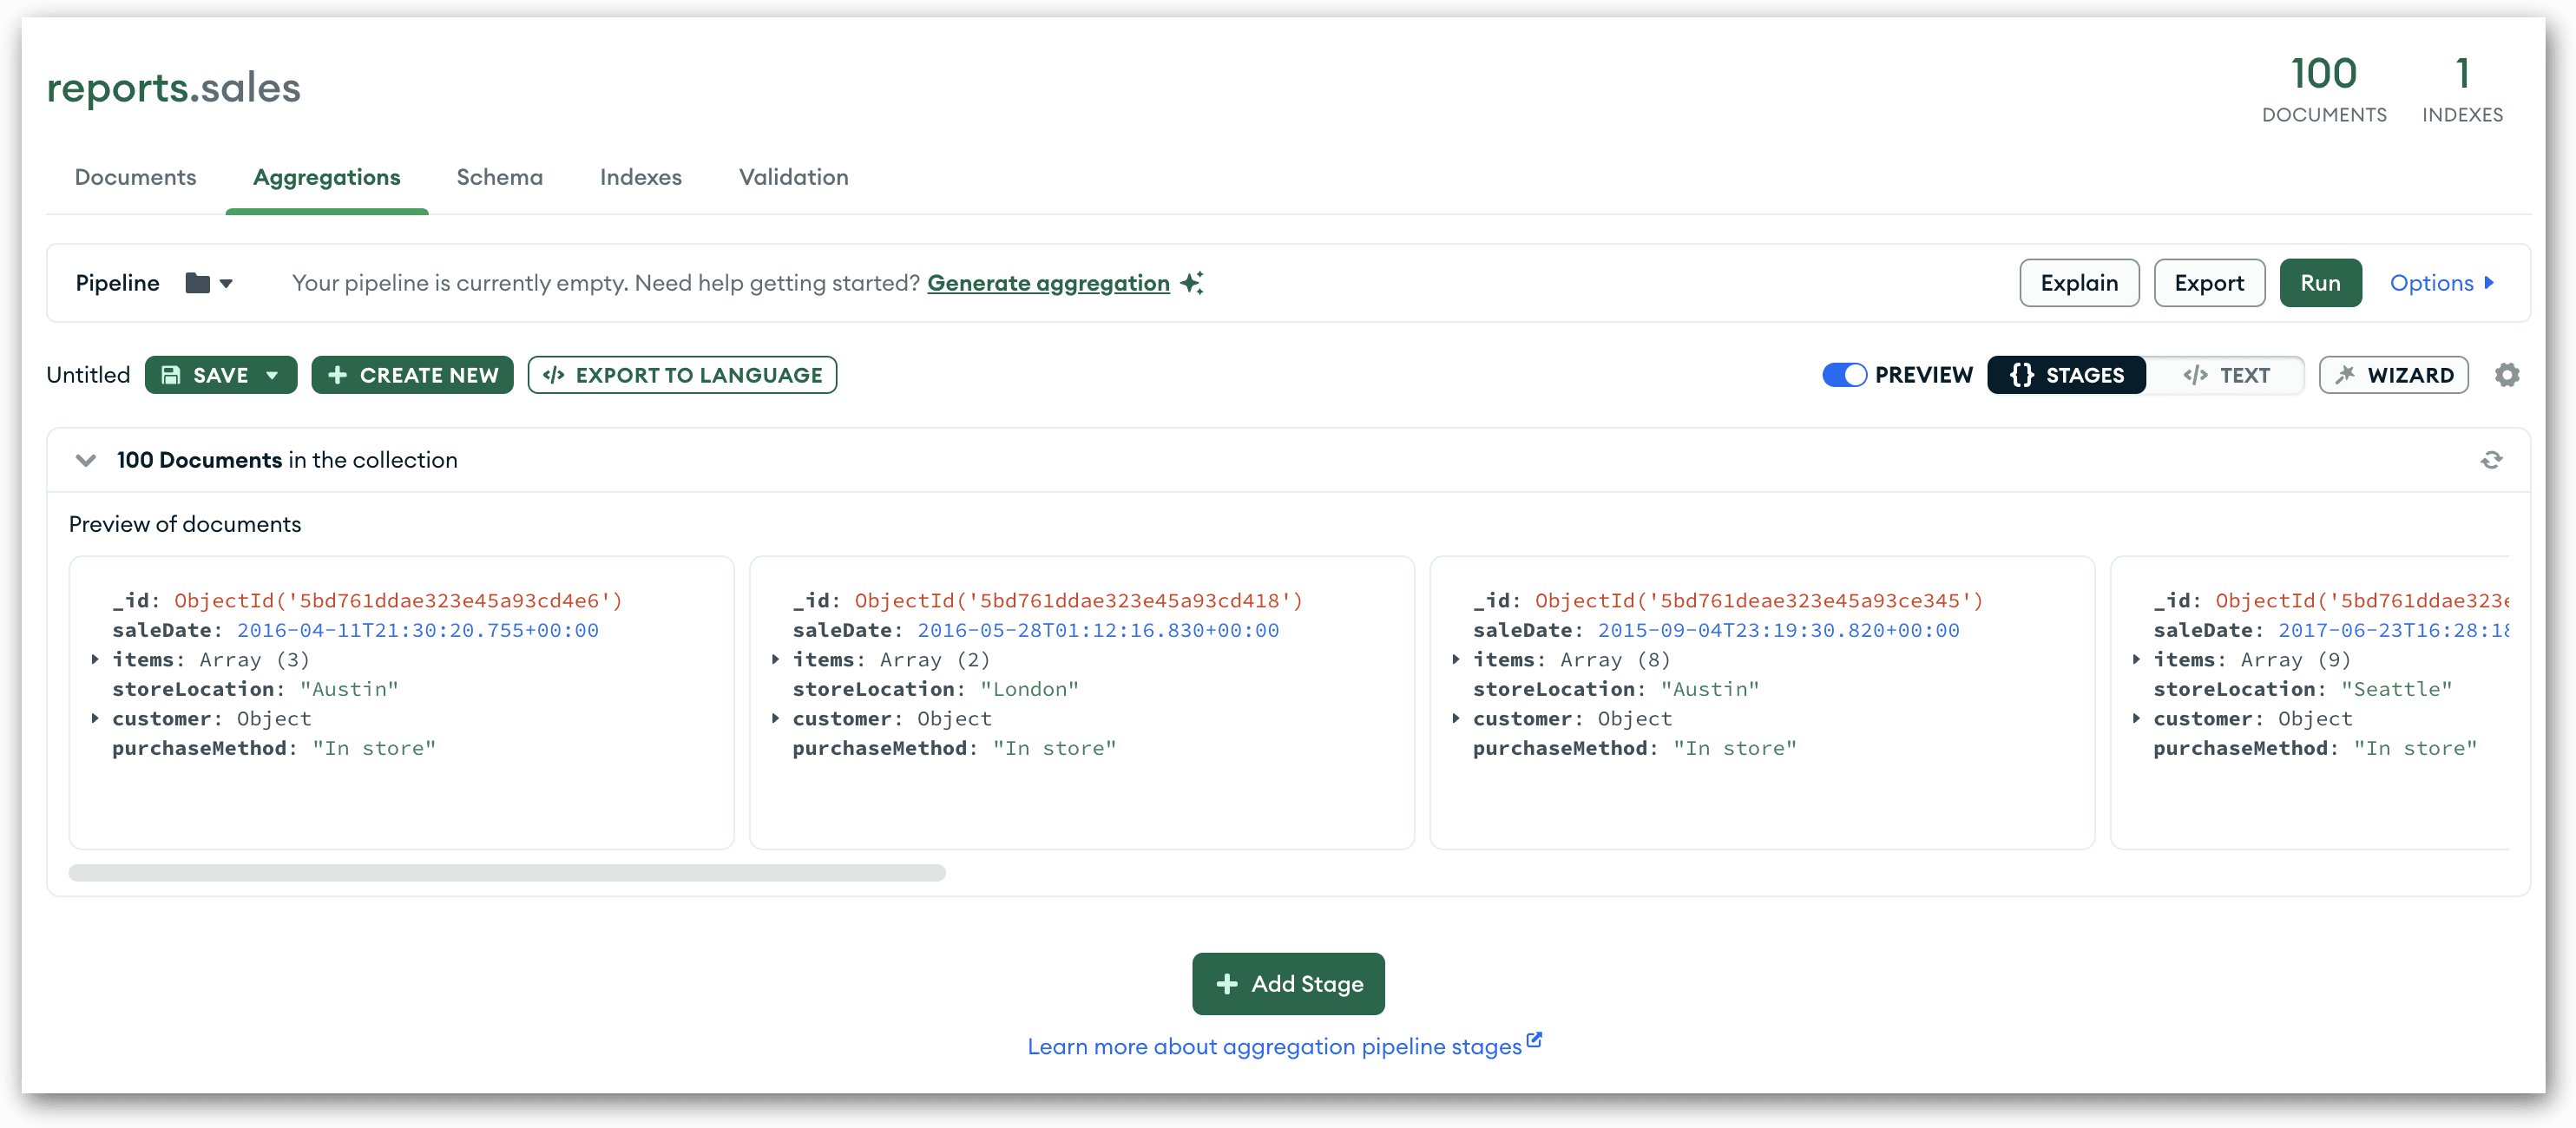
So far in this series, most of actions we performed in MongoDB Compass were either on the Documents tab of the main window or in the embedded MongoDB Shell. For this article, we won’t be using either environment. Instead, we’ll be working on the Aggregations tab, which is also part of the main interface window.
The Aggregations tab includes a number of features that help simplify the process of creating an aggregation pipeline and their various stages. On this tab, you can also view and copy the pipeline code, which you can then use in your aggregate statements, whether running them in MongoDB Shell or incorporating them into your applications.
To access the tab, you must first open the target collection, in this case, sales. (See the Appendix if you haven’t already set up the sales collection.) The collection automatically opens in the Documents tab, but you can easily access the Aggregations tab by clicking Aggregations near the top of the main window.
On the Aggregations tab, you’ll find a preview of the collection’s documents. The documents are displayed in a row (horizontally), as shown in the following figure. Within the row, you can scroll either left or right to view all the preview documents.
The Aggregation tab provides a user-friendly environment for defining the stages in your pipeline. Each stage (except for the first) uses the output from the previous stage as its input. The stage then processes the inputted documents and outputs a set of documents that have been transformed in some way. If the stage is the first one in the pipeline, its input is the collection itself.
As I walk you through the process of building an aggregation pipeline, I’ll explain the various features available on the Aggregations tab. For this article, we’ll create a pipeline that includes the same stages that we covered in the previous article ($match, $unwind, $group, $project, and $sort). We’ll define the stages a bit differently from what we did in the last article, but the fundamentals will be much the same.
The pipeline we create in this article will limit the results to customers who are over 30 years old and have purchased products within physical stores, as opposed to shopping online or by phone. For these customers, the pipeline will group the data first by product and then by gender. It will also calculate the total number of each product sold, as well as the average price for those products.
Adding a $match stage to your aggregation pipeline
An aggregation pipeline starts with the documents in the opened collection. As noted above, these documents provide the input for the first stage. The stage filters or transforms those documents in some way and then outputs the processed documents to the pipeline so they can be used by the next stage.
For our pipeline, we’ll start with a $match stage. This is a good place to start because the $match stage filters out the documents we don’t need, reducing both processing and memory overhead. To control which documents are filtered out, we must specify one or more conditions. Only the documents that meet those conditions are passed down the pipeline to the next stage.
To add a $match stage, click the Add Stage button at the bottom of the Aggregations tab. This adds a row beneath the collection row, as shown in the following figure. The new row (outlined in red) serves as a workspace for defining your stage.
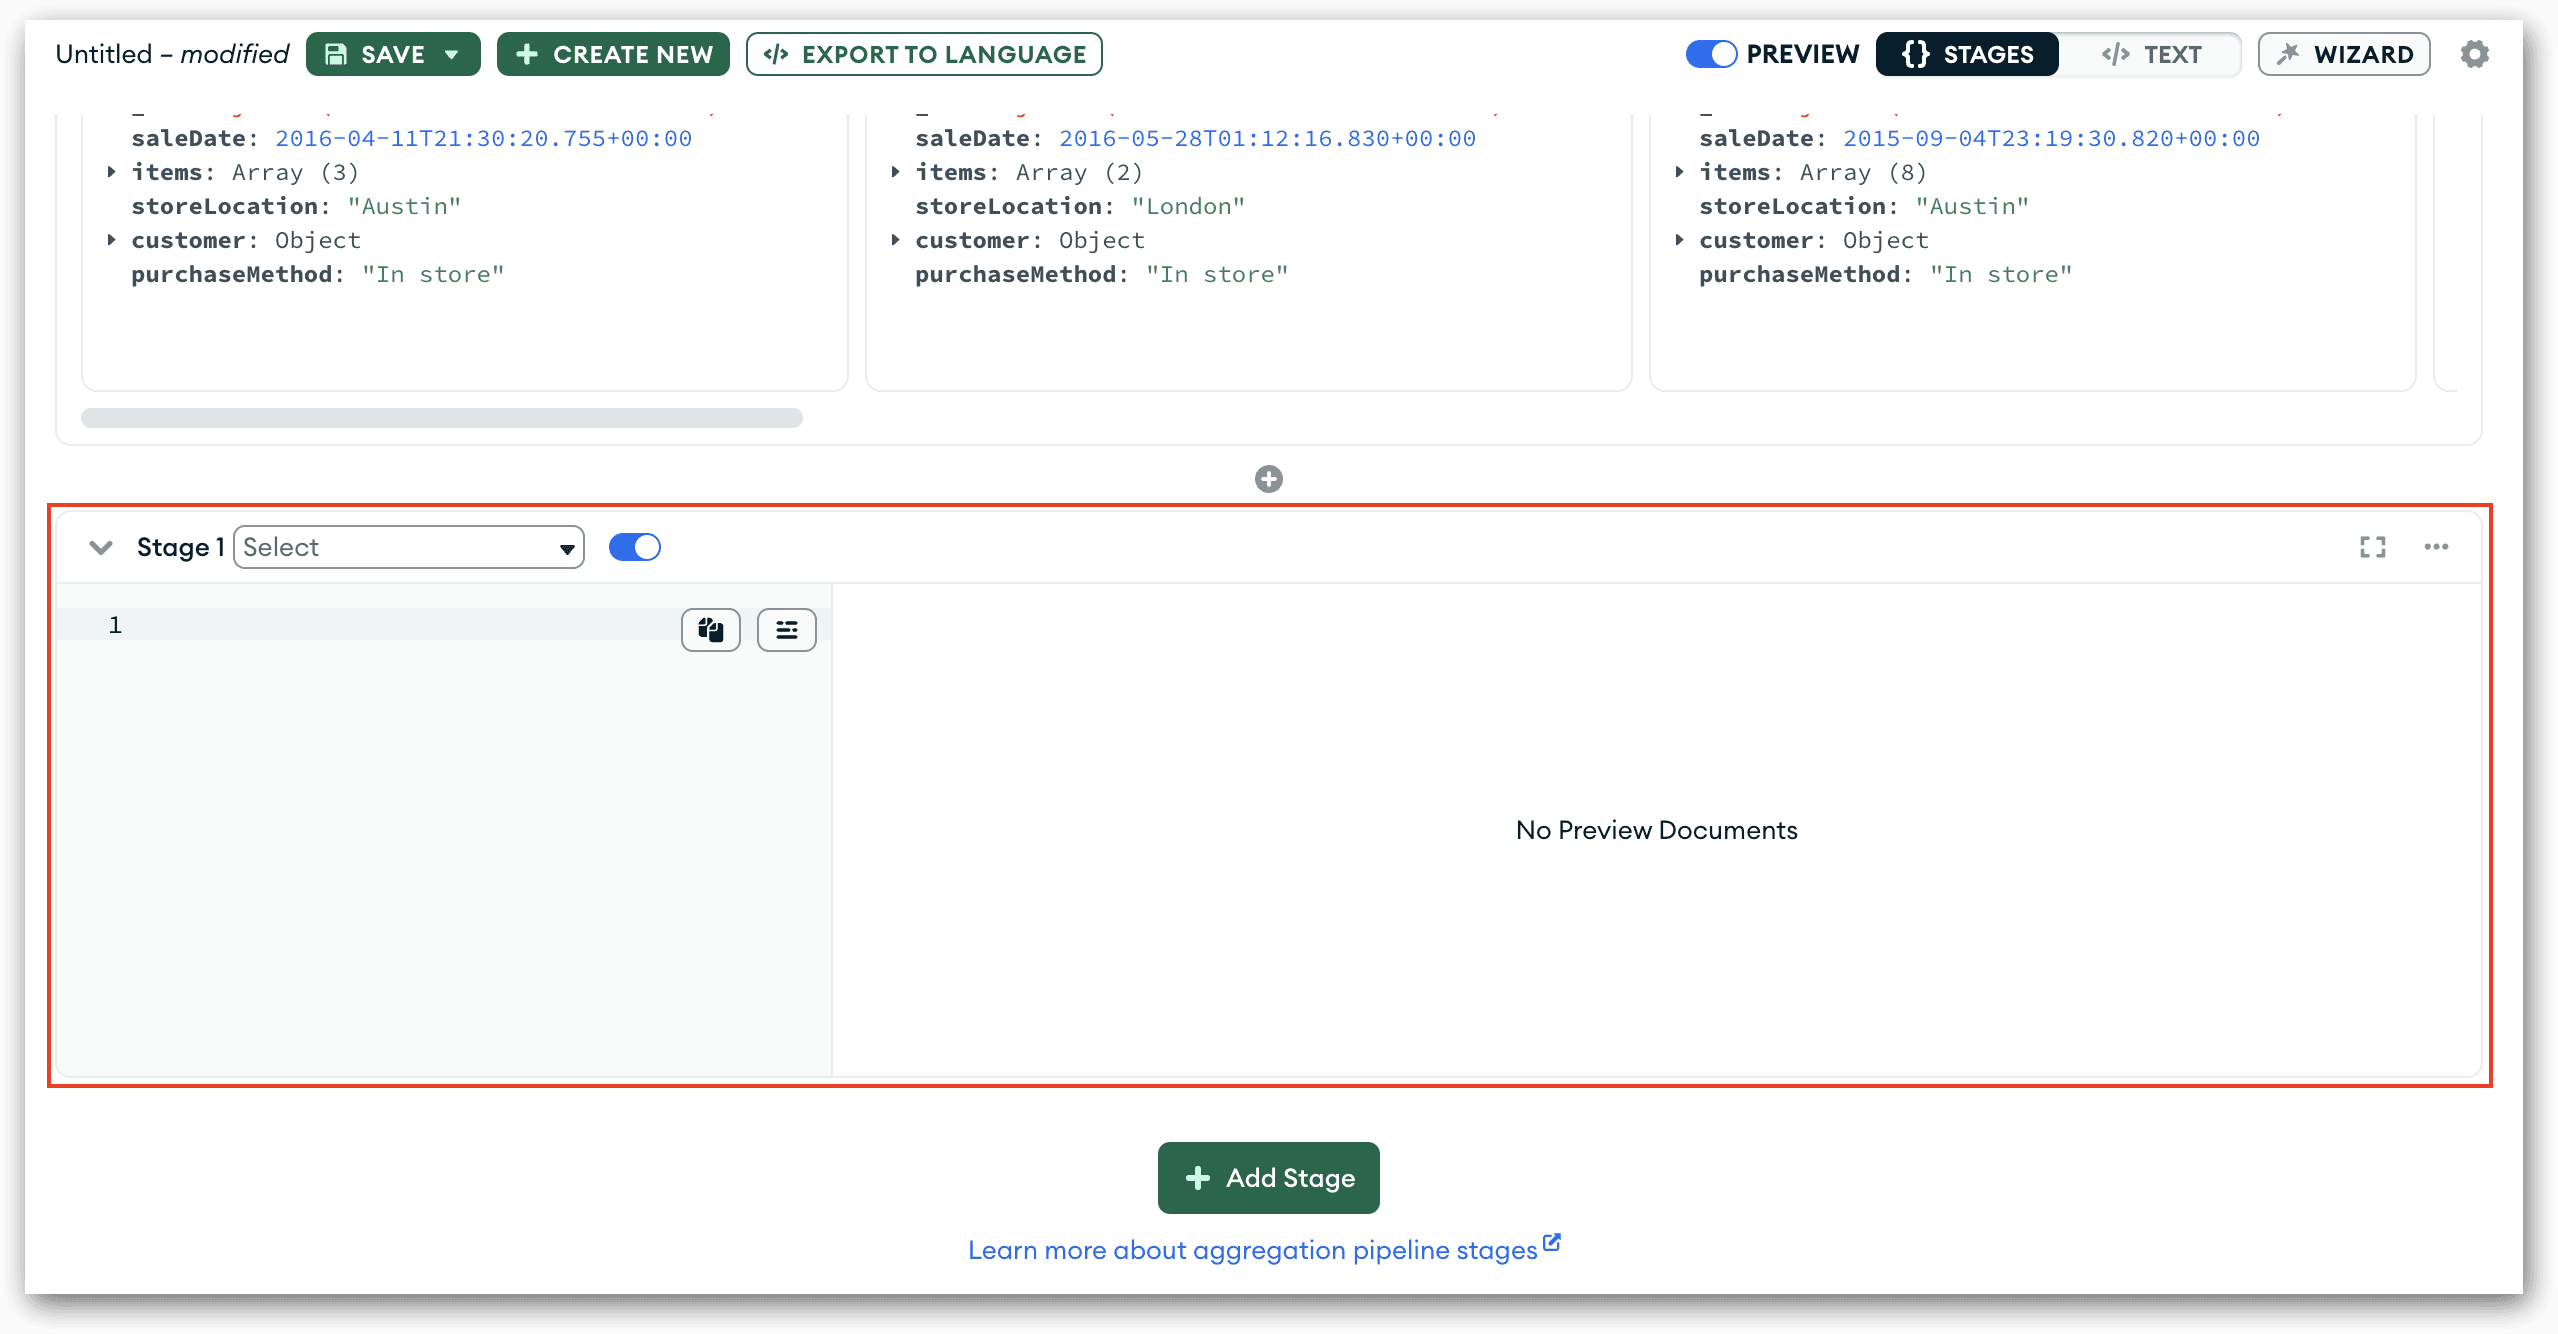
Near the upper left corner of the new row, you’ll find the Stage 1 drop-down list. From this list, select the $match option. Compass will populate the text box beneath the drop-down list with a comment and placeholder code. You’ll also see an error message stating that the stage value is invalid. That message will disappear as soon as you add valid code.
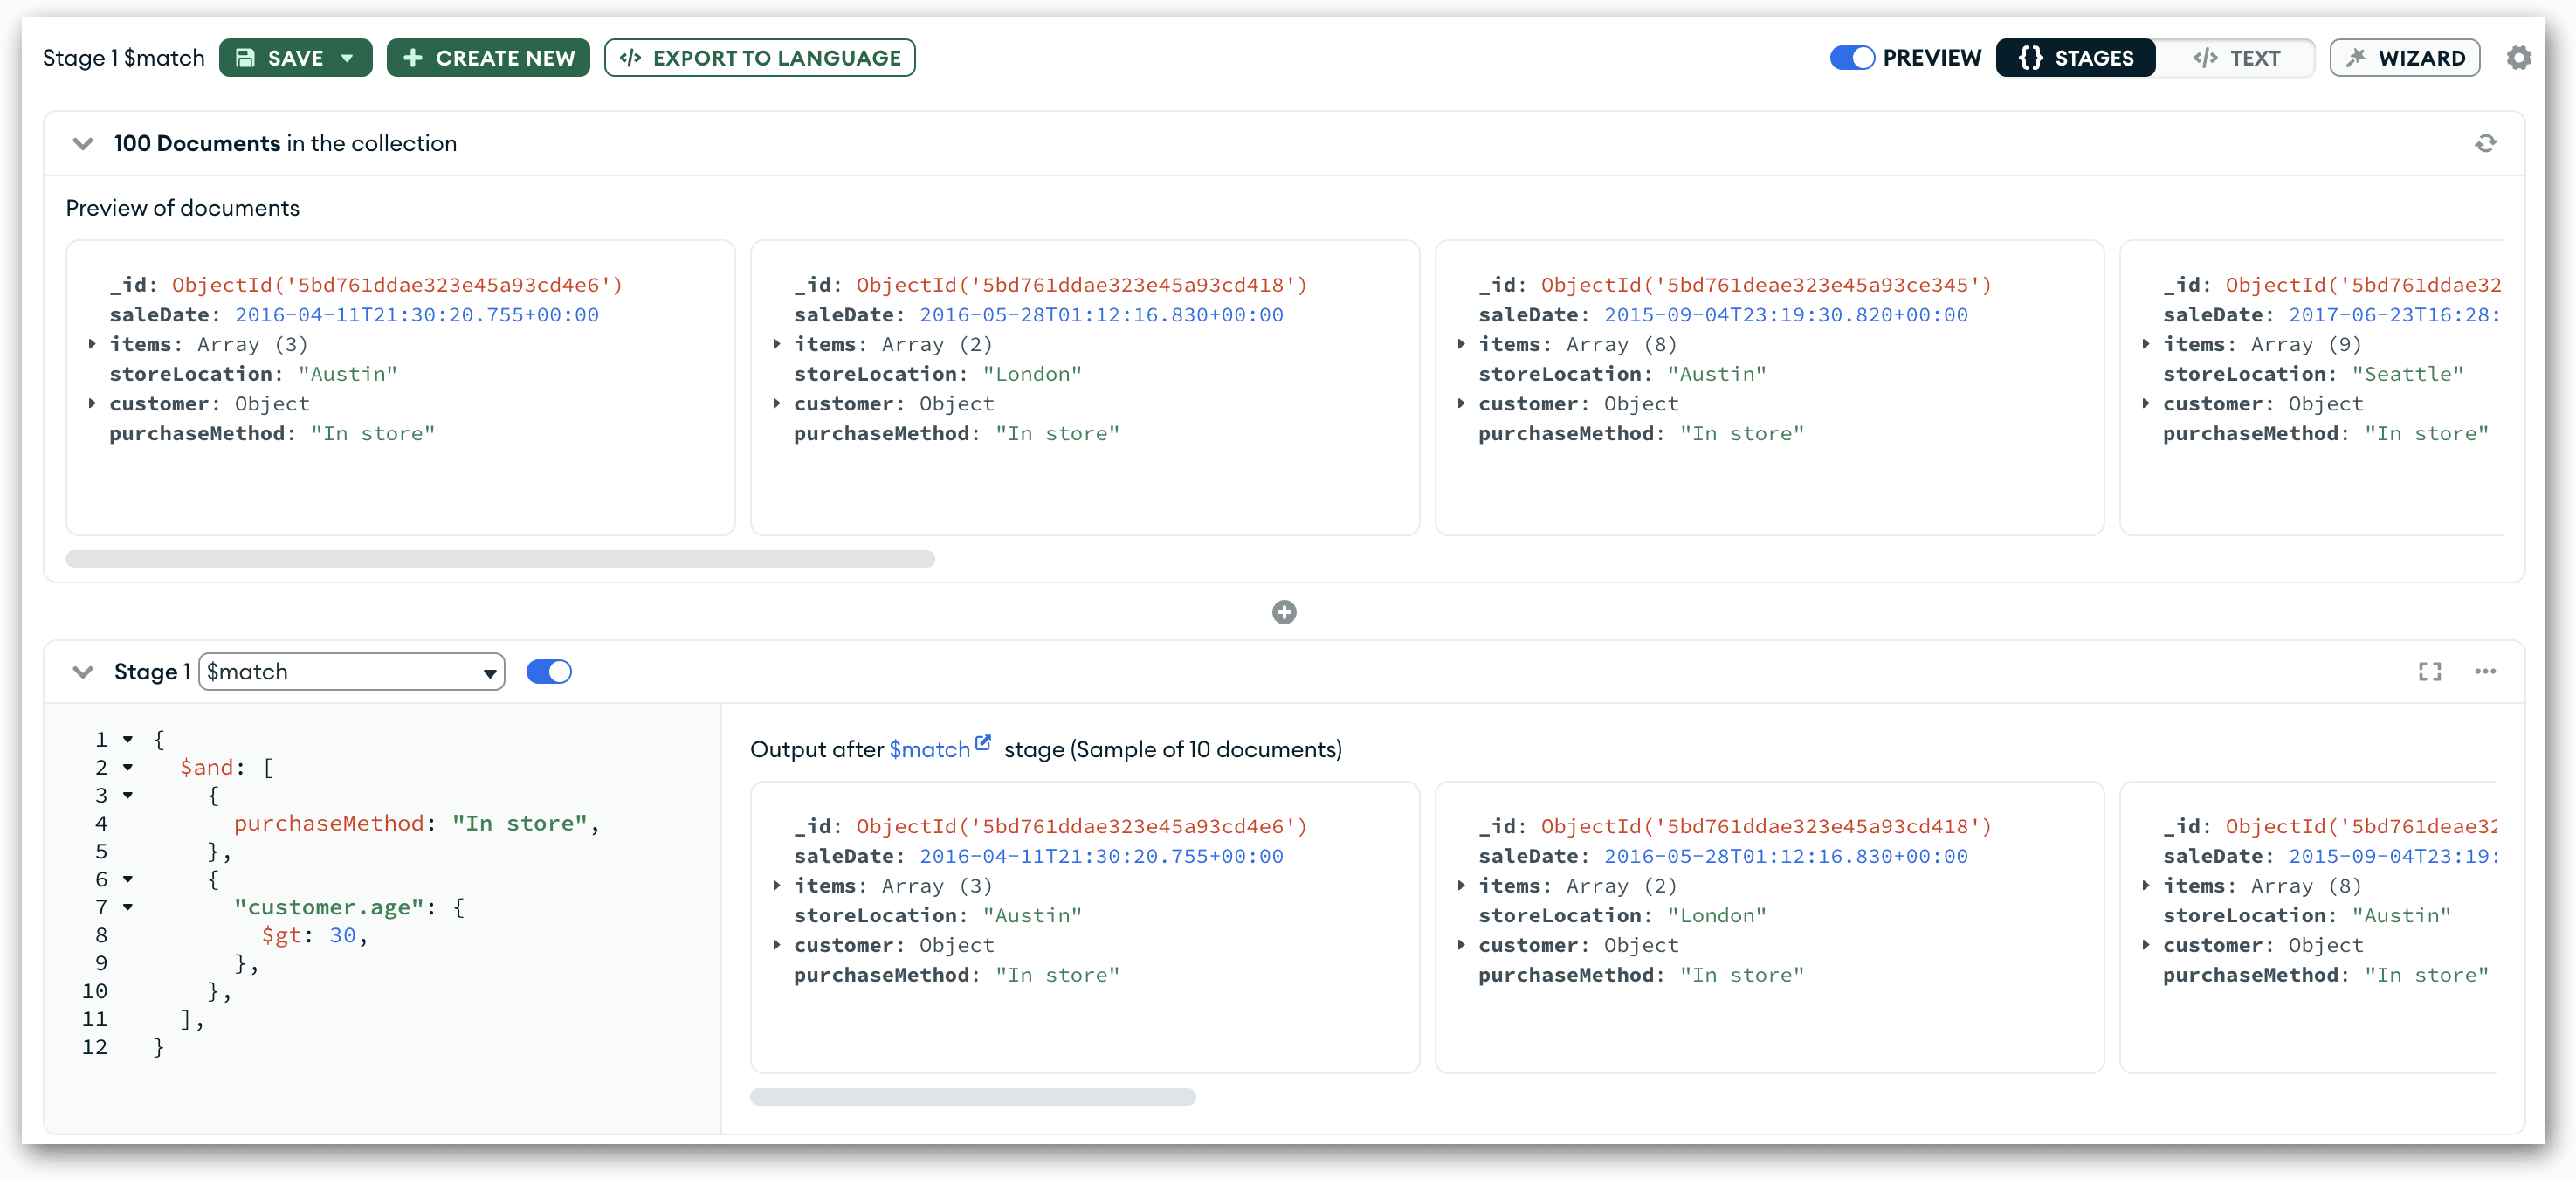
The purpose of the stage is to filter out all documents except those whose purchaseMethod field has a value of In store and whose customer.age field has a value greater than 30. In row’s the text box, delete the existing text, copy the following code, and paste it into the text box:
|
1 2 3 4 5 6 7 8 9 10 |
{ $and: [ { purchaseMethod: "In store", }, { "customer.age": { $gt: 30 }, }, ], } |
When you add valid code to your stage definition, Compass automatically displays up to 10 documents from the stage’s output, as shown in the following figure. (You can change the number of displayed documents in the tab’s settings.) If you examine these documents, you’ll see that each one has a purchaseMethod value of In store and a customer.age value greater than 30.
That’s all you need to do to create the first stage. However, there are a couple other features on the Aggregations tab that I want to point out. The first is Text View Mode.
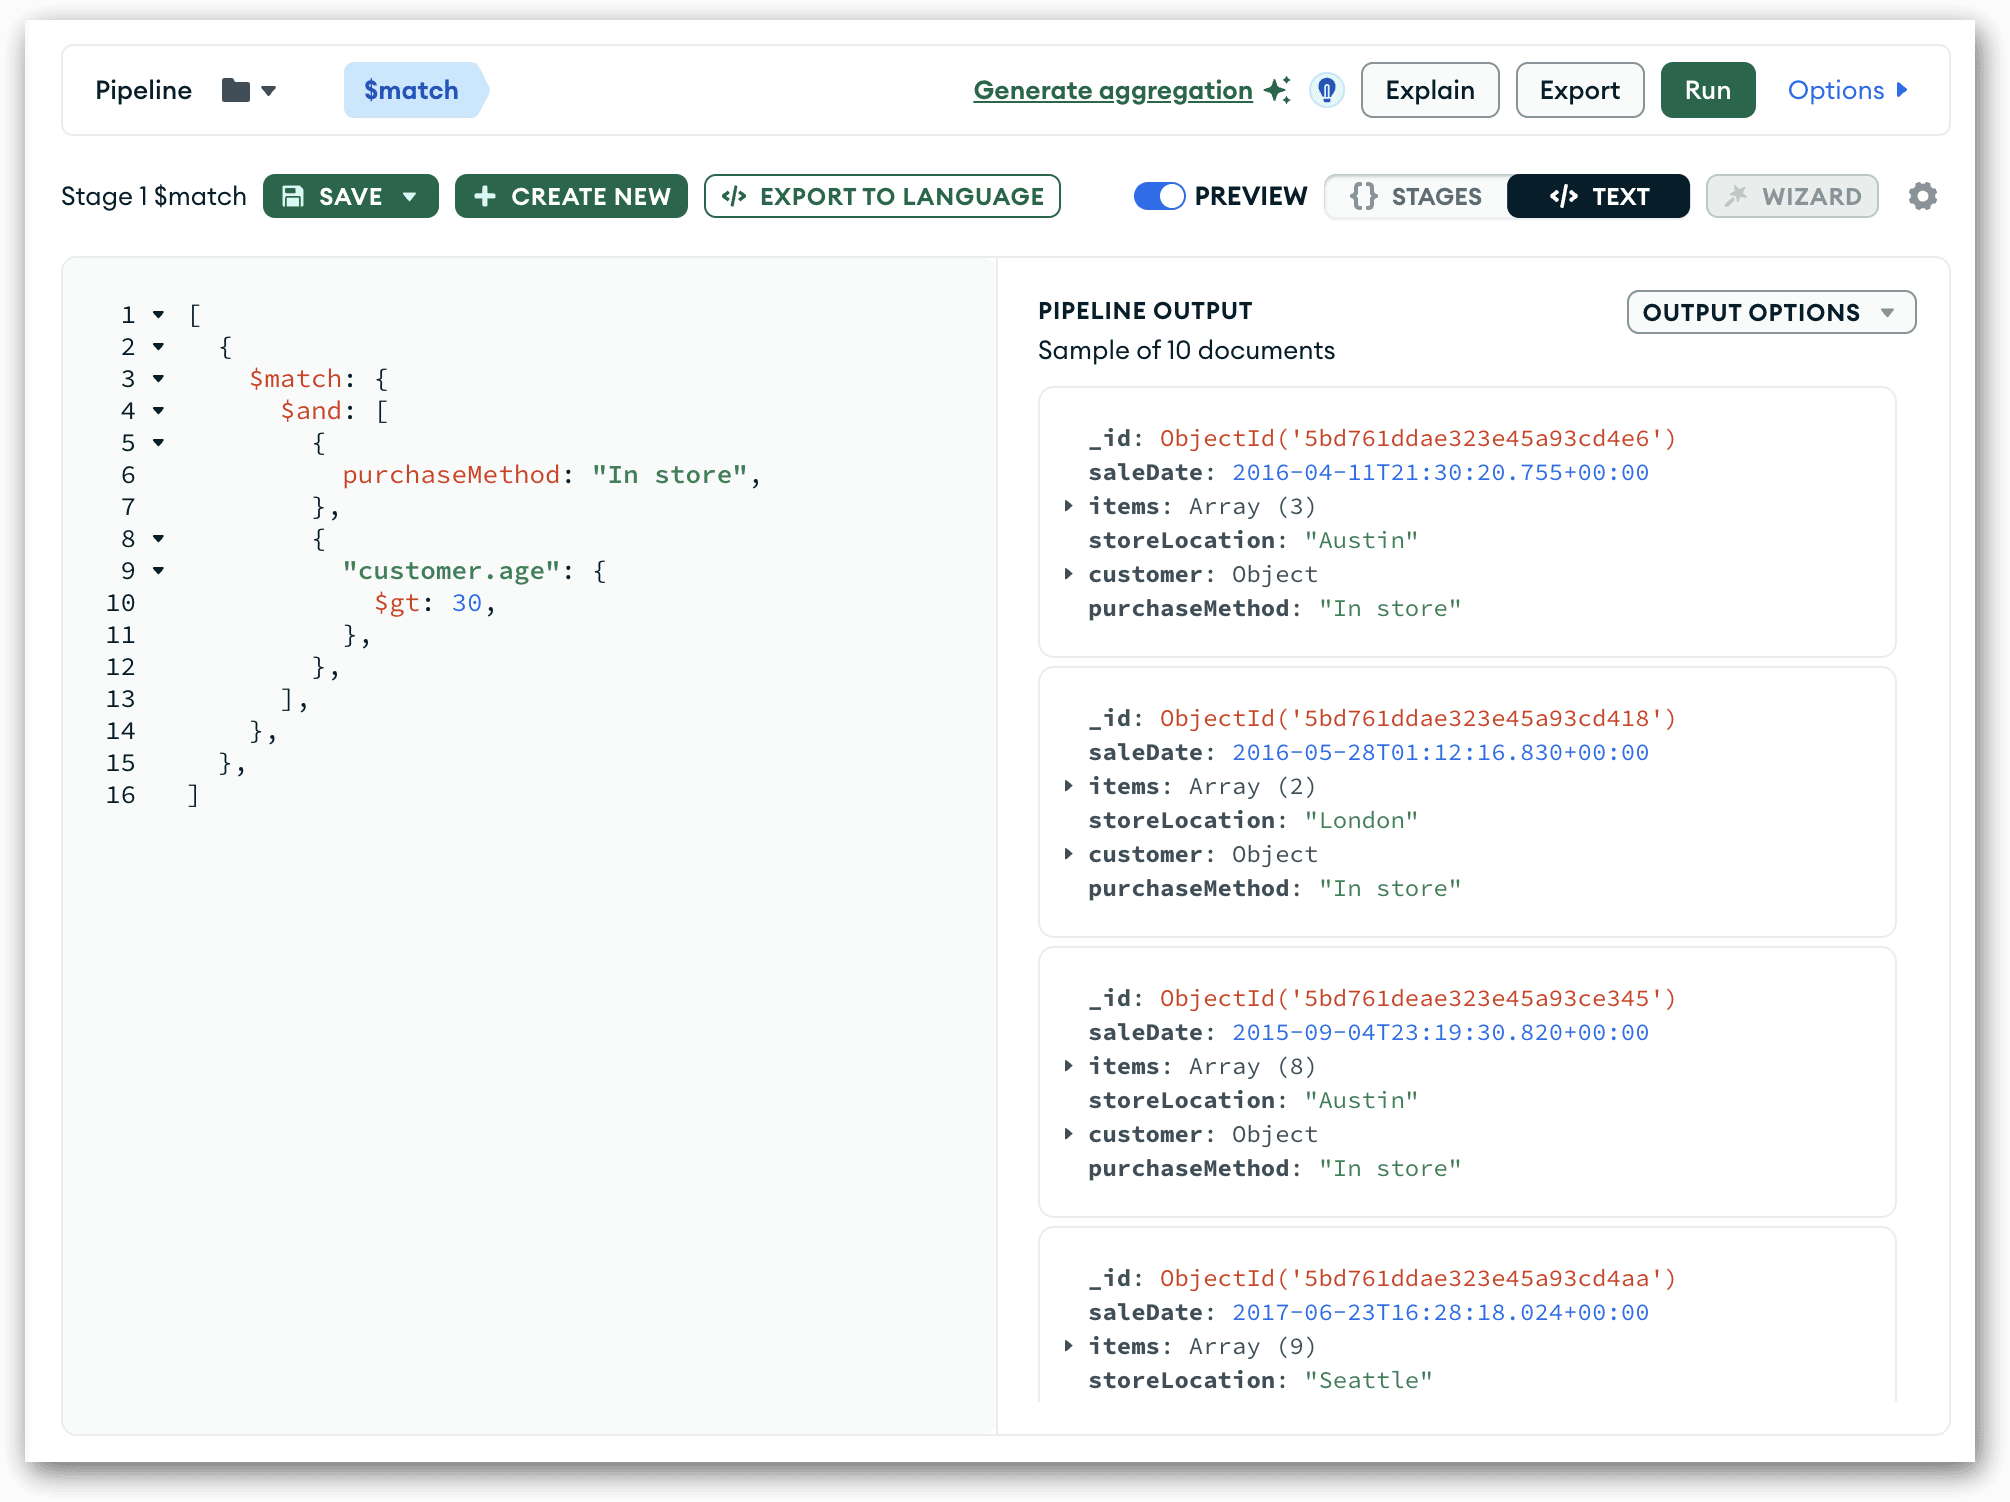
When you first open the Aggregations tab, it is in Stages View Mode. However, you can switch to Text View Mode by clicking the TEXT button near the upper right corner, just above the collections row. In this mode, you can view the pipeline code as it would appear in an aggregate statement. Text View Mode also provides a preview of the documents from of the data output, only now they’re listed vertically, as shown in the following figure.
Another feature worth noting is Focus Mode, which you can access from Stages View Mode. If you’re in Text View Mode, you can get back to Stages View Mode by clicking the STAGES button near the upper right corner, to the left of the TEXT button. In Stages View Mode, you’ll find a button for Focus Mode at the upper right corner of the stage row, as shown in the following figure. The Focus Mode button is outlined in red.
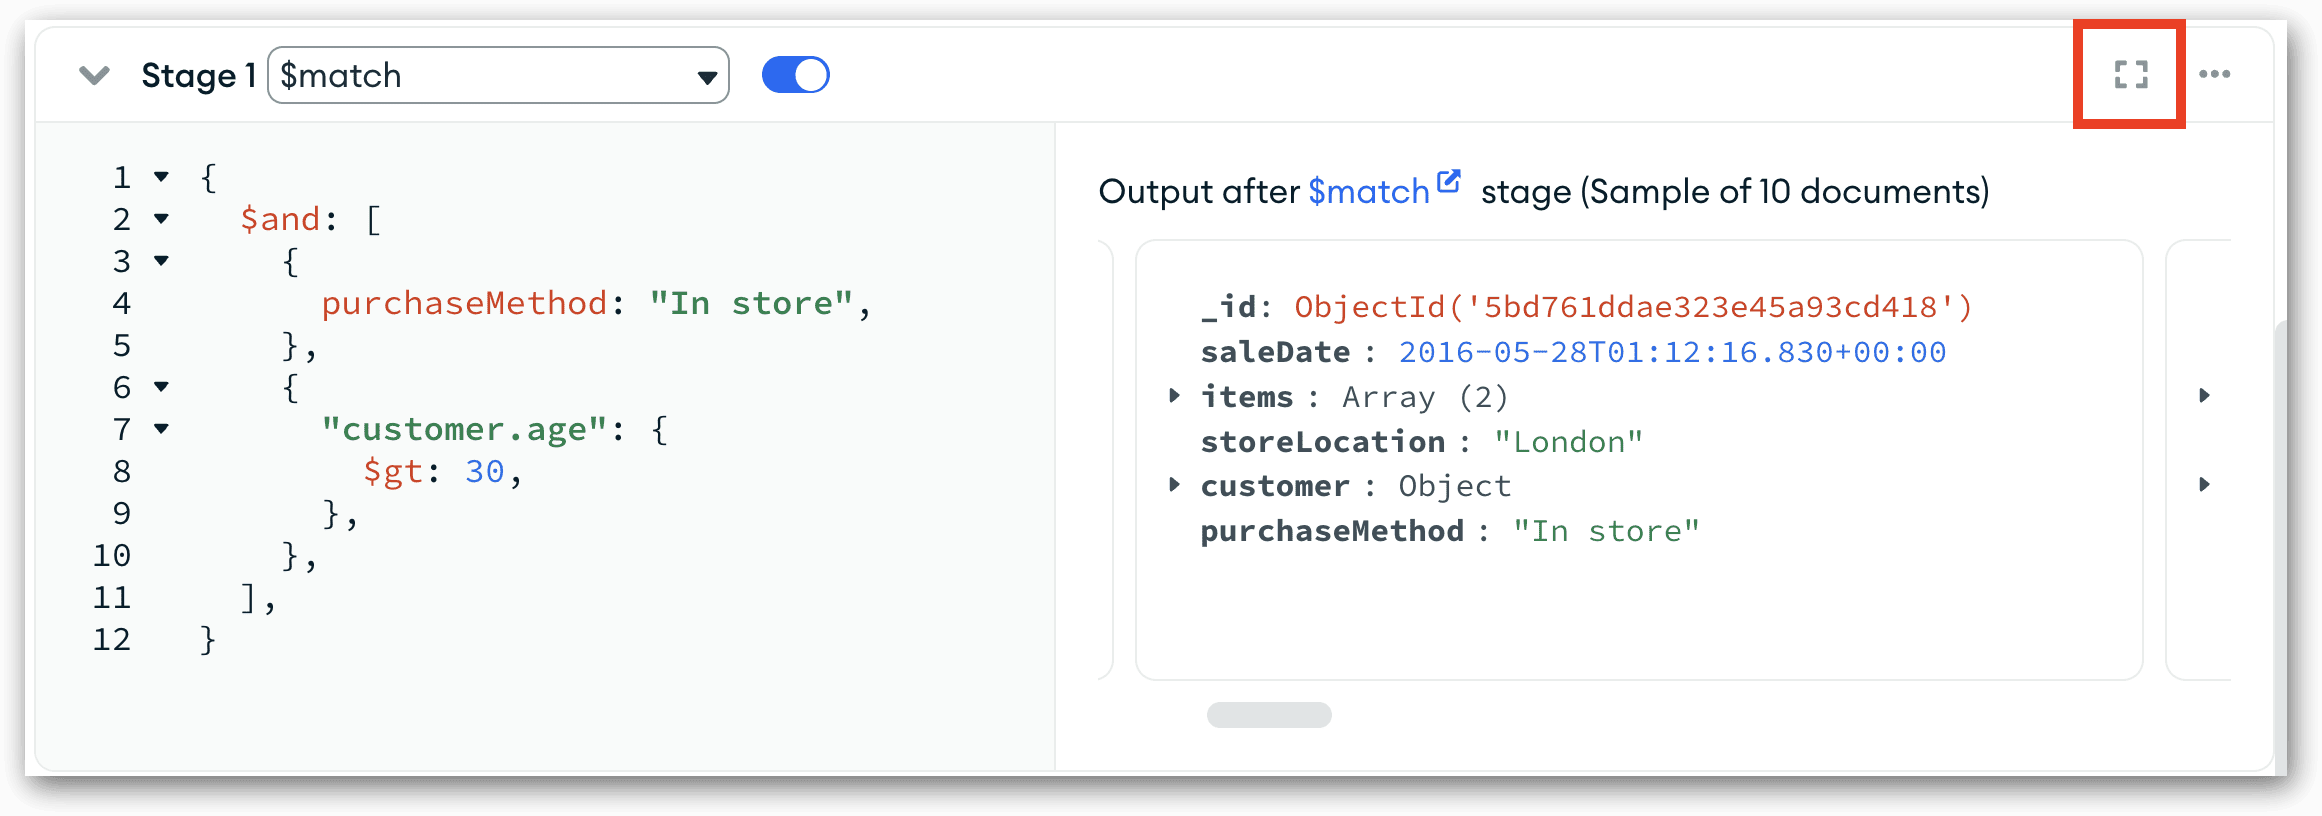
When you click the button, the Focus Mode window opens, where you can work more easily with the current stage (in this case, $match). You can edit the stage definition, as well as easily view the stage’s input and output preview documents, as shown in the following figure.
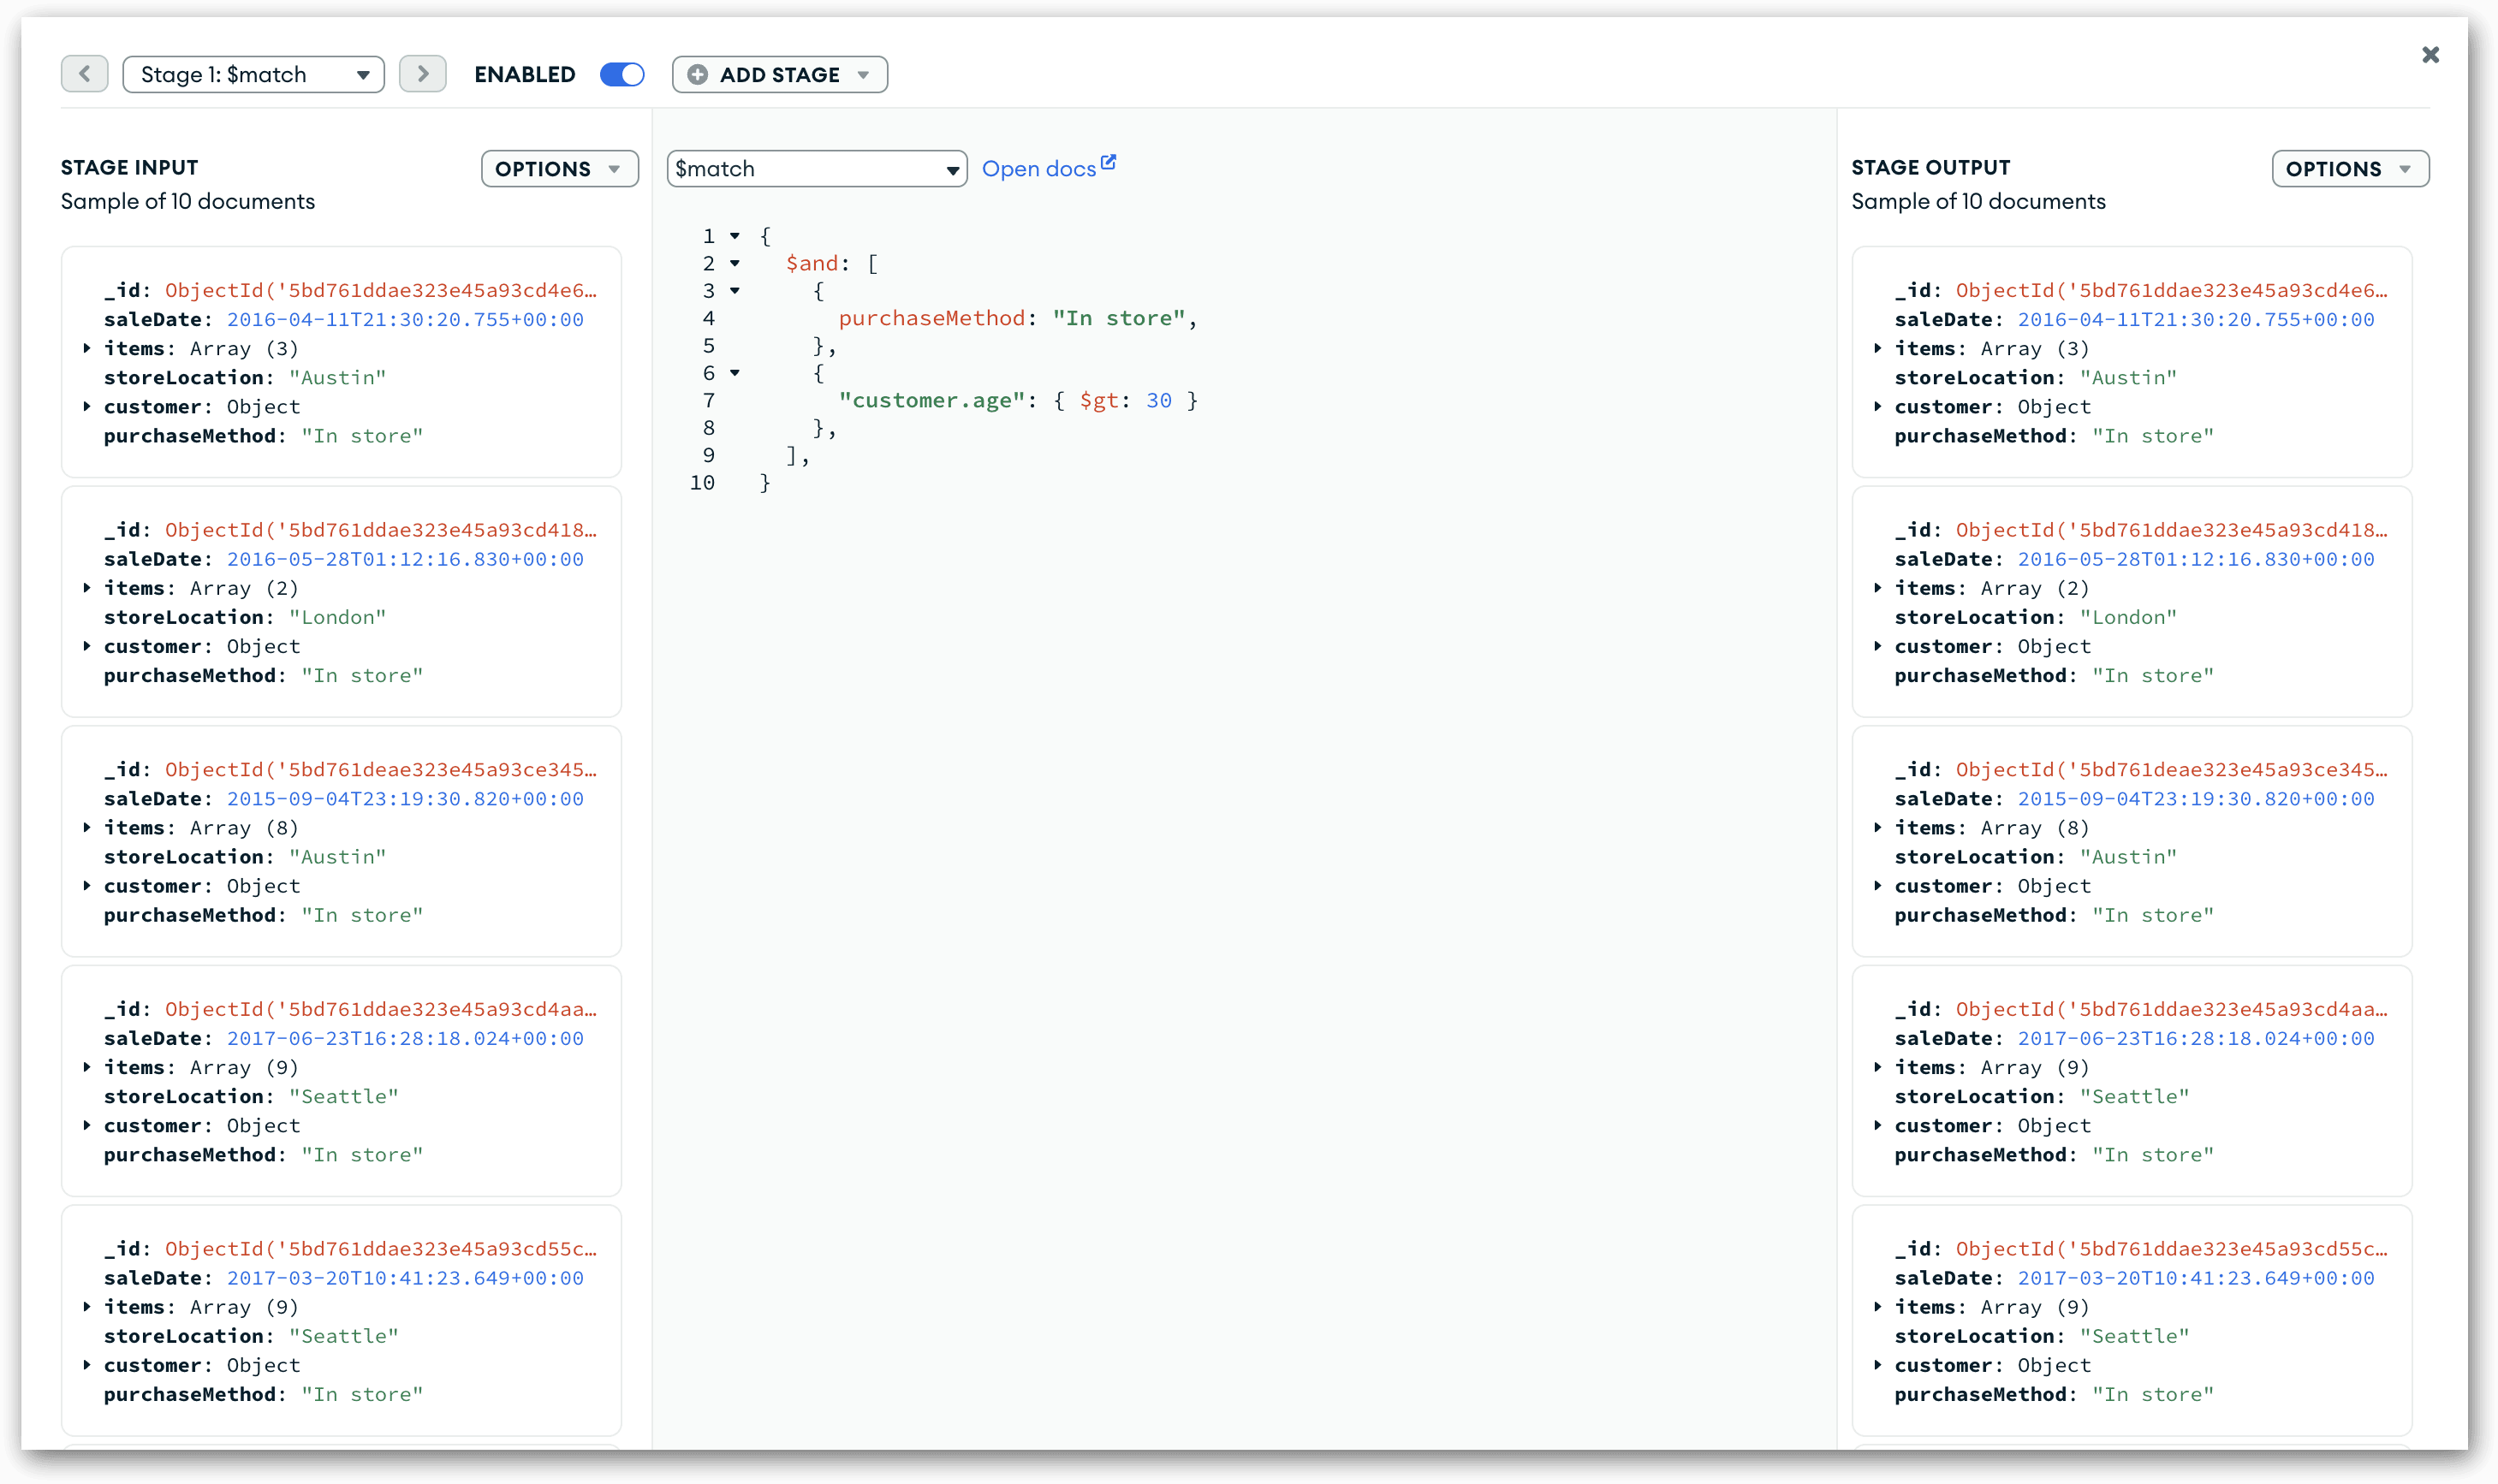
In Focus Mode, all the input and output document fields are collapsed, but you can choose to expand the fields by clicking the Options down-arrow at the top of either panel and then selecting Expand all fields. You can also expand the fields individually.
It’s up to you how much you want to use Focus Mode, but it’s well worth knowing about when building your aggregation pipelines, especially as your stage definitions become more complex.
In Stages View Mode and Text View Mode, you can also run your pipeline code at any time to view the full result set. The results are based on the currently active stages defined in the pipeline. The ability to run your pipeline code at any time is a handy feature when you want to view more than just the preview documents.
To run the pipeline code, click the Run button in the upper right corner of the Aggregations tab. MongoDB will process the pipeline and return the results to the Compass window, as shown in the following figure.
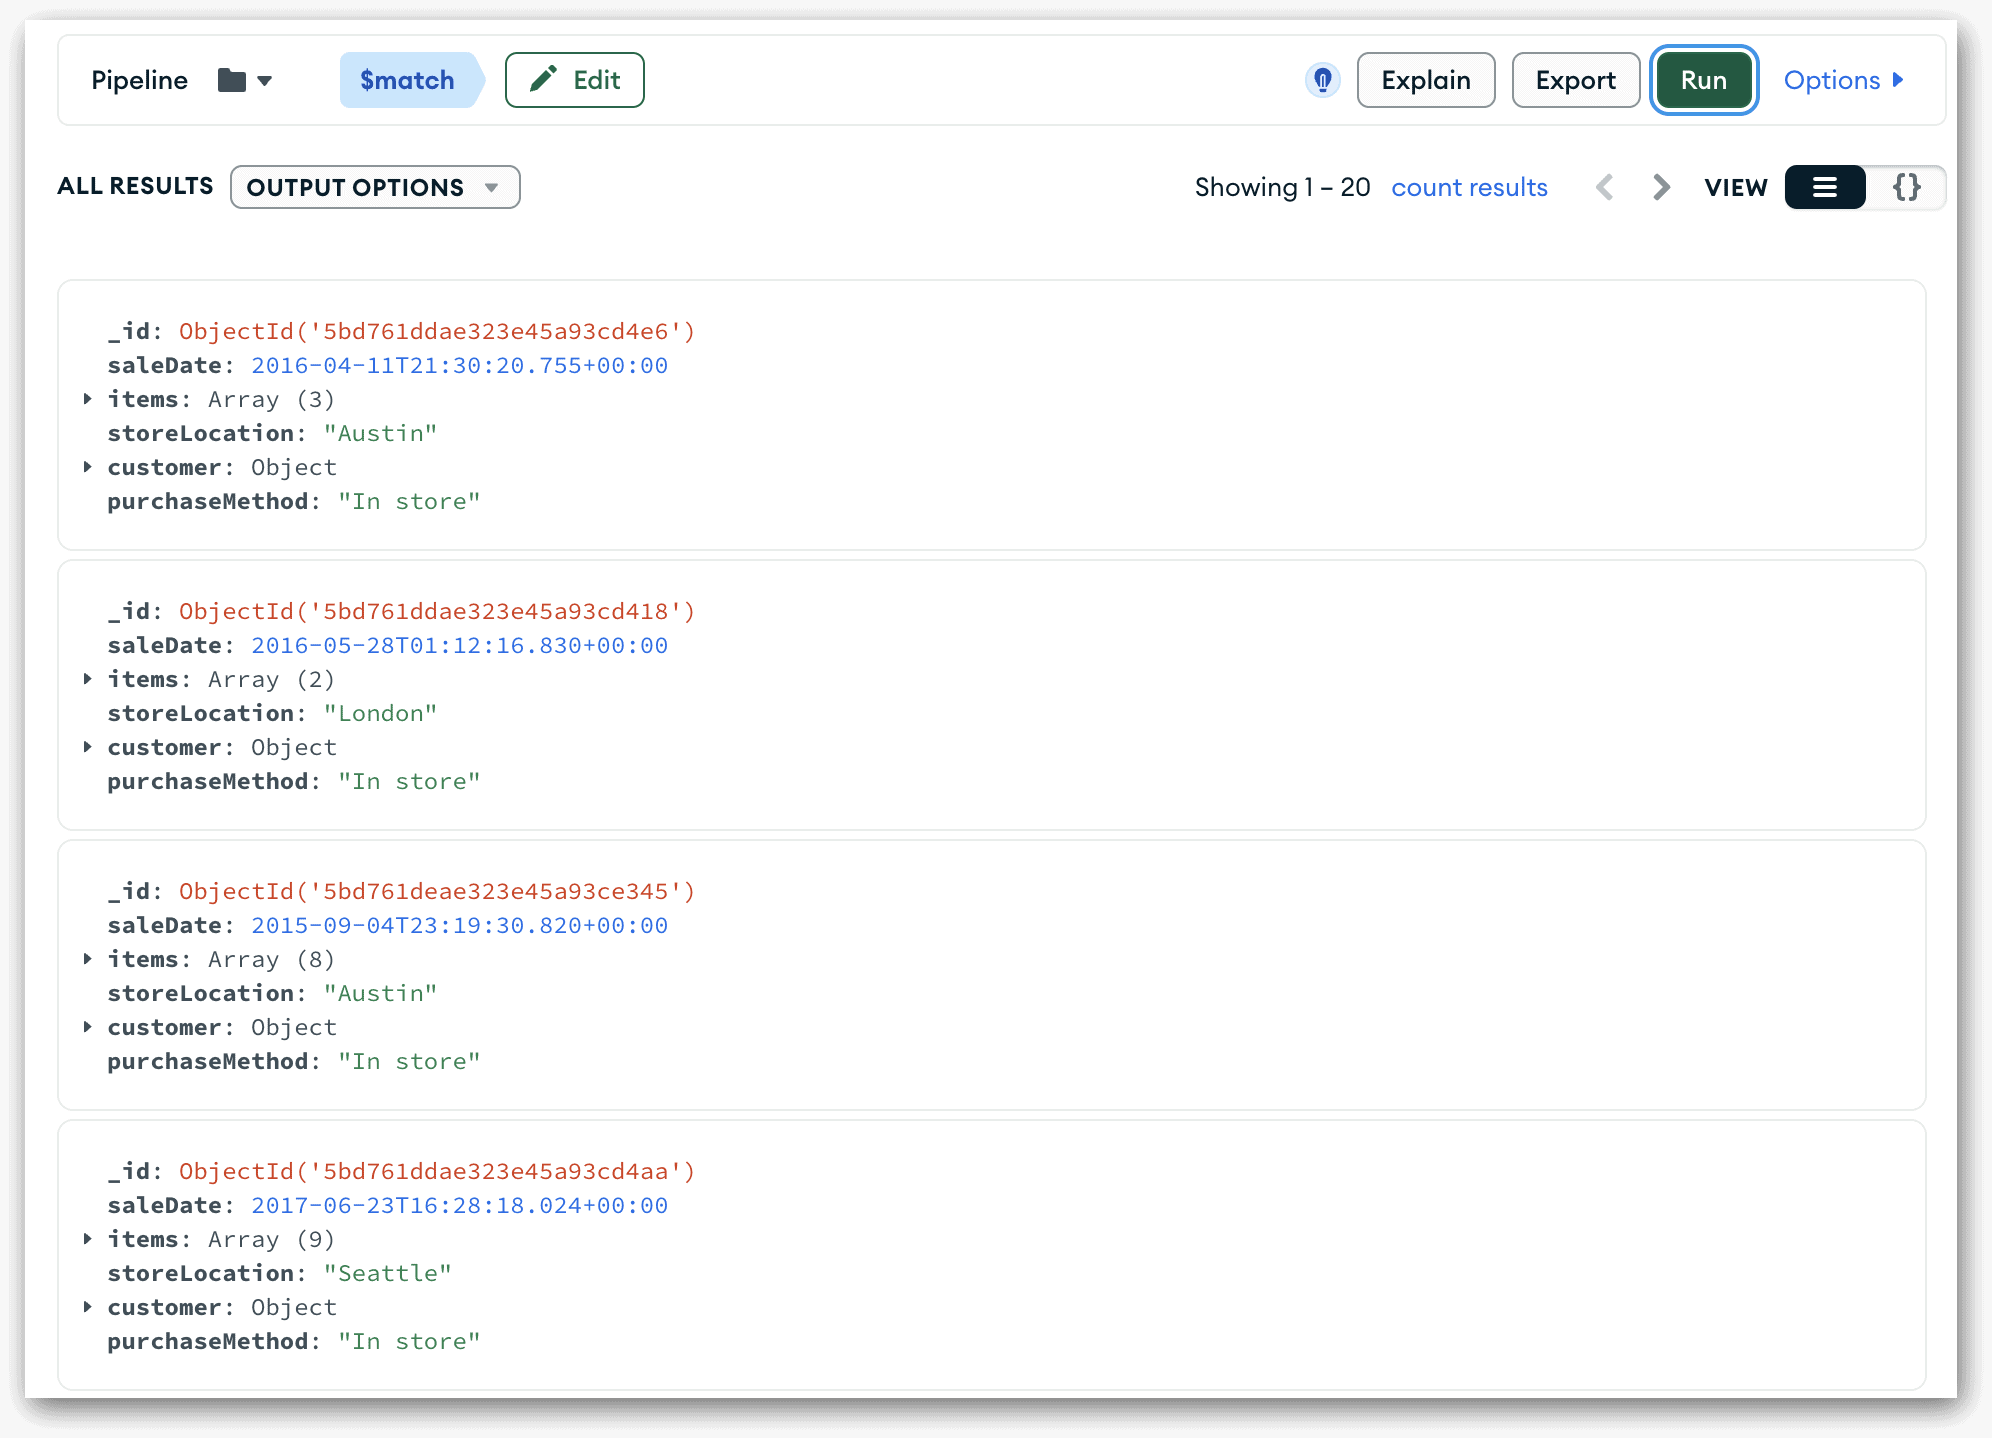
In this case, MongoDB returns 50 documents. The collection contains 100 documents, which means that the $match stage filters out 50 documents. (It’s pure chance that the $match stage filters out exactly half the documents.)
After viewing your results, you can return to Stages View Mode by clicking the Edit button near the upper left corner. You can then continue to work on the pipeline.
I also wanted to point out that you can save your work at any time. In this way, you can continue where you left off whenever you need to take a break from working on your aggregation. To save the pipeline the first time, click the Save down-arrow near the upper left corner, and then click Save. When the Save Pipeline dialog box appears, type a name for your pipeline in the Name text box, and then click Save. You can access your saved pipeline at any time from the My Queries screen.
You can also re-save your pipeline at any time. You need only click the Save drop-down list and then click Save. You should save your changes often to minimize the risk of losing your work
Adding an $unwind stage to your aggregation pipeline
Now that you’ve created the first stage to your aggregation, adding the subsequent stages should be fairly straightforward. Not surprisingly, the key is to ensure that you properly define each stage, just like you saw when building an aggregate statement in MongoDB Shell.
One of the main advantages of the Aggregations tab is its ability to display the output data for each stage as you’re working on it, making it possible to immediately verify whether your stage definition is correct and returning the data you want. If it doesn’t display output data, either you have not yet defined your stage or there is an error in your code.
With this in mind, let’s move onto the next stage, which is $unwind. The $unwind stage deconstructs a specified array and generates a document for each of the array’s elements. This makes it easier to work with the individual data elements within the array, which is useful when grouping and aggregating data.
The sales collection includes the items array. The array contains most of the values we need for grouping and aggregating the data, so this is the array we’ll specifying when defining the $unwind stage.
To add the $unwind stage, click the Add Stage button at the bottom of the Aggregations tab. Compass will add a stage row beneath the first stage row. From the Stage 2 drop-down list in the new row, select the $unwind option. (Notice how Compass automatically numbers each stage.) Next, delete the existing code in the stage’s text box and add the following code:
|
1 |
"$items" |
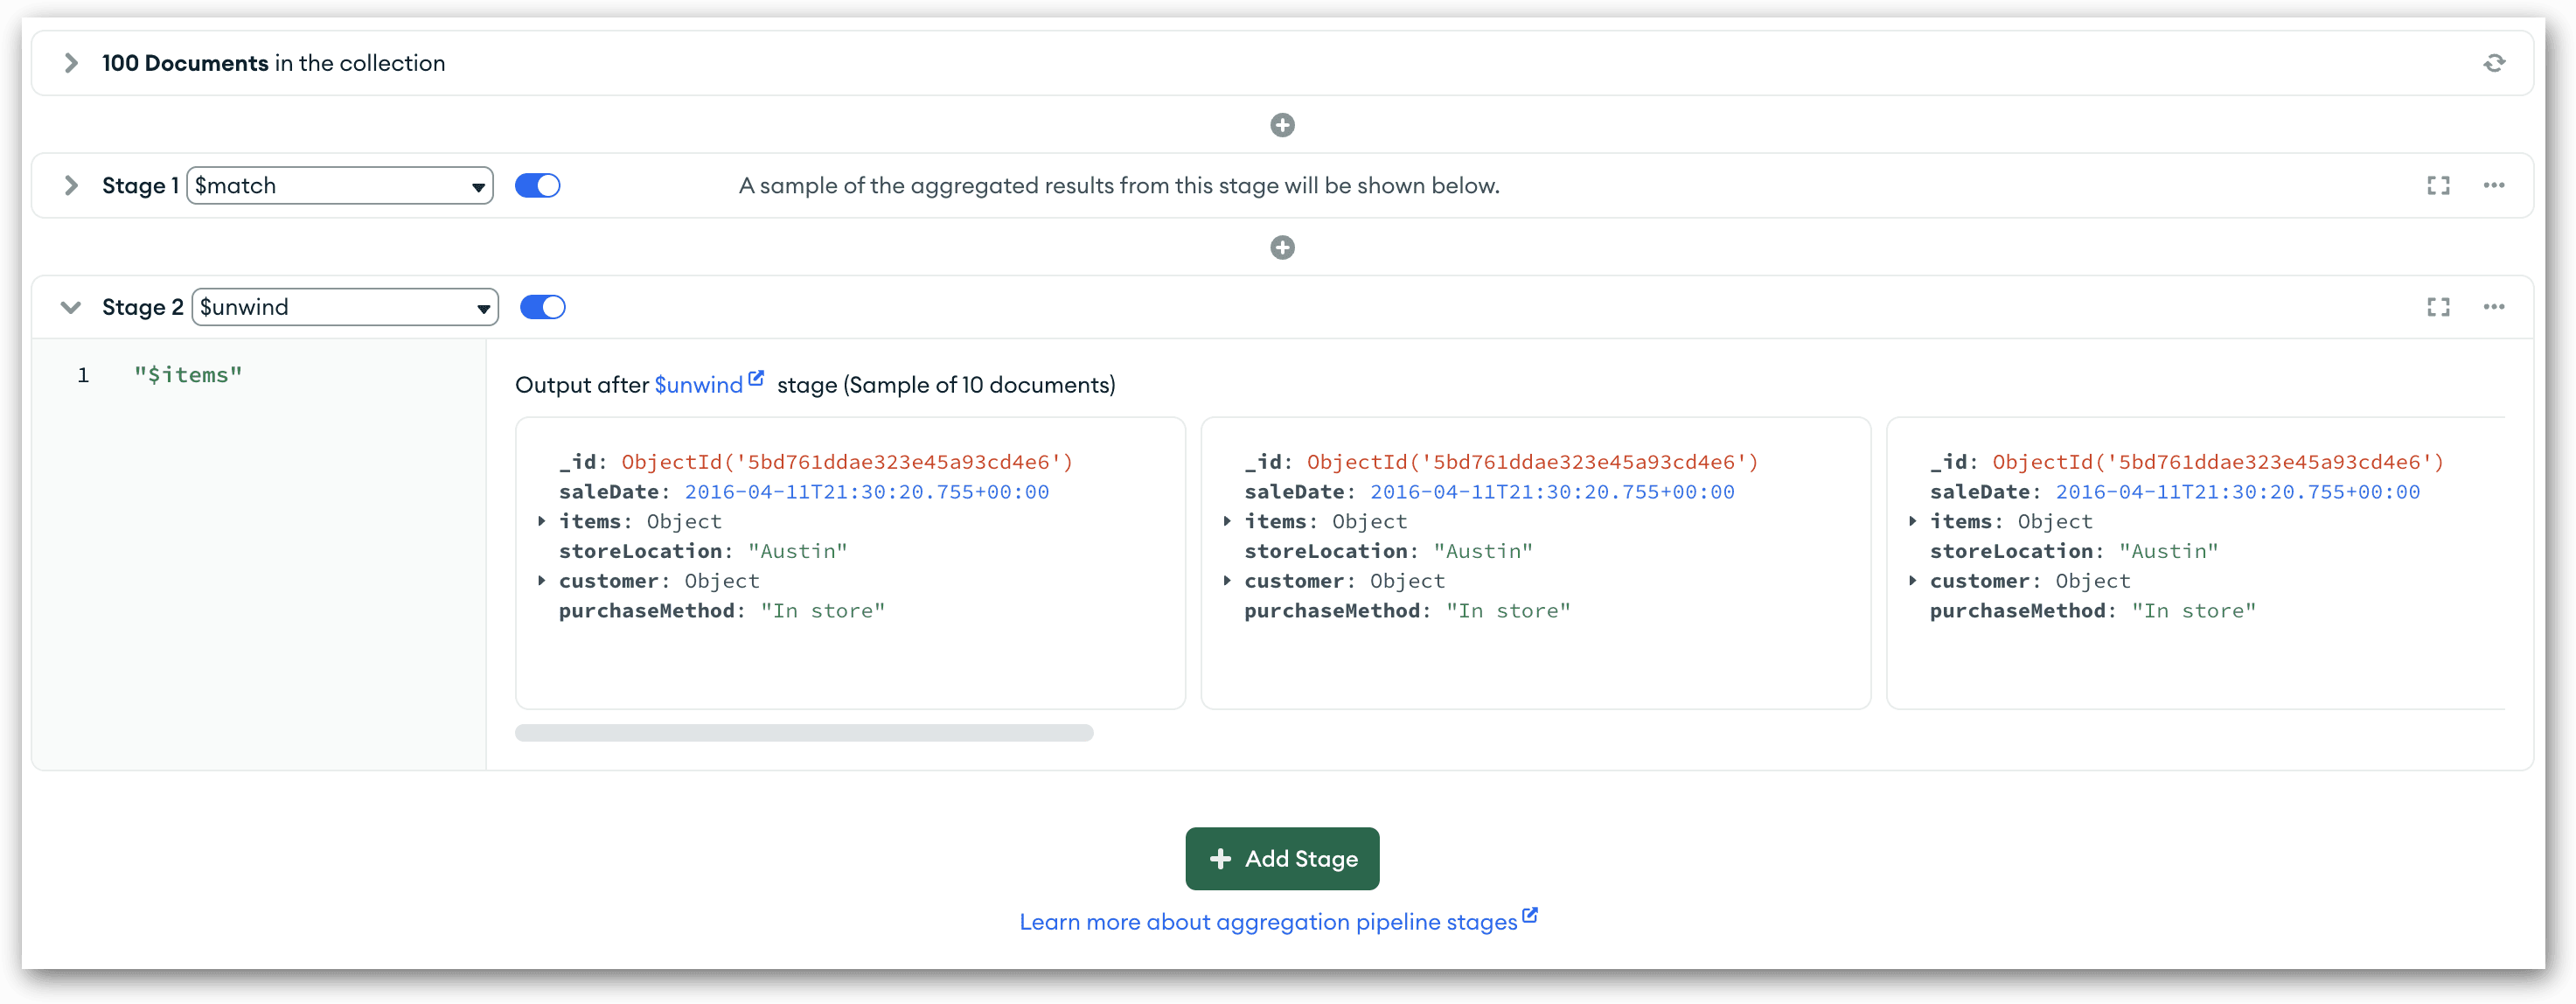
That’s all there is to it. As with the first stage, Compass displays the output preview documents to the right of the text box, as shown in the following figure. When you examine the documents, you’ll see that some of them have identical _id values. This is because they originated from the same input document.
If you were to run the pipeline with the additional stage, it would now return 263 documents, as opposed to the 50 documents that were inputted into the stage. The number of outputted documents depends on the number of elements in each document’s array.
You might have noticed in the figure that the collection row and first stage row are both minimized. You can minimize rows in this way to make it easier to view the current stage and to quickly see which stages are currently defined. All you need to do is click the arrow in the row’s upper left corner. If you want to expand a row, click the arrow again.
Minimizing stages also makes it easier to move them around. For example, suppose I had defined my pipeline with the $unwind stage first, followed by the $match stage, as shown in the following figure.
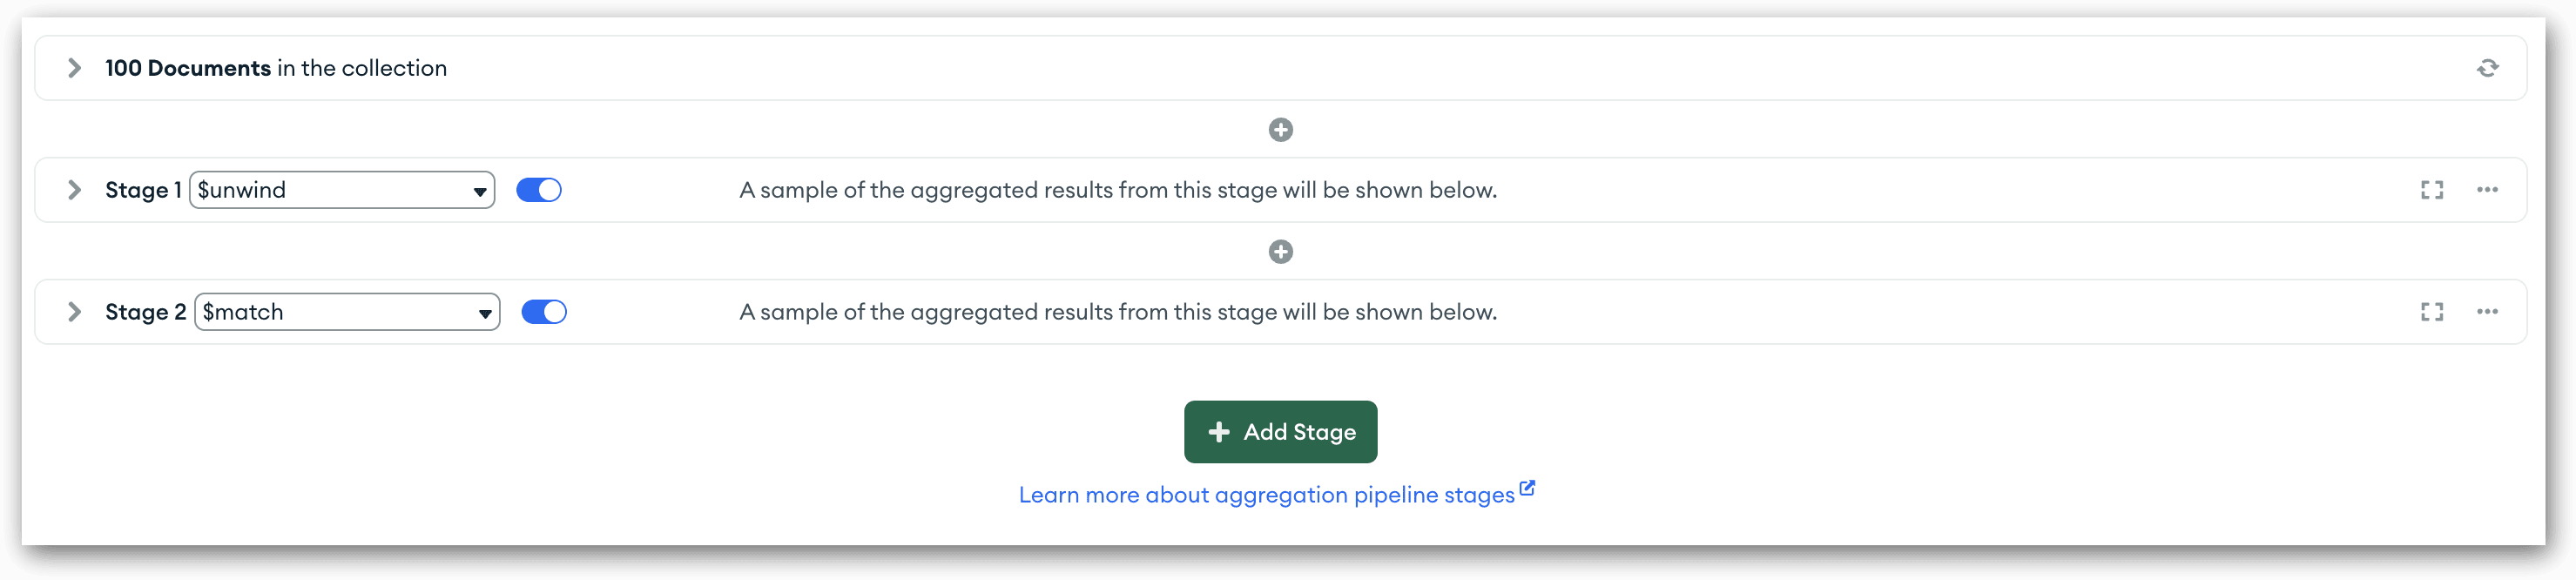
After defining the two stages, I might then decide it would be better to start with $match stage. To change the stage order, all I need to do is to drag the $match stage upward, to just above the $unwind stage. Compass will automatically renumber the stages and process them in their new order. Note, however, that when you start moving stages around, you could potentially break the pipeline because of dependencies that exist between stages, so be sure to proceed cautiously whenever you start moving stages.
Another feature on the Aggregations tab that I wanted to point out is the ability to add a stage before any existing stage. All you need to do is click the plus icon above that stage. In addition, each stage includes an options button (the ellipses in the row’s upper right corner), which opens a menu that lists several options. From this menu, you can add a stage before or after the current stage. You can also delete the existing stage, expand all the fields in the preview documents, or collapse all the fields in those documents.
Adding a $group stage to your aggregation pipeline
The $match and $unwind stages have helped us prepare our documents for grouping and aggregating them. Once we have the documents the way we want them, we can add a $group stage, which we’ll be using to group the documents by both the items.name field and customer.gender field.
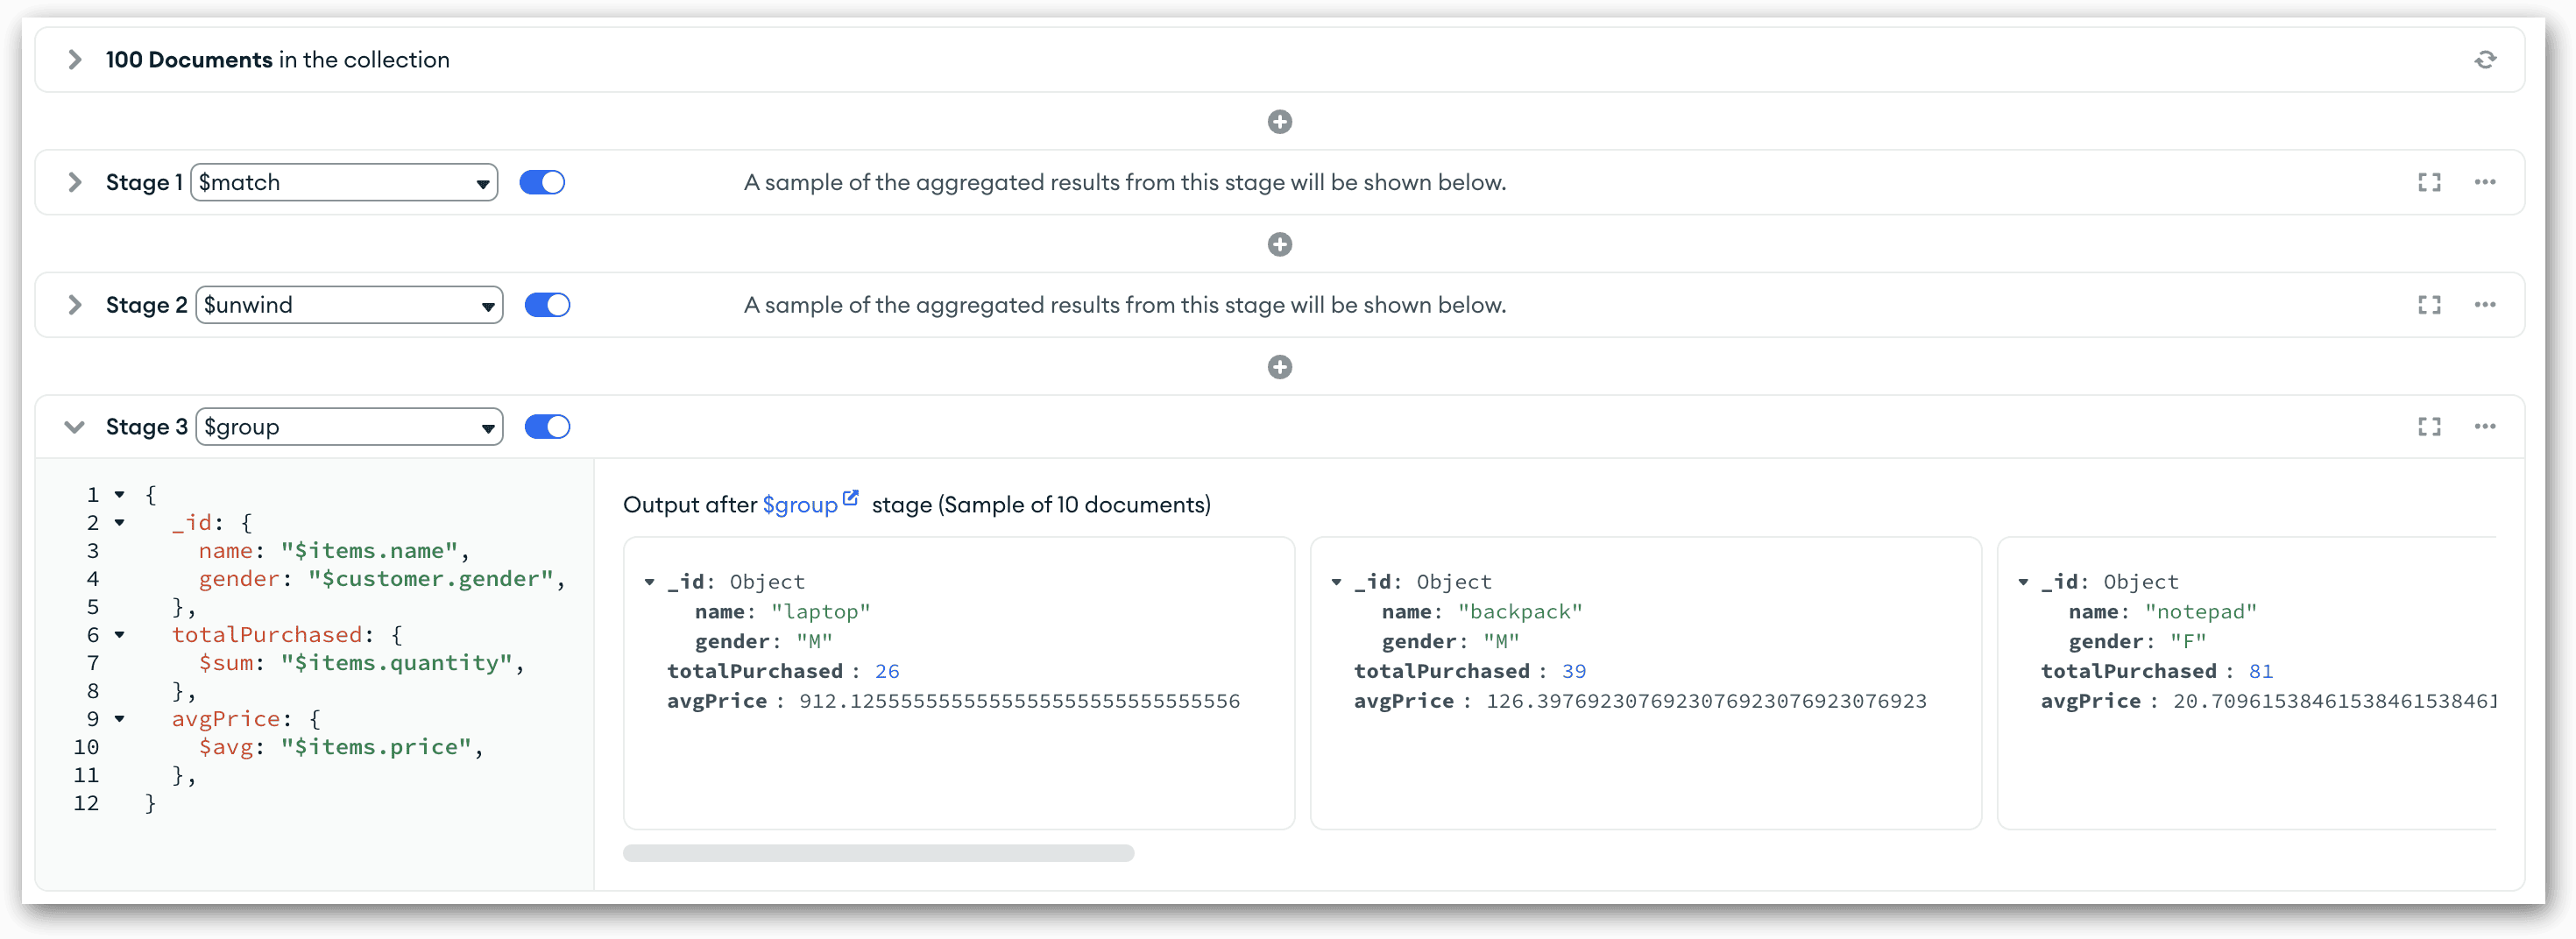
To add the $group stage, click the Add Stage button. In the new stage row, select the $group option from the Stage 3 drop-down list and delete the existing code in the row’s text box. Next, copy the following code and paste it into the text box:
|
1 2 3 4 5 6 7 8 9 10 11 12 |
{ _id: { name: "$items.name", gender: "$customer.gender", }, totalPurchased: { $sum: "$items.quantity", }, avgPrice: { $avg: "$items.price", }, } |
The code instructs MongoDB to group the documents first by the items.name field and then by the customer.gender field. When specifying the field names, you must precede each one with a dollar sign because it is part of an expression. The items.name group will be returned as the name output field, and the customer.gender group will be returned as the gender output field. Both output fields are part of the _id field, which is outputted as an embedded document.
The remaining two elements in the code define the two aggregations. The first one uses the $sum operator to add together the values in the items.quantity field and return that total to the totalPurchased output field. The second one uses the $avg operator to find the average price of each product group, based on the items.price value. This total is assigned to the avgPrice output field.
As soon as you add this code to your stage’s text box, you’ll see the preview documents, as shown in the following figure. The pipeline now includes only the grouped and aggregated data. Notice that the _id field is an embedded document that contains the name and gender fields.
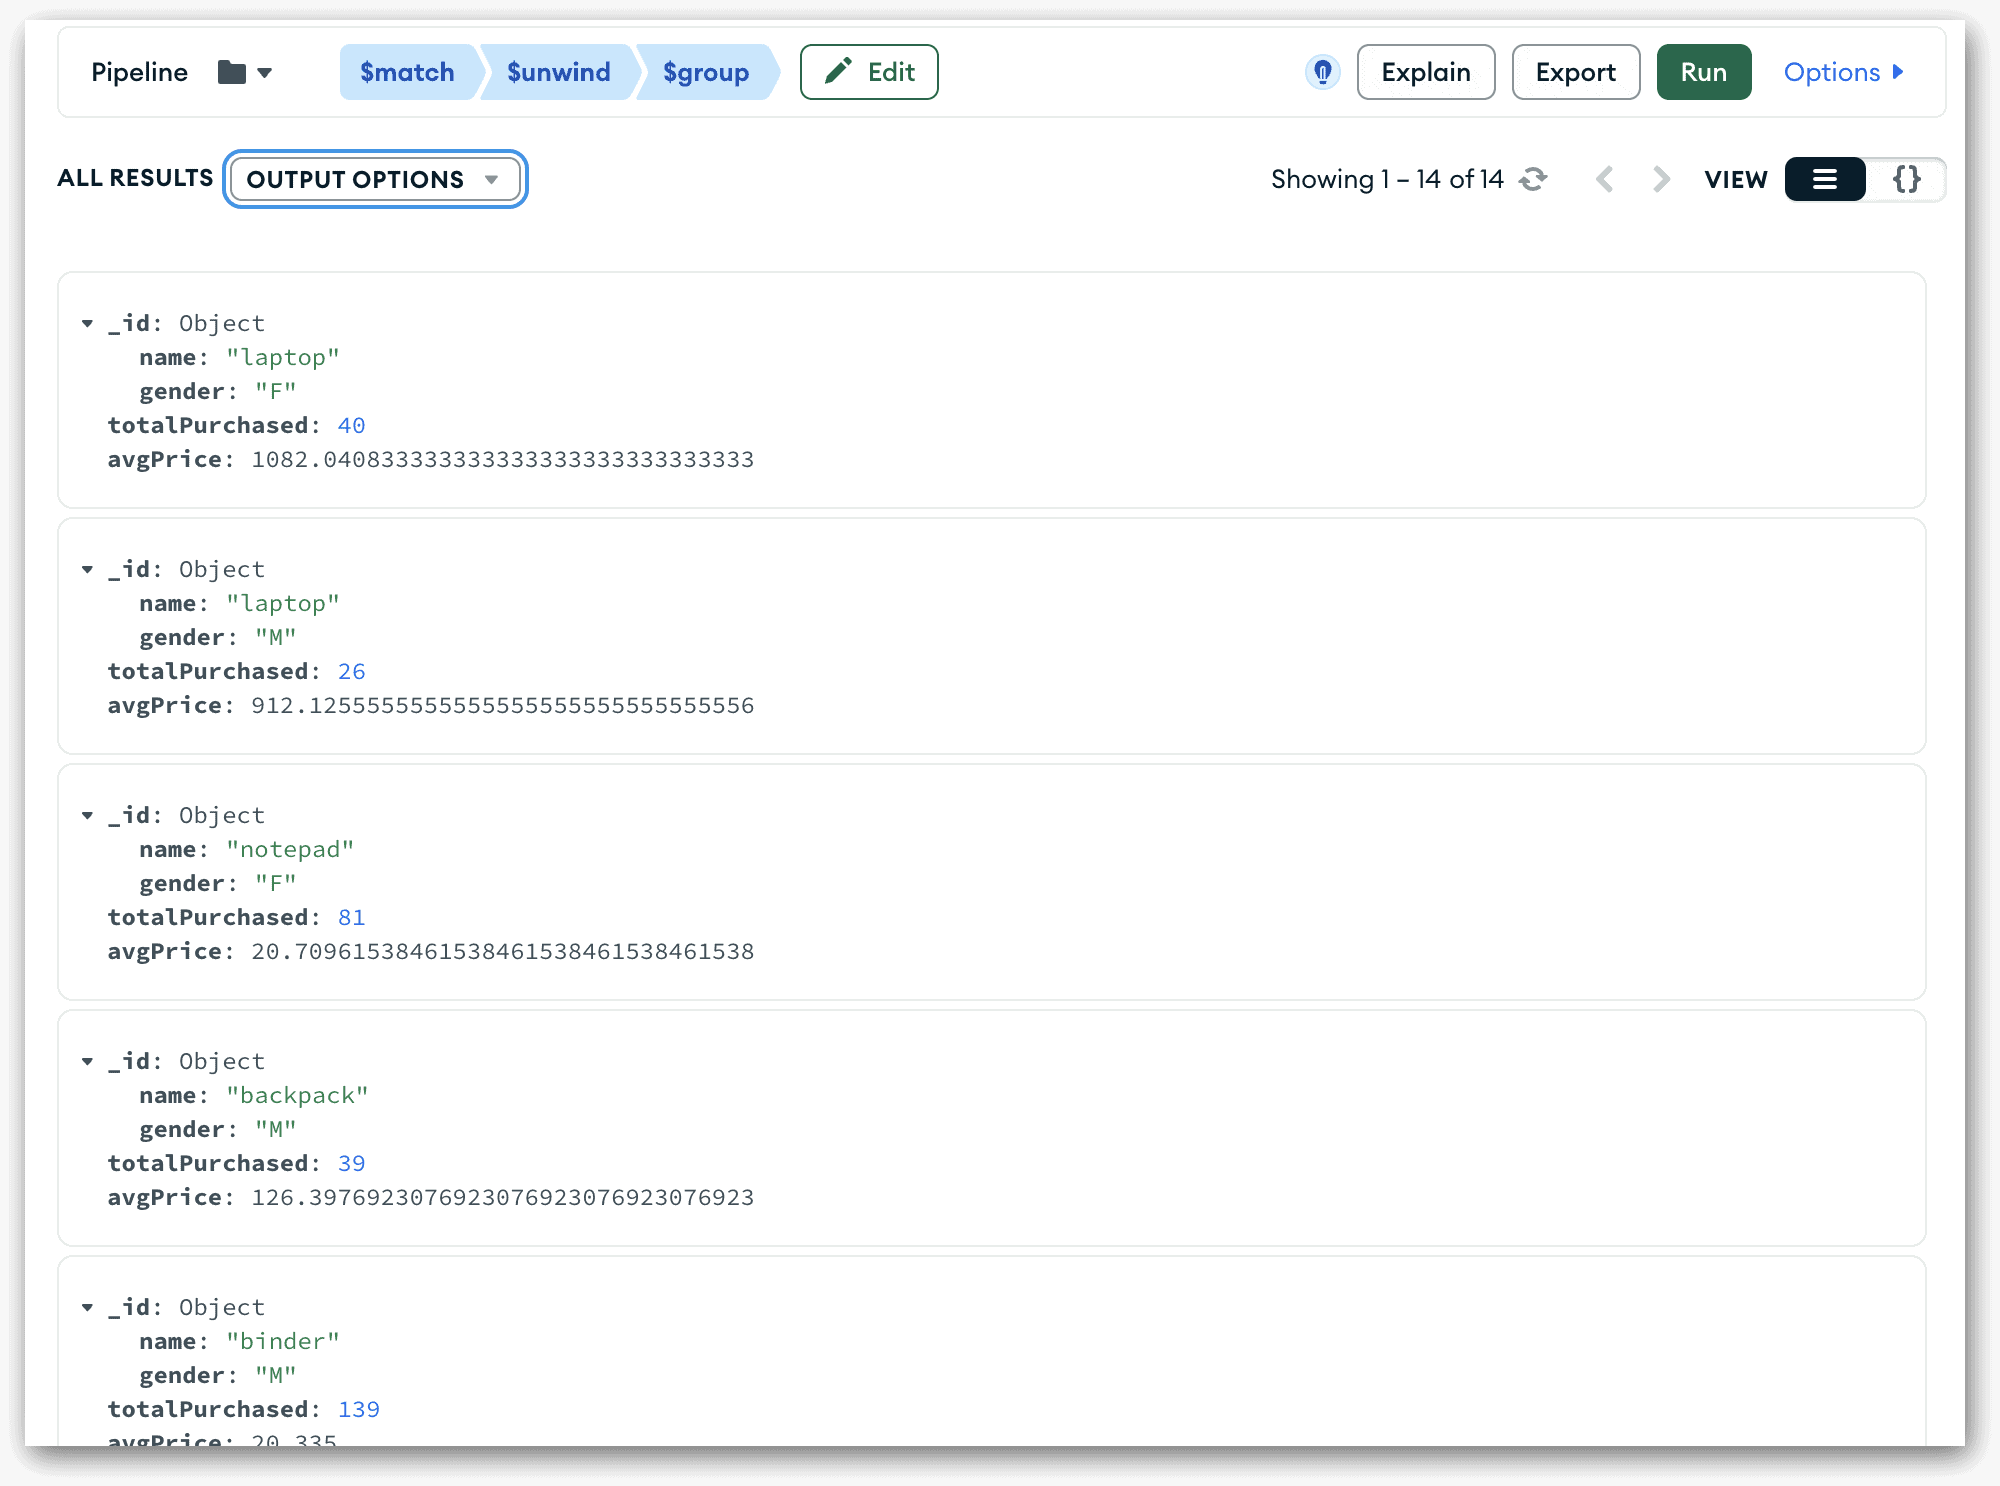
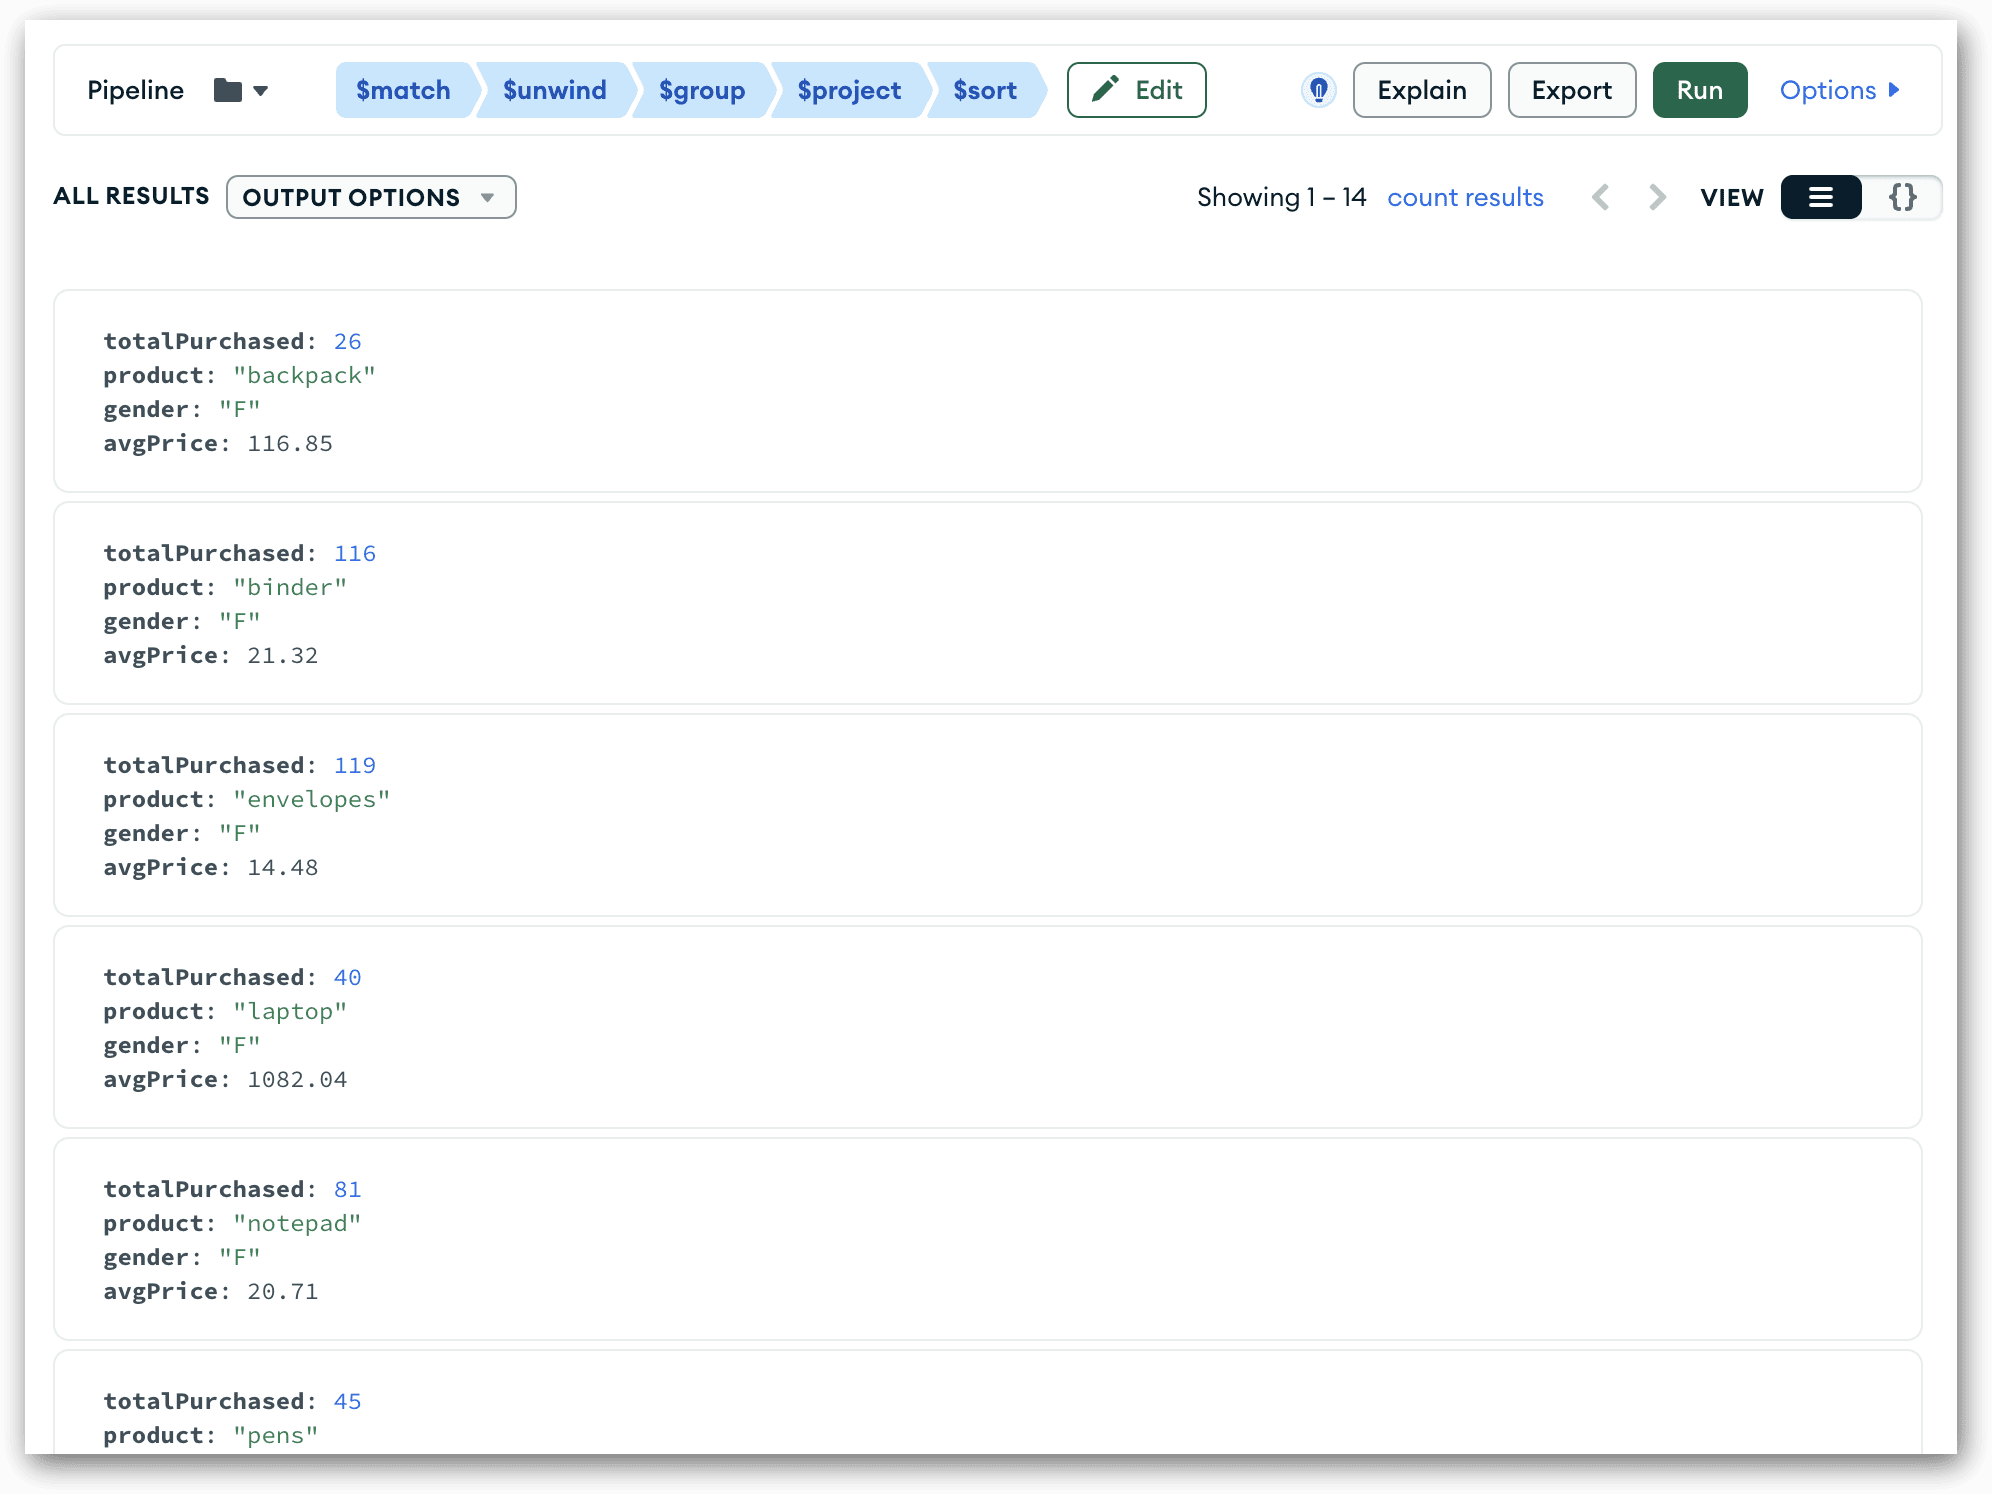
You can run the pipeline to verify your changes. As before, click the Run button in the upper right corner. At this point, the pipeline should now include only 14 documents. The following figure shows part of the results.
One other item worth noting is that the Aggregations tab displays a set of icons near the upper left corner, with one icon for each pipeline stage. The icons include all the currently enabled stages, listed in the order that they’re specified in the pipeline. I say “currently enabled stages” because it’s possible for stages to be disabled.
Each stage row in the Stages View Mode includes a toggle in the upper left corner that lets you enable or disable that particular stage. The stages are enabled by default, but you can disable one or more of them as you’re working on your pipeline. When you disable a stage, it is no longer included in the pipeline’s processing, nor is it in the set of icons near the top.
For example, you might want disable the $match stage so you can see the aggregated totals for the entire collection rather than only a subset of documents. Once you get the information you need, you can then re-enable the stage without having to do any special coding.
Adding a $project stage to your aggregation pipeline
After you’ve grouped and aggregated your data, you might find it useful to modify the fields themselves. For this, you can use the $project stage, which lets you add fields, remove fields, change their names, or modify their values. For this example, we’ll use the stage to change the name and gender fields to top-level fields, removing the _id field in the process. We’ll also round the avgPrice values to two decimal places.
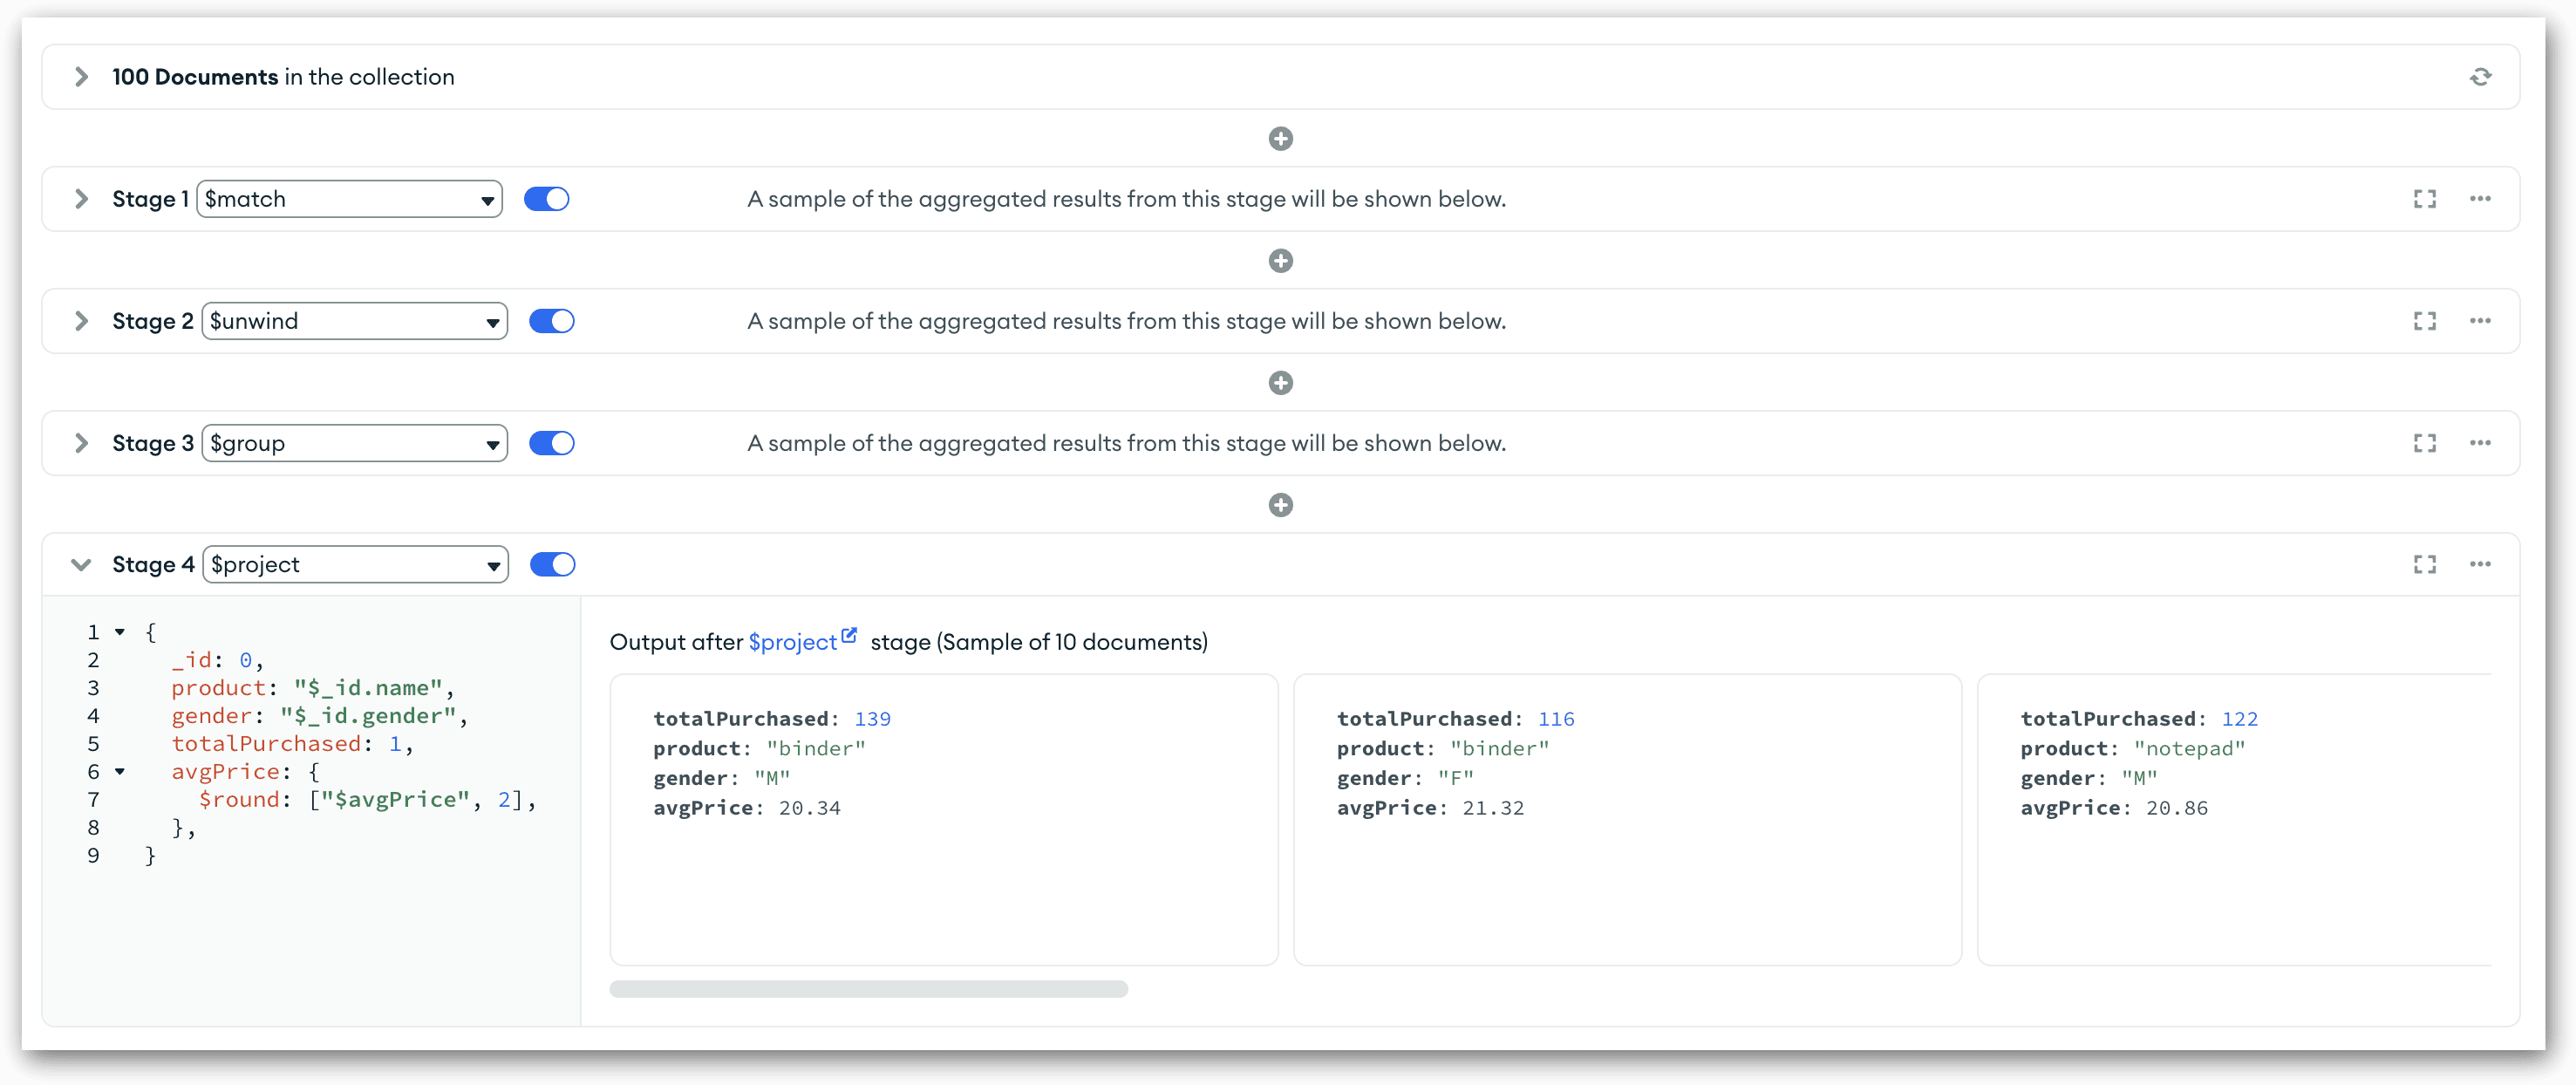
To add the $project stage, click the Add Stage button. In the new row, select the $project option from the Stage 4 drop-down list and delete the existing code in the text box. Next, copy the following code and paste it into the text box:
|
1 2 3 4 5 6 7 8 9 |
{ _id: 0, product: "$_id.name", gender: "$_id.gender", totalPurchased: 1, avgPrice: { $round: ["$avgPrice", 2], }, } |
The stage definition includes the following five specifications:
- The first specification states that the
_idfield should be suppressed. This is done by assigning a value of0to the field. The_idfield is included by default, so you must specifically suppress it if you don’t want it there. - The second specification creates a new field named
productand assigns the original_id.namevalue to the new field. - The third specification creates a new field named
genderand assigns the original_id.gendervalue to the new field. - The fourth specification indicates that the
totalPurchasedfield should be included. If you don’t specify its inclusion, MongoDB automatically excludes it from the output. This is true for all fields except the_idfield. - The last specification defines a field named
avgPrice. The field’s expression rounds the values of the inputavgPricefield to two decimal places. In effect, you’re replacing the original field with a new field with the same name.
As you’ve seen with the previous stages, when you add the code to the stage’s text box, Compass automatically displays the preview documents, as shown in the following figure. The documents no longer include any embedded fields, and the average prices are more readable.
That’s all you need to do to define the $project stage. As before, you can run your pipeline up to this point, disable specific stages, or make other changes. Be sure to save your changes periodically so you don’t lose any of your work.
Adding a $sort stage to your aggregation pipeline
The final stage we’ll be adding to our pipeline is the $sort stage, which orders the documents based on the specified fields. You can sort the documents by one or more fields, and you can choose to sort each field in either ascending or descending order. In this case, we’ll be sorting the documents in ascending order, first by the gender field and then the product field.
To add the $sort stage, click the Add Stage button and select the $sort option from the Stage 5 drop-down list. In the text box, delete the existing code, copy the following code, and paste it into the text box:
|
1 2 3 4 |
{ gender: 1, product: 1, } |
The code assigns a value of 1 to both fields, indicating that they should both be sorted in ascending order. If we wanted to sort the values in descending order, we would have specified -1. The following figure shows the new stage, along with the preview documents.
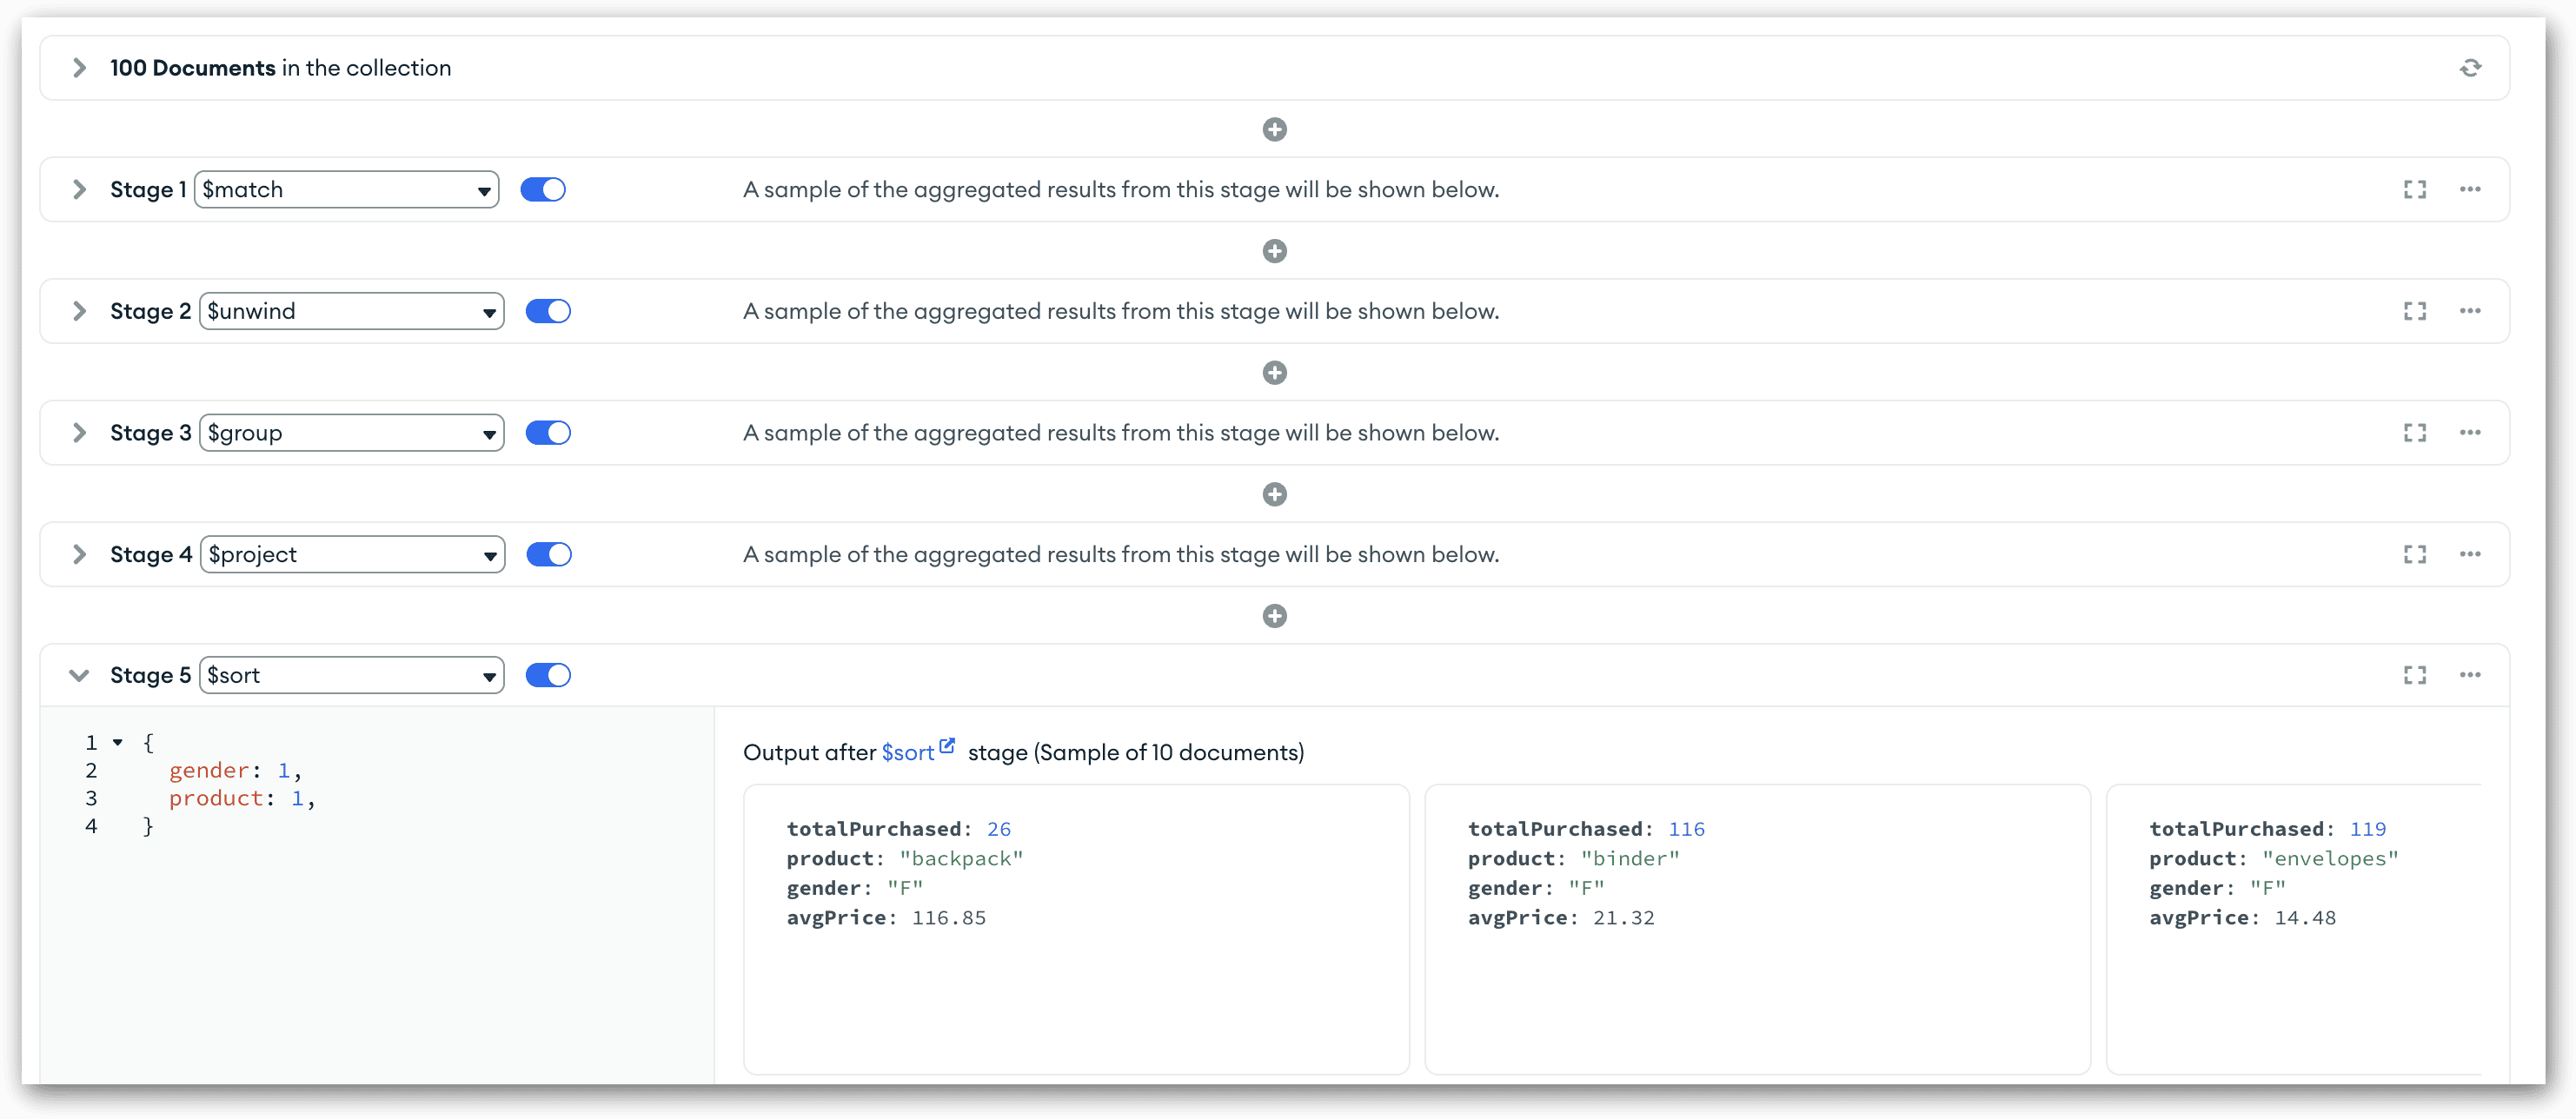
Given that the $sort stage is the final one you’ll be adding to your pipeline, this is a good time to run the pipeline code again to ensure that it gives you the results you want. The documents should now be sorted first by the gender field and then the product field, as shown in the following figure.
If everything looks good and you’re satisfied with your pipeline, you can copy the full pipeline definition and use it in your aggregate statements. Compass makes it fairly easy to copy the code. First, click the Edit button to return to Stages View Mode (if you haven’t already) and then click the EXPORT TO LANGUAGE button. This launches the Export Pipeline To Language dialog box, shown in the following figure.
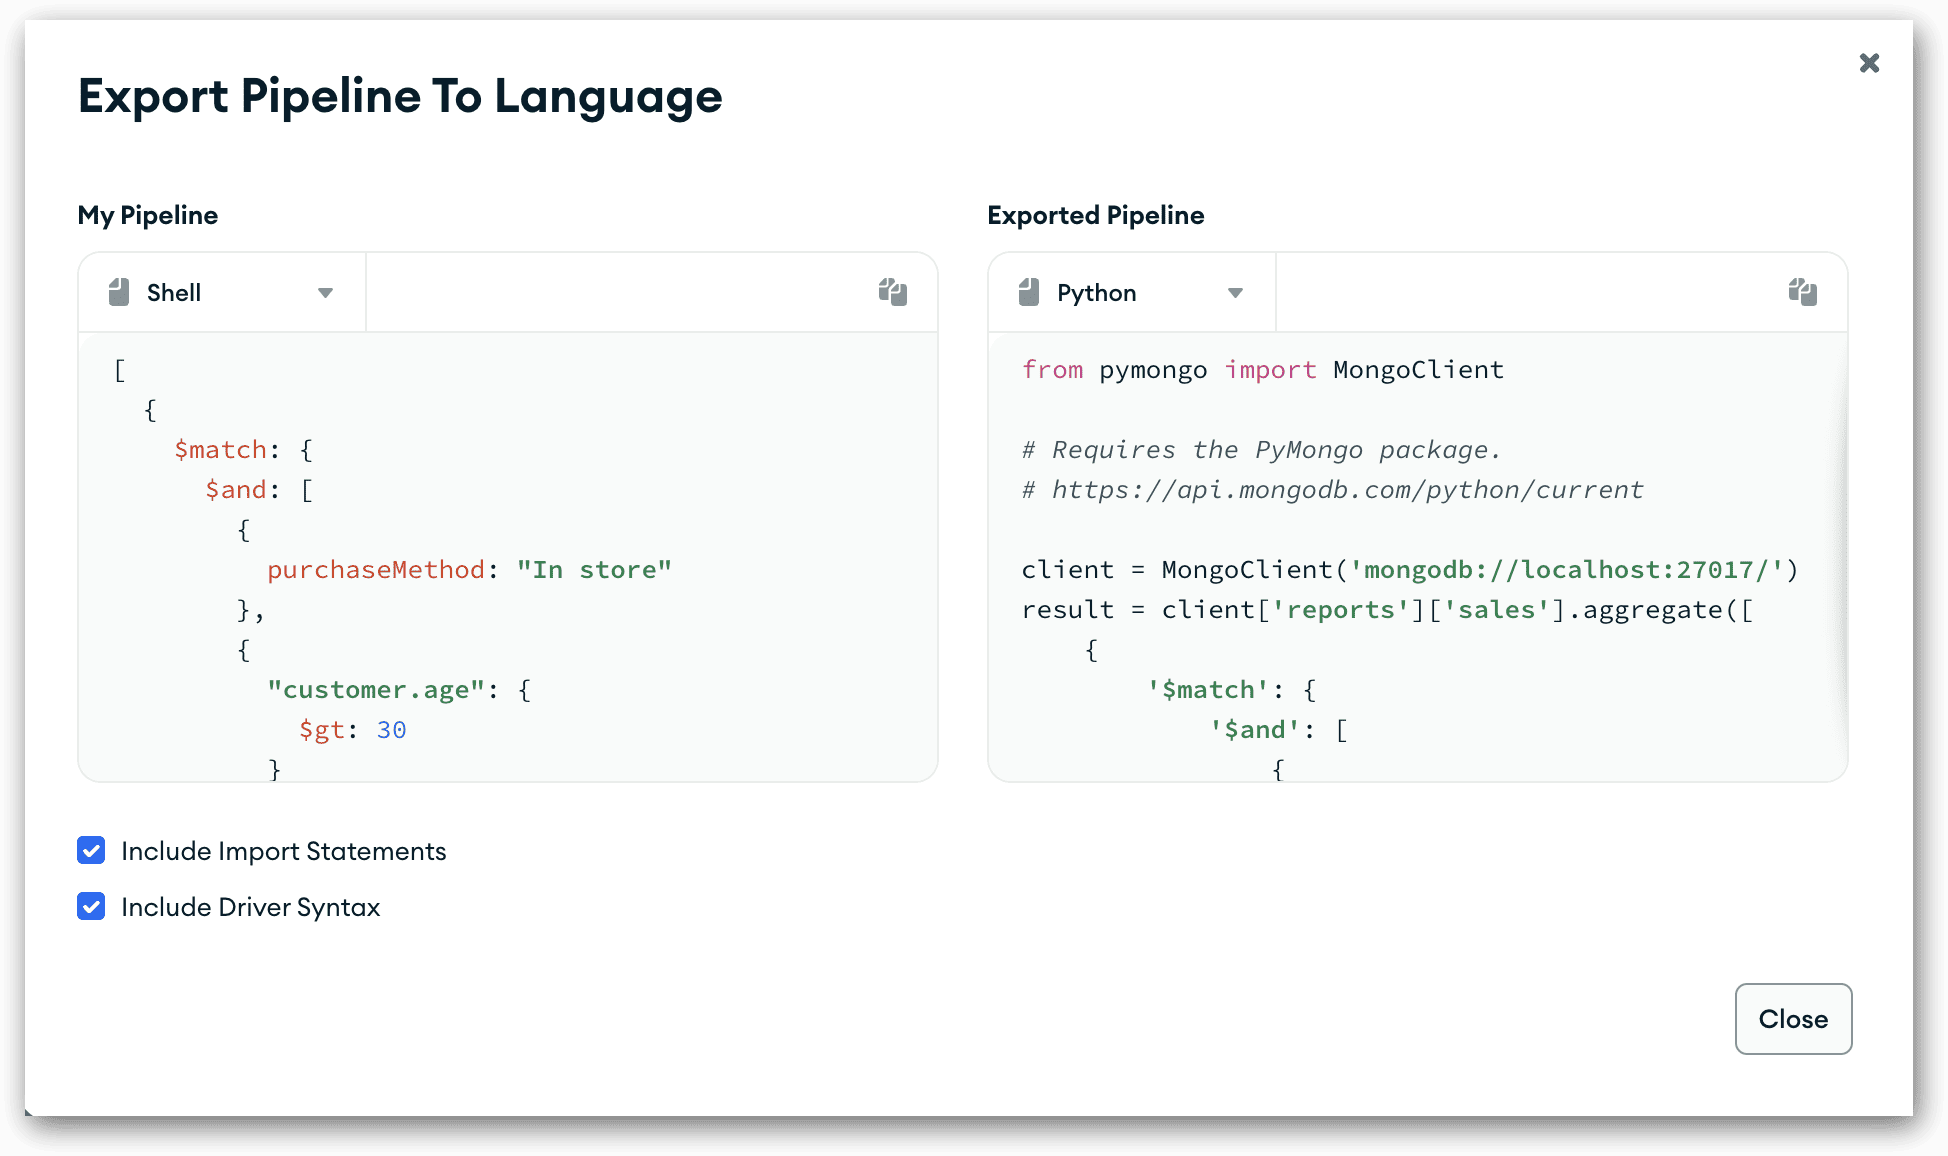
In the dialog box, you can copy the pipeline code to your clipboard. The code is available for MongoDB Shell (in the left pane) as well as for specific programming languages (in the right pane), including Python, Java, Node, C#, Ruby, and several others. You also have the option to include the applicable Import statements with the programming code, as well as the driver syntax. (Both options are selected in the figure.)
Getting started with MongoDB aggregations in MongoDB Compass
In this article, I’ve tried to cover most of the features available to the Aggregations tab in the Compass interface. I’ve also demonstrated how to add various stages to your pipeline through this tab. I encourage you to play around with the interface so you have a good sense of how everything works. I think you’ll find that this is a very useful and intuitive tool for building your aggregations.
One thing I did not cover, however, is the Stage Wizard, which you can access by clicking the Wizard button in the upper right corner. The wizard provides a set of templates for creating basic aggregations. Its purpose is mainly to help you get started with building an aggregation pipeline. You might find this helpful in some use cases, especially when first learning how to build aggregation pipelines. The Aggregations tab also includes several other features that you might want to explore.
Regardless of the many features available on the Aggregations tab, it’s still important that you have a foundation in how an aggregate statement works, particularly the aggregation pipeline. The better you understand these concepts, the more effectively you can use the tab’s features.
Appendix: Preparing your MongoDB environment
For the examples in this article, I used MongoDB Atlas to store the data and MongoDB Compass to work with that data. This is the same approach I used for the previous articles in this series. The first of these articles explains how to set up the two environments.
The examples in this article are based on a collection I created from the sample_supplies database available through MongoDB Atlas. This is the same data I used for the previous article, so if you set up your environment for that article, you should by all set.
If you did not set up the environment and want to try out these examples in this article, you’ll need to download the sales.json file and save it to a folder that you can access from within MongoDB Compass. You’ll then need to take the following steps to import the data into your collection:
- In MongoDB Compass, connect to your cluster on MongoDB Atlas, if you’re not already connected.
- In the left panel, click the Create database button (plus sign), which is located to the right of the Databases node.
- In the Create Database dialog box, type reports in the Database Name text box, type sales in the Collection Name text box, and click Create Database.
- After the database and collection have been created, select the sales collection node in the left panel if it’s not already selected.
- In the main window, on the Documents tab, click the Add Data drop-down arrow and click Import JSON or CSV file.
- When your system’s file manager window appears, navigate to the folder that contains the sales.json file, select the file, and click Select. Compass will load the data into the
salescollection.
That’s all you need to do to try out the examples in this article. I plan to go into more detail about both importing and exporting data later in the series.


Load comments