

Welcome back to our comprehensive guide on optimizing MySQL performance using MySQL Shell. So far in this series, we introduced you to MySQL Shell, focusing on its features and how it can be used to configure basic MySQL settings, before we dived into the topic of memory and CPU optimization, walking you through how to configure MySQL to use resources efficiently. In the third article, we looked into disk I/O performance and how optimizing data storage and retrieval is important for speed, and in part four we took you through network and query performance tuning, showing how to adjust parameters and improve query execution.
Manual performance tuning may work for smaller systems, but as your infrastructure grows along with the volume and complexity of your data, manual tweaks quickly become unsustainable. That’s where MySQL Shell comes in.
In this article, we’ll focus on building the foundation for automated performance monitoring and optimization. We’ll start by creating a system to collect and store performance metrics, then also look at how to integrate with external monitoring tools like Prometheus for enhanced visibility.
The goal isn’t just to collect data for the sake of it, or just save time (though it definitely will) – it’s about making sure your server stays fast, stable, and efficient no matter what happens behind the scenes. We want actionable insights. We’ll write scripts that can analyze performance trends, identify issues, and even make configuration adjustments automatically.
By the end of the article you’ll have a comprehensive monitoring and analysis system that forms the backbone of intelligent database management. This foundation will set us up perfectly for the automation techniques we’ll cover in Part 5b.
Every script featured in this article is available in this GitHub repo.
Collecting MySQL Performance Metrics
Before we can automate performance tuning, we need to collect performance metrics directly from MySQL:
|
1 2 3 4 5 6 7 8 9 10 11 12 13 14 15 16 17 18 19 20 21 22 |
function setupMonitoringDatabase() { // Create a database for storing performance metrics session.runSql('CREATE DATABASE IF NOT EXISTS performance_monitoring'); session.runSql('USE performance_monitoring'); // Create a table for MySQL performance metrics session.runSql(` CREATE TABLE IF NOT EXISTS mysql_metrics ( id INT AUTO_INCREMENT PRIMARY KEY, timestamp TIMESTAMP DEFAULT CURRENT_TIMESTAMP, buffer_pool_usage DECIMAL(5,2), buffer_pool_size BIGINT, threads_connected INT, threads_running INT, queries_per_second DECIMAL(10,2), slow_queries INT, table_open_cache_hits BIGINT, table_open_cache_misses BIGINT, innodb_row_lock_waits BIGINT, innodb_row_lock_time_avg DECIMAL(10,2) ) `); |
The first part of the function creates a database named ‘performance_monitoring’ along with a table called `mysql_metrics`, which is structured to store a wide range of MySQL performance indicators. These include the `buffer_pool_usage`, representing the percentage of the InnoDB buffer pool currently in use, and `buffer_pool_size`, which tracks the total size of the buffer pool in bytes. It also logs the number of active client connections (`threads_connected`) and those currently executing queries (`threads_running`).
To monitor query activity, it records the `queries_per_second` and the number of `slow_queries` that exceed the defined threshold. Additionally, it captures cache efficiency using `table_open_cache_hits` and `table_open_cache_misses`, as well as locking behavior through `innodb_row_lock_waits` and the `innodb_row_lock_time_avg`, which represents the average time spent waiting for row locks. It ensures that the table is well-prepared to store all the metrics needed for performance analysis.
|
1 2 3 4 5 6 7 8 9 10 11 12 13 14 15 |
// Create a table for tracking configuration changes session.runSql(` CREATE TABLE IF NOT EXISTS config_changes ( id INT AUTO_INCREMENT PRIMARY KEY, timestamp TIMESTAMP DEFAULT CURRENT_TIMESTAMP, parameter_name VARCHAR(100), old_value VARCHAR(100), new_value VARCHAR(100), change_reason VARCHAR(255) ) `); print("Monitoring database and tables created successfully."); return true; } |
The second part creates a table called `config_changes` to track changes made to MySQL’s configuration. This is important for understanding how configuration changes impact performance over time. The function returns `true` to indicate successful completion, which allows other functions to check if the setup was successful. When you run this function, you’ll see that the database and tables have been created.
Now, let’s create a function to collect and store MySQL performance metrics:
|
1 2 3 4 5 6 7 8 9 10 11 12 13 14 15 16 17 |
function collectMySQLMetrics() { print("Collecting MySQL performance metrics..."); // Get buffer pool usage var bufferPoolResult = session.runSql(` SELECT (pages_data * page_size) / (pages_total * page_size) * 100 AS buffer_pool_usage, (pages_total * page_size) AS buffer_pool_size FROM (SELECT variable_value AS pages_total FROM performance_schema.global_status WHERE variable_name = 'Innodb_buffer_pool_pages_total') AS total, (SELECT variable_value AS pages_data FROM performance_schema.global_status WHERE variable_name = 'Innodb_buffer_pool_pages_data') AS data, (SELECT variable_value AS page_size FROM performance_schema.global_status WHERE variable_name = 'Innodb_page_size') AS page `); var bufferPoolRow = bufferPoolResult.fetchOne(); var bufferPoolUsage = parseFloat(bufferPoolRow[0]).toFixed(2); var bufferPoolSize = parseInt(bufferPoolRow[1]); |
This part of the function queries the ‘performance_schema’ to calculate the buffer pool usage percentage and determine the total buffer pool size in bytes. The buffer pool is MySQL’s main memory cache for data and indexes, so monitoring its usage is necessary for performance tuning. A consistently high usage (>90%) might indicate you need more memory.
Next, the code below retrieves information about MySQL threads, capturing both connected threads (total client connections) and running threads (actively executing queries):
|
1 2 3 4 5 6 7 8 9 10 |
// Get thread information var threadsResult = session.runSql(` SELECT (SELECT variable_value FROM performance_schema.global_status WHERE variable_name = 'Threads_connected') AS threads_connected, (SELECT variable_value FROM performance_schema.global_status WHERE variable_name = 'Threads_running') AS threads_running `); var threadsRow = threadsResult.fetchOne(); var threadsConnected = parseInt(threadsRow[0]); var threadsRunning = parseInt(threadsRow[1]); |
The ratio between running and connected threads can tell you a lot about your server’s health. If many threads are running compared to connected, it might indicate query performance issues.
|
1 2 3 4 5 6 7 8 9 10 11 12 13 14 |
// Get query information var queryResult = session.runSql(` SELECT (SELECT variable_value FROM performance_schema.global_status WHERE variable_name = 'Queries') AS total_queries, (SELECT variable_value FROM performance_schema.global_status WHERE variable_name = 'Slow_queries') AS slow_queries, (SELECT variable_value FROM performance_schema.global_status WHERE variable_name = 'Table_open_cache_hits') AS cache_hits, (SELECT variable_value FROM performance_schema.global_status WHERE variable_name = 'Table_open_cache_misses') AS cache_misses `); var queryRow = queryResult.fetchOne(); var totalQueries = parseInt(queryRow[0]); var slowQueries = parseInt(queryRow[1]); var cacheHits = parseInt(queryRow[2]); var cacheMisses = parseInt(queryRow[3]); |
The function then collects query statistics, including total queries and slow queries, as well as table cache performance metrics (hits and misses). These metrics help identify potential problems/issues in your database. For example, a high number of slow queries suggests optimization opportunities, while a low cache hit ratio indicates the table cache might be too small.
|
1 2 3 4 5 6 7 8 9 10 11 12 13 14 15 16 17 18 19 20 21 22 23 24 25 26 27 28 29 30 31 32 33 |
// Get lock information var lockResult = session.runSql(` SELECT (SELECT variable_value FROM performance_schema.global_status WHERE variable_name = 'Innodb_row_lock_waits') AS lock_waits, (SELECT variable_value FROM performance_schema.global_status WHERE variable_name = 'Innodb_row_lock_time_avg') AS lock_time_avg `); var lockRow = lockResult.fetchOne(); var lockWaits = parseInt(lockRow[0]); var lockTimeAvg = parseFloat(lockRow[1]).toFixed(2); // Calculate queries per second (this requires two measurements) // For simplicity, we'll use a static value for demonstration var queriesPerSecond = 0; // If we have previous measurements, we can calculate QPS var previousQueriesResult = session.runSql(` SELECT total_queries, UNIX_TIMESTAMP(timestamp) as measure_time FROM performance_monitoring.mysql_metrics ORDER BY id DESC LIMIT 1 `); var previousQueriesRow = previousQueriesResult.fetchOne(); if (previousQueriesRow) { var previousTotalQueries = parseInt(previousQueriesRow[0]); var previousTimestamp = parseInt(previousQueriesRow[1]); var currentTimestamp = Math.floor(Date.now() / 1000); var timeDiff = currentTimestamp - previousTimestamp; if (timeDiff > 0) { queriesPerSecond = ((totalQueries - previousTotalQueries) / timeDiff).toFixed(2); } } |
The function retrieves InnoDB row lock information to detect contention issues and calculates the queries per second by comparing the current total queries with the previous measurement. This calculation requires at least two measurements, so it will only work after the first metric collection. High lock waits or long lock times can indicate contention problems that might be resolved by optimizing queries or schema design.
|
1 2 3 4 5 6 7 8 9 10 11 12 |
// Store metrics in our monitoring table session.runSql(` INSERT INTO performance_monitoring.mysql_metrics ( buffer_pool_usage, buffer_pool_size, threads_connected, threads_running, queries_per_second, slow_queries, table_open_cache_hits, table_open_cache_misses, innodb_row_lock_waits, innodb_row_lock_time_avg ) VALUES (?, ?, ?, ?, ?, ?, ?, ?, ?, ?) `, [ bufferPoolUsage, bufferPoolSize, threadsConnected, threadsRunning, queriesPerSecond, slowQueries, cacheHits, cacheMisses, lockWaits, lockTimeAvg ]); |
This is the part that stores all collected metrics in the `mysql_metrics` table for tracking. By storing these metrics in a database, we can analyze trends over time and make decisions about configuration changes. This data is invaluable for understanding how your database’s performance evolves and how configuration changes impact it.
|
1 2 3 4 5 6 7 8 9 10 11 12 13 14 15 16 |
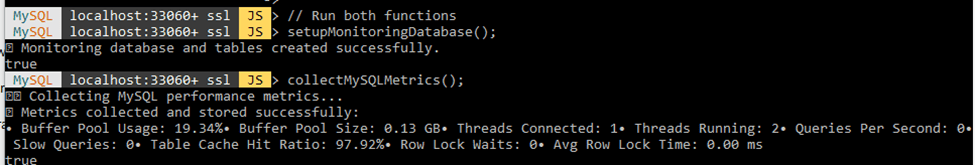
print("Metrics collected and stored successfully:\n"); print("• Buffer Pool Usage: " + bufferPoolUsage + "%"); print("• Buffer Pool Size: " + (bufferPoolSize / (1024 * 1024 * 1024)).toFixed(2) + " GB"); print("• Threads Connected: " + threadsConnected); print("• Threads Running: " + threadsRunning); print("• Queries Per Second: " + queriesPerSecond); print("• Slow Queries: " + slowQueries); print("• Table Cache Hit Ratio: " + ((cacheHits / (cacheHits + cacheMisses)) * 100).toFixed(2) + "%"); print("• Row Lock Waits: " + lockWaits); print("• Avg Row Lock Time: " + lockTimeAvg + " ms\n"); return true; } setupMonitoringDatabase(); collectMySQLMetrics(); |
Finally, the function prints a readable summary of the metrics and returns them as a structured object:
Integrating with External Monitoring Tools
While MySQL Shell provides scripting capabilities, you might want to integrate with external monitoring tools like Prometheus for more comprehensive monitoring and alerting. Let’s create a script that exposes MySQL metrics in a format that Prometheus can scrape:
|
1 2 3 4 5 6 7 8 9 10 11 12 13 14 15 16 17 18 19 20 21 22 23 24 25 26 27 |
function setupPrometheusEndpoint() { var http = require('http'); function getMetrics() { var metrics = ""; // Collect various MySQL metrics var metricQueries = [ { name: "mysql_buffer_pool_usage", query: ` SELECT (pages_data * page_size) / (pages_total * page_size) * 100 AS buffer_pool_usage FROM (SELECT variable_value AS pages_total FROM performance_schema.global_status WHERE variable_name = 'Innodb_buffer_pool_pages_total') AS total, (SELECT variable_value AS pages_data FROM performance_schema.global_status WHERE variable_name = 'Innodb_buffer_pool_pages_data') AS data, (SELECT variable_value AS page_size FROM performance_schema.global_status WHERE variable_name = 'Innodb_page_size') AS page `, help: "InnoDB buffer pool usage percentage" }, { name: "mysql_threads_connected", query: "SELECT variable_value FROM performance_schema.global_status WHERE variable_name = 'Threads_connected'", help: "Number of currently connected client threads" }, // Additional metrics definitions... ]; |
The function begins by importing the Node.js HTTP module to create a web server and defining a function to collect metrics. It creates an array of metric definitions, each with a name (following Prometheus naming conventions), an SQL query to retrieve the metric, and a help text that describes what the metric means. This structured approach makes it easy to add or modify metrics later.
|
1 2 3 4 5 6 7 8 9 10 11 12 13 14 |
// Execute each query and format the results for Prometheus for (var i = 0; i < metricQueries.length; i++) { var metric = metricQueries[i]; metrics += "# HELP " + metric.name + " " + metric.help + "\n"; metrics += "# TYPE " + metric.name + " gauge\n"; var result = session.runSql(metric.query); var value = result.fetchOne()[0]; metrics += metric.name + " " + value + "\n\n"; } return metrics; } |
The function then loops through each metric definition, formats the metric according to Prometheus exposition format, executes the SQL query to get the current value, and adds help text and type information (all metrics are gauges in this case).
The Prometheus exposition format is a simple text-based format that includes help text, type information, and the metric value. This makes it easy for Prometheus to scrape and understand the metrics.
|
1 2 3 4 5 6 7 8 9 10 |
// Create an HTTP server to expose metrics http.createServer(function (req, res) { if (req.url === '/metrics') { res.writeHead(200, { 'Content-Type': 'text/plain' }); res.end(getMetrics()); } else { res.writeHead(404, { 'Content-Type': 'text/plain' }); res.end('404 Not Found'); } }).listen(8080); |
Next, the function creates an HTTP server that listens on port 8080, handles requests to the /metrics endpoint by returning the formatted metrics, and returns a 404 error for any other URL. This simple web server makes the metrics available for Prometheus to scrape at regular intervals.
|
1 2 3 4 5 6 7 8 9 10 11 12 13 14 15 |
print("Prometheus metrics endpoint running at http://localhost:8080/metrics"); print("You can configure Prometheus to scrape this endpoint for MySQL metrics."); print("Example Prometheus configuration:"); print("```"); print("scrape_configs:"); print(" - job_name: 'mysql'"); print(" static_configs:"); print(" - targets: ['localhost:8080']"); print("```"); // Keep the script running while(true) { util.sleep(1000); } } |
Finally, the function prints information about the running endpoint, provides an example Prometheus configuration, and enters an infinite loop to keep the server running. This makes it easy for users to understand how to configure Prometheus to scrape the metrics endpoint.
The advantage of using Prometheus and Grafana is that they provide long-term storage (Prometheus can store metrics for months or years, allowing you to analyze long-term trends), querying (PromQL allows you to perform complex queries on your metrics), visualization (Grafana provides beautiful dashboards that make it easy to understand your metrics), and alerting (you can set up alerts that notify you when metrics exceed thresholds).
By integrating MySQL Shell with Prometheus, you get the best of both: the scripting capabilities of MySQL Shell and the monitoring capabilities of Prometheus.
Implementing Self-Tuning Scripts
Now that we’re collecting metrics, we can create self-tuning scripts that make data-driven decisions. Let’s start with a script that adjusts the InnoDB buffer pool size based on actual usage patterns:
|
1 2 3 4 5 6 7 8 9 10 11 12 13 14 15 16 17 18 19 20 |
function adjustBufferPoolSize() { print("Analyzing buffer pool usage to determine optimal size..."); try { // Step 1: Get average and max buffer pool usage for the last 1 hour let result = session.runSql(` SELECT buffer_pool_size, AVG(buffer_pool_usage) AS avg_usage, MAX(buffer_pool_usage) AS max_usage FROM performance_monitoring.mysql_metrics WHERE timestamp > DATE_SUB(NOW(), INTERVAL 1 HOUR) GROUP BY buffer_pool_size ORDER BY avg_usage DESC LIMIT 1; `).fetchAll(); |
This function begins by querying the monitoring database for the current buffer pool size and its usage statistics (average and maximum) over the past hour. To prioritize the buffer pool configuration with the most significant memory pressure, the query orders the grouped results by average usage (`avg_usage`) in descending order. It then limits the result to just one row using LIMIT 1, effectively selecting the most heavily utilized buffer pool size in the recent timeframe. The query result is retrieved using `.fetchAll()`, which returns an array of matching rows, even though in this case, only one row is expected due to the LIMIT 1 clause.
|
1 2 3 4 5 6 7 8 9 10 11 12 13 14 |
if (result.length === 0) { print("No buffer pool usage data found in the past 1 hour(s). Aborting."); return; } let currentSize = result[0][0]; // buffer_pool_size let avgUsage = result[0][1]; // avg_usage let maxUsage = result[0][2]; // max_usage print(`Current Buffer Pool Size: ${currentSize} bytes`); print(`Average Usage: ${avgUsage.toFixed(2)}%`); print(`Max Usage: ${maxUsage.toFixed(2)}%`); let newSize = currentSize; |
The script above first checks whether the query returned any data. If there are no records in the monitoring table for the past hour, it aborts the operation since there isn’t enough historical evidence to make a reliable decision. If data is available, it then extracts the relevant values from the first (and only) row of the result: `currentSize`, which represents the current value of the buffer pool in bytes; `avgUsage`, the average buffer pool usage over the last hour in percentage; and `maxUsage`, the peak usage within the same period.
These values are displayed to the user in a clear format, with percentages shown to two decimal places using `toFixed(2)`. The variable newSize is then initialized to the current size, and may be modified later depending on whether the conditions below determine that an adjustment is needed.
|
1 2 3 4 5 6 7 8 9 10 |
if (avgUsage > 85 || maxUsage > 95) { newSize = Math.round(currentSize * 1.2); print(`High usage detected. Increasing buffer pool size to ${newSize} bytes.`); } else if (avgUsage < 40 && maxUsage < 60) { newSize = Math.round(currentSize * 0.8); print(`Low usage detected. Decreasing buffer pool size to ${newSize} bytes.`); } else { print("No change needed. Buffer pool size is within optimal range."); return; } |
If the average buffer pool usage exceeds 85% or the peak usage goes beyond 95%, consider the buffer pool overutilized. In such cases, it increases the buffer pool size by 20% to accommodate higher demand, using `Math.round` to ensure the new size remains an integer. Conversely, if the average usage drops below 40% and the peak usage stays under 60%, the buffer pool is deemed underutilized. The script then reduces its size by 20% to free up memory that can be used by other MySQL operations or operating system processes. However, if the usage levels fall within this middle range (neither too high nor too low), the script above does not make any changes. It exits gracefully, avoiding unnecessary reconfiguration and promoting stability.
|
1 2 3 4 5 6 7 8 |
session.runSql(`SET PERSIST innodb_buffer_pool_size = ${newSize}`); print("Buffer pool size updated."); } catch (err) { print("Error adjusting buffer pool size: " + err.message); } } adjustBufferPoolSize(); |
If a change to the buffer pool size is needed, the script uses the SET PERSIST command to update the `innodb_buffer_pool_size` value. It ensures that the new size is not only applied immediately but also saved in MySQL’s configuration so that it persists across server restarts. The entire operation is wrapped in a try-catch block, which means that if any error occurs, whether during the SQL queries or while applying the new setting, the error message will be caught and printed clearly. This approach makes it easier to identify and fix problems without the script failing silently or stopping unexpectedly. Finally, the `adjustBufferPoolSize()` function is called at the end of the script, triggering the entire logic to run as soon as the script is executed.
The buffer pool is not the only place where MySQL uses memory. MySQL uses memory for several other purposes: connection buffers (each connection requires memory for buffers like join_buffer_size, sort_buffer_size, read_buffer_size, etc.), query cache (if enabled, MySQL stores query results in memory), table cache (MySQL caches table definitions in memory), key buffer (used for MylSAM tables to cache index blocks), and thread cache (MySQL caches threads for reuse). However, the InnoDB buffer pool is typically the largest consumer of memory in a MySQL server, often accounting for 70-80% of the total memory usage. That’s why we’re focusing on it in our automation script.
Analyzing Performance Trends and Configuration Changes
One of the most valuable aspects of automated performance tuning is the ability to analyze trends over time. Let’s look at a function that analyzes our collected metrics and configuration changes:
|
1 2 3 4 5 6 7 8 9 10 11 12 13 14 15 16 17 18 19 20 21 22 23 24 25 26 27 28 29 30 31 32 33 34 35 36 37 38 |
function analyzePerformanceTrends(days = 7) { print("Analyzing performance trends over the past " + days + " days..."); // Analyze buffer pool usage trends var bufferPoolResult = session.runSql(` SELECT DATE(timestamp) AS date, AVG(buffer_pool_usage) AS avg_usage, MAX(buffer_pool_usage) AS max_usage, MIN(buffer_pool_usage) AS min_usage FROM performance_monitoring.mysql_metrics WHERE timestamp > DATE_SUB(NOW(), INTERVAL ? DAY) GROUP BY DATE(timestamp) ORDER BY date `, [days]); print("\nBuffer Pool Usage Trends:"); print("Date | Avg Usage | Min Usage | Max Usage"); print("------------|-----------|-----------|----------"); var hasData = false; while (var row = bufferPoolResult.fetchOne()) { hasData = true; print( row[0] + " | " + parseFloat(row[1]).toFixed(2) + "% | " + parseFloat(row[2]).toFixed(2) + "% | " + parseFloat(row[3]).toFixed(2) + "%" ); } if (!hasData) { print("No buffer pool usage data available for the specified period."); } |
This function begins by querying the monitoring database for daily buffer pool usage statistics over the specified number of days. It calculates average, maximum, and minimum usage for each day and displays the results in a formatted table. This daily view helps identify patterns in buffer pool usage, such as whether it consistently peaks at certain times or gradually increases over time.
|
1 2 3 4 5 6 7 8 9 10 11 12 13 14 15 16 17 18 19 20 21 22 23 24 25 26 27 28 29 30 31 32 33 34 |
// Analyze configuration changes var configResult = session.runSql(` SELECT DATE(timestamp) AS date, parameter_name, COUNT(*) AS change_count FROM performance_monitoring.config_changes WHERE timestamp > DATE_SUB(NOW(), INTERVAL ? DAY) AND old_value != new_value GROUP BY DATE(timestamp), parameter_name ORDER BY date, parameter_name `, [days]); print("\nConfiguration Change Summary:"); print("Date | Parameter | Changes"); print("------------|-------------------------|--------"); hasData = false; while (var row = configResult.fetchOne()) { hasData = true; print( row[0] + " | " + row[1].padEnd(25) + " | " + row[2] ); } if (!hasData) { print("No configuration changes recorded for the specified period."); } |
Next, the function queries the configuration changes table to summarize changes over the specified period. It groups changes by date and parameter name and counts how many times each parameter was changed on each day. This summary helps you understand how often your automation scripts are making changes and which parameters are being adjusted most frequently.
|
1 2 3 4 5 6 7 8 9 10 11 12 13 14 15 16 17 18 19 20 21 22 23 24 25 26 27 28 29 30 31 32 33 |
// Analyze slow query trends var slowQueryResult = session.runSql(` SELECT DATE(timestamp) AS date, SUM(slow_queries) AS total_slow_queries, AVG(threads_connected) AS avg_connections FROM performance_monitoring.mysql_metrics WHERE timestamp > DATE_SUB(NOW(), INTERVAL ? DAY) GROUP BY DATE(timestamp) ORDER BY date `, [days]); print("\nSlow Query and Connection Trends:"); print("Date | Slow Queries | Avg Connections"); print("------------|--------------|----------------"); hasData = false; while (var row = slowQueryResult.fetchOne()) { hasData = true; print( row[0] + " | " + row[1].toString().padEnd(12) + " | " + parseFloat(row[2]).toFixed(1) ); } if (!hasData) { print("No slow query data available for the specified period."); } |
The function then queries the monitoring database for daily slow queries and connection statistics, calculates the total number of slow queries and average connections for each day, displays the results in a formatted table, and stores the data for potential further processing. This analysis helps identify potential correlations between connection load and query performance issues.
|
1 2 3 4 5 6 7 8 9 10 11 12 13 14 15 16 17 18 19 20 21 22 23 24 25 26 27 28 29 30 31 32 33 34 35 36 37 38 39 40 41 42 43 44 45 46 47 48 49 50 51 52 53 54 55 56 57 58 59 60 61 |
// Show recent configuration changes with details var recentChangesResult = session.runSql(` SELECT timestamp, parameter_name, old_value, new_value, change_reason FROM performance_monitoring.config_changes WHERE timestamp > DATE_SUB(NOW(), INTERVAL ? DAY) AND old_value != new_value ORDER BY timestamp DESC LIMIT 10 `, [days]); print("\nRecent Configuration Changes (Last 10):"); print("Timestamp | Parameter | Old Value | New Value | Reason"); print("---------------------|-------------------------|---------------|---------------|------------------"); hasData = false; while (var row = recentChangesResult.fetchOne()) { hasData = true; print( row[0] + " | " + row[1].padEnd(25) + " | " + row[2].toString().padEnd(13) + " | " + row[3].toString().padEnd(13) + " | " + row[4] ); } if (!hasData) { print("No recent configuration changes recorded for the specified period."); } // Dashboard Query Output print("\nSQL Queries for Dashboard Creation:"); print("----------------------------------"); print("1. Buffer Pool Usage Over Time:"); print("```sql"); print(` SELECT DATE_FORMAT(timestamp, '%Y-%m-%d %H:00:00') AS hour, AVG(buffer_pool_usage) AS avg_usage FROM performance_monitoring.mysql_metrics WHERE timestamp > DATE_SUB(NOW(), INTERVAL 7 DAY) GROUP BY DATE_FORMAT(timestamp, '%Y-%m-%d %H:00:00') ORDER BY hour; `); print("```"); return true; } analyzePerformanceTrends(); |
Finally, the function shows detailed information about the most recent configuration changes and provides ready-to-use SQL queries for creating dashboards in tools like Grafana. These SQL queries are particularly valuable because they can be directly used in external dashboard tools to visualize your MySQL server’s performance trends.
This analysis helps you understand how your database’s performance is changing over time and how your automation scripts are responding to those changes. It also provides the foundation for creating dashboards that can help you visualize these trends.
Important to Note
What you need to do to is to treat it as a solid foundation for automating MySQL performance tuning. However, you need to fill in the parts that are currently just placeholders. These placeholders are there to show where you should add your code. The reason for this is because: every MySQL setup is unique. What you want to monitor, how you want to tune your database, the backups you want to take, and where you want to store those backups will all depend on your specific server environment and your personal preferences.
Regarding the backup folder paths and files, when the script mentions something like /path/to/your/backup, this is just a placeholder for the actual folder location on your laptop where you want to save or load backups. You need to change this to a folder path that exists on your system. For example, on Windows, it might look like C:\\Users\\YourName\\MySQLBackups\\, while on macOS or Linux, it might be something like /home/username/mysql_backups/. If you don’t update this path, the script won’t find the files it needs, and backups won’t save correctly.
To prepare your computer or server for this automation, make sure that the folders you want to use for backups or loading configuration files already exist. The script does not create folders automatically, so this step is essential. Also, if your script needs to read files like configuration files or backup files, those files must be in the exact locations you specify in the script. Make sure to update the script to point precisely to those folder paths.
Further Reading
If you’re interested in learning more about MySQL memory management, performance tuning, and best practices for optimizing the InnoDB buffer pool, the following resources are great places to dive deeper:
Conclusion
We’ve covered a lot of ground in this article, building the essential monitoring and analysis infrastructure that makes intelligent MySQL automation possible. The functions we’ve created, from `setupMonitoringDatabase()` to `analyzePerformanceTrends()`, work together to provide comprehensive visibility into your MySQL server’s performance.
What makes this approach powerful is that we’re not just collecting metrics, we’re storing them in a structured way that allows for analysis and trend identification. The integration with Prometheus opens up even more possibilities for alerting and visualization through tools like Grafana. The self-tuning scripts we’ve implemented represent a significant step forward from manual optimization.
In Part 5b, we’ll take this foundation and build upon it to create a complete automation ecosystem. We’ll look at backup strategies that include configuration tracking, recovery procedures, and a comprehensive automation script that ties everything together into a self-managing system. You’re not just saving time, you’re creating a more reliable, responsive, and efficient database environment that can adapt to changing conditions automatically.
This document contains proprietary information and is protected by copyright law.
Copyright © 2026 Red Gate Software Limited. All rights reserved


Load comments