

This is part of a series of posts from Chisom Kanu about using MySQL Shell in the management of MySQL. You can see the entire series here.
In the first part of the series article, we introduced MySQL Shell as a tool for managing and optimizing MySQL configurations. We discussed how to install the Shell, connect to the MySQL server, and modify basic configuration parameters. Now, we’re into performance optimization, focusing specifically on memory and CPU configurations. These two components are important because they directly impact how efficiently your database processes queries, handles connections, and stores data in memory. In this article, we will look at techniques using MySQL Shell to help you optimize both memory and CPU usage to ensure smooth and fast database performance.
Databases can consume a lot of system resources, especially when handling large data sets and multiple concurrent queries. By optimizing memory usage and CPU allocation, you can ensure that your MySQL server works faster and more efficiently. The memory settings dictate how MySQL handles caching and temporary storage, while the CPU settings control how MySQL divides work across multiple processor cores. We’ll be adjusting these parameters using MySQL Shell.
Open your terminal and connect to your local MySQL server by running:
|
1 |
mysqlsh --uri root@localhost |
This will launch MySQL Shell in the default Python mode. If you prefer JavaScript mode, which we’ll use throughout this guide, switch by typing \js. Now, you’re ready to start optimizing. (Note, you may not be able to execute some commands in this article without using the root account. Do not do this in production unless you are authorized and know what you are doing.)
InnoDB Buffer Pool Configuration Using MySQL Shell
The InnoDB buffer pool is MySQL’s memory space where it caches data for quick access. This pool is particularly useful because it minimizes the need for disk reads, which are much slower than memory operations. By configuring this properly, you can improve your database’s performance.
First, let’s see the current buffer pool settings. Run this script in MySQL Shell:
|
1 2 3 4 5 |
var result = session.runSql('SHOW VARIABLES LIKE "innodb_buffer_pool_%"'); var row; while (row = result.fetchOne()) { print(row[0] + ": " + row[1]); } |
This command retrieves the current InnoDB buffer pool settings. The output might look something like this, depending on the OS and shell you are using:
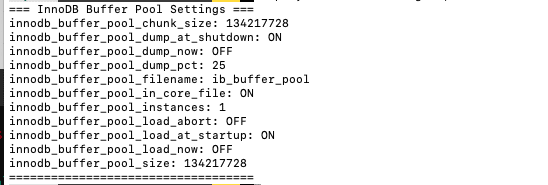
Here, we see that the buffer pool size is set to 128 MB (134217728 bytes) with one instance. While this may be okay for a small or test database, it’s far from ideal for a production server dealing with large volumes of data.
Let’s say we want to increase the buffer pool size to 1 GB (1,073,741,824 bytes)and split it into four (4) instances to improve concurrency. Here’s how to adjust these settings:
|
1 2 3 4 5 |
session.runSql('SET GLOBAL innodb_buffer_pool_size = 1073741824'); session.runSql('SET GLOBAL innodb_buffer_pool_instances = 4'); print("Buffer pool settings updated. Restart MySQL for changes to take effect."); |
These commands change the buffer pool size to 1GB and set the number of buffer pool instances to 4. The number of instances is important for large databases, as it helps in spreading out the memory across multiple CPU threads, improving the efficiency of memory operations. You’ll need to restart your MySQL server for these changes to take effect.
After adjusting the settings, it’s important to monitor how effectively the buffer pool is being used. A high “hit rate” indicates that MySQL is retrieving most data directly from the buffer pool (i.e., memory) rather than the slower disk.
You can check this by running a small script to monitor buffer pool performance:
|
1 2 3 4 5 6 7 8 9 |
function checkBufferPoolEfficiency() { var result = session.runSql('SHOW ENGINE INNODB STATUS'); var status = result.fetchOne()[2]; var lines = status.split('\n'); var bufferPoolInfo = lines.filter(line => line.includes('Buffer pool hit rate')); print(bufferPoolInfo[0]); } checkBufferPoolEfficiency(); |
The checkBufferPoolEfficiency() function is temporary because it only exists during your current MySQL Shell session. It runs in the JavaScript environment of the Shell and isn’t stored in the MySQL database. When you close MySQL Shell or start a new session, the function disappears unless you define it again. This happens because the function is stored in the Shell’s runtime memory, not on disk or in permanent storage. You can reuse it multiple times while the session is active, but it’s gone once the session ends. Since this is a client-side function, not a server-side stored procedure, it’s a convenient tool for database tasks but doesn’t become part of your MySQL server configuration.
The hit rate tells you how often MySQL retrieves data from memory instead of disk. A hit rate close to 1000/1000 means the buffer pool is doing its job well, which means fewer disk reads and faster database queries. The numerator represents the number of logical read requests that were satisfied from the buffer pool. These are the “hits”—data that was found in memory and didn’t require a disk read. The denominator (1000 in this case) represents the total number of logical read requests. So, if you see a hit rate of 990/1000, it means that out of every 1000 read requests, 990 were satisfied from the buffer pool, and only 10 required reading from disk. This ratio is important in showing you the percentage of times MySQL was able to retrieve data from memory instead of going to disk. A higher ratio (closer to 1000/1000) indicates better performance because memory access is much faster than disk access. If the ratio is lower, it suggests that MySQL is frequently having to read data from disk, which can slow down query performance. It’s important to note that the denominator isn’t specifically counting disk reads, but rather the total read requests. The disk reads are implied by the difference between the total requests and the buffer pool hits.
Table Cache Configuration Using MySQL Shell
The table cache keeps information about open tables in memory, making it faster to access tables repeatedly without having to reopen them each time a query runs. This can be extremely useful for databases with many concurrent users and frequently accessed tables.
First, check the current size of the table cache:
|
1 |
var result = session.runSql('SHOW VARIABLES LIKE "table_open_cache"');<br><br>print("Current table_open_cache: " + \<br> session.runSql('SHOW VARIABLES LIKE "table_open_cache"')result.fetchOne()[1]); |
The output will show something like this, depending on your configuration:

In this case, the cache is set to 4000, meaning that up to 4000 tables can be kept open in memory at any given time. If your server is constantly accessing tables beyond this limit, you’ll need to adjust it.
To optimize the cache based on how many tables are open, you can use the following script:
|
1 2 3 4 5 6 7 8 9 10 11 12 13 14 15 16 17 18 19 20 21 22 23 24 25 26 |
function optimizeTableCache(minCache = 100, maxCache = 2000) { // Get current open tables var result = session.runSql('SHOW GLOBAL STATUS LIKE "Open_tables"'); var openTables = parseInt(result.fetchOne()[1]); // Get total number of tables result = session.runSql('SELECT COUNT(*) FROM information_schema.tables WHERE table_schema NOT IN ("mysql", "information_schema", "performance_schema")'); var totalTables = parseInt(result.fetchOne()[0]); // Get current table_open_cache value result = session.runSql('SHOW VARIABLES LIKE "table_open_cache"'); var currentCache = parseInt(result.fetchOne()[1]); // Calculate new cache size var newCacheSize = Math.max(minCache, Math.ceil(Math.max(openTables, totalTables * 0.1) * 1.1)); newCacheSize = Math.min(newCacheSize, maxCache); if (newCacheSize > currentCache) { session.runSql('SET GLOBAL table_open_cache = ?', [newCacheSize]); print("Table open cache adjusted from " + currentCache + " to: " + newCacheSize); } else { print("Current table_open_cache (" + currentCache + ") is adequate. No changes made."); } } // Usage optimizeTableCache(200, 5000); |
This script introduces minCache and maxCache parameters to define lower and upper bounds for the table cache size. It evaluates both the number of currently open tables and the total number of tables in the database, excluding system databases, to calculate an optimal cache size.
The script also checks the current table_open_cache setting and only increases it if the calculated value is higher. By default, the script sets the minimum cache size to 10% of the total table count or the number of open tables, whichever is larger, and then adds a 10% buffer to that value. The cache size is adjusted only if the calculated value is within the specified bounds. For example, with a minCache of 200 and a maxCache of 5000, it ensures a practical and efficient configuration. However, optimal settings may vary based on workload and server resources, so fine-tuning these parameters based on performance metrics is recommended.
Thread Cache and Sorting Buffers Configuration with MySQL Shell
The thread cache allows MySQL to reuse threads for new connections instead of creating new ones, which can reduce overhead. Sorting buffers, on the other hand, are used when MySQL has to sort data before returning results.
Let’s check how many threads are currently connected to your database:
|
1 2 3 |
var result = session.runSql('SHOW GLOBAL STATUS LIKE "Threads_connected"'); print("Threads connected: " + result.fetchOne()[1]); |
If the output shows, for example:

This means one thread is currently connected. We can set the thread cache size to handle a bit more than the current number of connections. Here’s a script that adjusts both the thread cache size and the sort buffer size:
|
1 2 3 4 5 6 7 8 9 10 11 12 13 14 15 16 17 18 19 20 21 22 23 24 25 26 27 28 29 30 31 32 33 |
function optimizeThreadAndSortBuffers(minThreadCache = 10, maxThreadCache = 100, minSortBuffer = 262144, maxSortBuffer = 1048576) { // Get current thread connections var result = session.runSql('SHOW GLOBAL STATUS LIKE "Threads_connected"'); var connectedThreads = parseInt(result.fetchOne()[1]); // Get current settings var currentThreadCache = parseInt(session.runSql('SHOW VARIABLES LIKE "thread_cache_size"').fetchOne()[1]); var currentSortBuffer = parseInt(session.runSql('SHOW VARIABLES LIKE "sort_buffer_size"').fetchOne()[1]); // Calculate new thread cache size var newThreadCacheSize = Math.max(minThreadCache, Math.ceil(connectedThreads * 1.1)); newThreadCacheSize = Math.min(newThreadCacheSize, maxThreadCache); // Calculate new sort buffer size based on thread cache size var newSortBufferSize = Math.min(maxSortBuffer, Math.max(minSortBuffer, newThreadCacheSize * 8192)); // Apply changes only if new values are higher if (newThreadCacheSize > currentThreadCache) { session.runSql('SET GLOBAL thread_cache_size = ?', [newThreadCacheSize]); print("Thread cache size adjusted from " + currentThreadCache + " to: " + newThreadCacheSize); } else { print("Current thread_cache_size (" + currentThreadCache + ") is adequate. No changes made."); } if (newSortBufferSize > currentSortBuffer) { session.runSql('SET GLOBAL sort_buffer_size = ?', [newSortBufferSize]); print("Sort buffer size adjusted from " + currentSortBuffer + " to: " + newSortBufferSize + " bytes"); } else { print("Current sort_buffer_size (" + currentSortBuffer + ") is adequate. No changes made."); } } // Usage optimizeThreadAndSortBuffers(20, 200, 262144, 2097152); |
The script introduces minimum and maximum values for both the thread cache size and the sort buffer size. It checks the current settings before making changes and only increases the values if necessary. It also ties the sort buffer size to the thread cache size, ensuring that as the system prepares for more concurrent connections (by increasing the thread cache), it also allocates sufficient memory for sorting operations. It first calculates the new thread cache size by taking the number of currently connected threads, adding a 10% buffer, and then ensuring the result falls within the specified minimum and maximum limits. It then calculates the sort buffer size based on the thread cache size, using a scaling factor of 8192. This ensures the sort buffer grows proportionally as the thread cache size increases, but stays within its defined limits.
The script also retrieves the current thread_cache_size and sort_buffer_size from the server. If the calculated values are higher than the current settings, the script updates them; otherwise, it leaves them unchanged. This approach prevents unnecessary adjustments and avoids the risk of accidentally lowering the settings. The thread cache size determines how many threads MySQL keeps ready for new connections, while the sort buffer size sets how much memory each thread can use for sorting operations. By linking these two settings, we ensure that the database can handle more concurrent connections without sacrificing the performance of sorting tasks. For example, as the thread cache size increases, the sort buffer size is adjusted accordingly to provide more memory for sorting, which is especially helpful during peak usage.
In the usage example, I’ve set reasonable defaults:
- A minimum thread cache size of 20 and a maximum of 200.
- A minimum sort buffer size of 256KB (262,144 bytes) and a maximum of 2MB (2,097,152 bytes).
CPU Optimization Using MySQL Shell
MySQL can also make better use of your system’s CPU by tuning certain parameters. For example, innodb_read_io_threads controls the number of threads MySQL uses for read operations, while innodb_parallel_read_threads determines how much parallelism is used when reading data.
Here’s a script that adjusts these settings based on the number of CPU cores available on your system:
|
1 2 3 4 5 6 7 8 9 10 11 12 13 14 |
function optimizeCPUThreads() { var os = require('os'); var cpuCount = os.cpus().length; var readThreads = Math.max(4, cpuCount / 2); // Minimum 4 threads var parallelReadThreads = Math.min(cpuCount, 8); // Max out at 8 threads session.runSql('SET GLOBAL innodb_read_io_threads = ?', [readThreads]); session.runSql('SET GLOBAL innodb_parallel_read_threads = ?', [parallelReadThreads]); print("Read IO threads set to: " + readThreads); print("Parallel read threads set to: " + parallelReadThreads); } optimizeCPUThreads(); |
This function, optimizeCPUThreads(), is all about making the most of your server’s CPU resources for MySQL operations. It’s a smart little piece of code that looks at your system and adjusts MySQL settings accordingly. First, the script checks how many CPU cores your system has. It does this using Node.js’s built-in ‘os’ module. It is important because the number of cores directly impacts how we should configure MySQL for optimal performance. This script sets the number of read I/O threads to half the number of CPU cores, with a minimum of 4, and limits parallel read threads to a maximum of 8, following MySQL’s recommendations.
Now, let’s talk about those two settings we’re adjusting: innodb_read_io_threads and innodb_parallel_read_threads. These are key players in how MySQL handles read operations, which are often the bulk of database work.
For innodb_read_io_threads, we’re setting it to half the number of CPU cores, but with a minimum of 4. Why? Well, MySQL recommends having at least 4 read I/O threads, even on systems with fewer cores. This ensures a baseline level of parallelism for read operations. But why not use all cores? Because we want to leave some CPU capacity for other operations and system tasks. It’s about finding a balance.
As for innodb_parallel_read_threads, we’re limiting it at 8 or the number of CPU cores, whichever is lower. This aligns with MySQL’s recommendation to limit this value to 8-16, even on systems with more cores. The reasoning here is that beyond a certain point, adding more parallel read threads doesn’t yield significant performance gains and can even lead to diminishing returns.
You can find more details about these settings in MySQL’s official documentation.
Now, you might be wondering, “Should I always follow these recommendations?” The answer is: it depends. While these settings are a good starting point for most systems, your specific workload might benefit from different values. For instance, if you have a very read-heavy application with a lot of cores available, you might push these numbers higher. On the flip side, if your system is running other resource-intensive applications alongside MySQL, you might want to be more conservative.
The key is to use these recommendations as a baseline, then monitor your system’s performance and adjust as needed. Tools like MySQL’s Performance Schema can help you track how well these settings are working for your specific use case.
Optimizing MySQL is often an iterative process. Start with these recommended settings, measure your performance, make incremental changes, and measure again. It’s all about finding the sweet spot for your setup and workload.
Monitoring and Tuning Memory and CPU Usage
Monitoring and tuning your MySQL server is an ongoing process. It’s not something you can set up once and forget about. As your database grows, or as more users begin interacting with your system, you’ll need to keep an eye on how efficiently MySQL uses its resources—memory, CPU, and threads.
Using MySQL Shell, we can easily monitor key performance metrics like memory usage in the buffer pool, thread activity, and even identify CPU-intensive queries. This will help you spot any issues and fine-tune your server for better performance.
We’ll write a script that uses MySQL Shell to monitor the efficiency of MySQL’s buffer pool, track active threads, and identify the most CPU-intensive queries. Afterward, we’ll explain what these results mean and how to interpret them.
Let’s get started by creating a monitorPerformance function. This script will help you see how well your server is performing:
|
1 2 3 4 5 6 7 8 9 10 11 12 13 14 15 16 17 18 19 20 21 22 23 24 25 26 27 28 |
function monitorPerformance() { print("=== MySQL Performance Monitor ==="); // Check buffer pool read efficiency var result = session.runSql('SHOW GLOBAL STATUS LIKE "Innodb_buffer_pool_read_requests"'); var readRequests = parseInt(result.fetchOne()[1]); result = session.runSql('SHOW GLOBAL STATUS LIKE "Innodb_buffer_pool_reads"'); var diskReads = parseInt(result.fetchOne()[1]); var hitRatio = ((readRequests - diskReads) / readRequests) * 100; print("Buffer Pool Hit Ratio: " + hitRatio.toFixed(2) + "%"); // Monitor thread activity result = session.runSql('SHOW GLOBAL STATUS LIKE "Threads_connected"'); print("Connected Threads: " + result.fetchOne()[1]); result = session.runSql('SHOW GLOBAL STATUS LIKE "Threads_running"'); print("Running Threads: " + result.fetchOne()[1]); // Show top 5 CPU-intensive queries print("Top 5 CPU-Intensive Queries:"); result = session.runSql('SELECT DIGEST_TEXT, COUNT_STAR, SUM_TIMER_WAIT/1000000000000 AS Exec_Time_Sec ' + 'FROM performance_schema.events_statements_summary_by_digest ' + 'ORDER BY SUM_TIMER_WAIT DESC LIMIT 5'); var row; while (row = result.fetchOne()) { print("Query: " + row[0]); print("Executions: " + row[1]); print("Total Execution Time (sec): " + row[2]); print("---"); } } monitorPerformance(); |
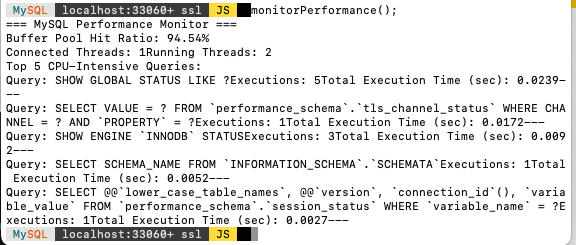
The InnoDB buffer pool is where MySQL stores frequently accessed data in memory, allowing faster data retrieval than from disk. The script checks the Buffer Pool Hit Ratio, which ideally should be 95% or higher in normal OLTP type operations, meaning most data requests are served from memory. If the hit ratio is low, increasing the buffer pool size can improve performance.
Next, the script monitors thread activity, showing how many threads are connected and running. A large number of connected but idle threads suggests inefficiency, which can be addressed by adjusting the thread_cache_size. Lastly, the script identifies the top CPU-intensive queries, highlighting which queries consume the most CPU. By optimizing these queries, like adding indexes, you can reduce their impact on performance.
After running this script, you now have a clearer picture of how your MySQL server is performing. You know:
- How efficiently the buffer pool is being used (based on the hit ratio).
- How many threads are connected and running.
- Which queries are taking up the most CPU time.
With this information, you can start fine-tuning your MySQL settings. For instance, if the buffer pool hit ratio is low, you can increase the buffer pool size to improve performance. If you have a lot of idle connections, you might want to tweak your thread settings. And if a particular query is consuming too much CPU, you can optimize that query by adding indexes or rewriting it for better efficiency.
It’s important to remember that tuning MySQL is not a one-time task. As your database grows, as more users connect to your system, and as your workload changes, you’ll need to continue monitoring these metrics and adjusting your settings. MySQL is highly configurable, and you have the power to tweak it to perform well under any circumstances, but that requires continuous attention.
Running the monitorPerformance script regularly will help you stay on top of these changes. You can even automate it or run it as part of your routine maintenance to keep an eye on performance over time.
Conclusion
In this article, we’ve looked at advanced techniques for optimizing MySQL’s memory and CPU configurations using MySQL Shell. By properly tuning these settings, you can improve the performance and reliability of your database, ensuring it can handle higher loads and more complex queries efficiently.
Stay tuned for the next article, where we’ll focus on disk I/O and storage optimization using MySQL Shell. This will include tips on optimizing your storage engine settings and reducing disk read and write issues for even better performance.
This document contains proprietary information and is protected by copyright law.
Copyright © 2026 Red Gate Software Limited. All rights reserved


Load comments