
Maybe you have felt overwhelmed when you’re analyzing a dataset because of its size. The best way to handle this situation is by summarizing the data to get a quick review.
In T-SQL, you summarize data by using the GROUP BY clause within an aggregate query. This clause creates groupings which are defined by a set of expressions. One row per unique combination of the expressions in the GROUP BY clause is returned, and aggregate functions such as COUNT or SUM may be used on any columns in the query. However, if you want to group the data by multiple combinations of group by expressions, you may take one of two approaches. The first approach is to create one grouped query per combination of expressions and merge the results using the UNION ALL operator. The other approach is to use the GROUPING SETS operator along with the GROUP BY clause and define each grouping set within a single query.
In this article I’ll demonstrate how to achieve the same results using each method.
Prepare the data set
All queries in this article will run in the AdventureWorks2012 database. If you wish to follow along with this article, download it from here.
Case Study: Data Analyst at Adventure Works
Imagine you’re working as a data analyst at the bike manufacturer Adventure Works, and you’re interested in the company’s income over the last few years. This means you need to group the company’s income per year and run the following query:
Query 1. Income by year
|
1 2 3 4 5 6 7 8 9 10 |
USE AdventureWorks2012; GO SELECT YEAR(OrderDate) AS OrderYear, SUM(SubTotal) AS Income FROM Sales.SalesOrderHeader GROUP BY YEAR(OrderDate) ORDER BY OrderYear; GO |
Query 1 returns the following result set:
|
OrderYear |
Income |
|
2005 |
11331809 |
|
2006 |
30674773.2 |
|
2007 |
42011037.2 |
|
2008 |
25828762.1 |
Table 1. Company’s income per year.
According to Table 1, the company have been registering income between 2005 and 2008. Assuming that the currency is in US dollars, in 2005 their income was around eleven million dollars. In 2006 it was around thirty million dollars, and so on. This kind of information would be useful for supporting a business decision such as opening a company extension elsewhere.
However, if you still want more details about the company’s income, you must perform a new grouping by adding a column or expression to the GROUP BY clause. Add the order month to the previous set of group by expressions. By doing this, the query will return the company’s income per year and month. Review the GROUP BY clause in the following query.
Query 2. Company’s income per year and month.
|
1 2 3 4 5 6 7 8 |
SELECT YEAR(OrderDate) AS OrderYear, MONTH(OrderDate) AS OrderMonth, SUM(SubTotal) AS Income FROM Sales.SalesOrderHeader GROUP BY YEAR(OrderDate), MONTH(OrderDate) ORDER BY OrderYear, OrderMonth; GO |
The following table contains the result set of Query 2:
|
OrderYear |
OrderMonth |
Income |
|
2005 |
7 |
962716.742 |
|
2005 |
8 |
2044600 |
|
2005 |
9 |
1639840.11 |
|
2005 |
10 |
1358050.47 |
|
2005 |
11 |
2868129.2 |
|
2005 |
12 |
2458472.43 |
|
2006 |
1 |
1309863.25 |
|
2006 |
2 |
2451605.62 |
|
2006 |
3 |
2099415.62 |
|
2006 |
4 |
1546592.23 |
|
2006 |
5 |
2942672.91 |
|
2006 |
6 |
1678567.42 |
|
2006 |
7 |
2894054.68 |
|
2006 |
8 |
4147192.18 |
|
2006 |
9 |
3235826.19 |
|
2006 |
10 |
2217544.45 |
|
2006 |
11 |
3388911.41 |
|
2006 |
12 |
2762527.22 |
|
2007 |
1 |
1756407.01 |
|
2007 |
2 |
2873936.93 |
|
2007 |
3 |
2049529.87 |
|
2007 |
4 |
2371677.7 |
|
2007 |
5 |
3443525.25 |
|
2007 |
6 |
2542671.93 |
|
2007 |
7 |
3554092.32 |
|
2007 |
8 |
5068341.51 |
|
2007 |
9 |
5059473.22 |
|
2007 |
10 |
3364506.26 |
|
2007 |
11 |
4683867.05 |
|
2007 |
12 |
5243008.13 |
|
2008 |
1 |
3009197.42 |
|
2008 |
2 |
4167855.43 |
|
2008 |
3 |
4221323.43 |
|
2008 |
4 |
3820583.49 |
|
2008 |
5 |
5194121.52 |
|
2008 |
6 |
5364840.18 |
|
2008 |
7 |
50840.63 |
Table 2. Company’s income per year and month.
This result set is more detailed than the former. In July 2005, their income was around nine hundred sixty thousand dollars. In August 2005, it was around two million dollars, and so on. The more expressions or columns added to the GROUP BY clause, the more detailed the results will be.
If you observe the structure of the two queries, you will see they’re grouped by a single set of grouping expressions. The former is grouped by order year, and the latter is grouped by order year and month.
Suppose the business manager at Adventure Works wants to visualize both results within a single result set. To accomplish this, you may merge the previous queries – Query 1 and Query 2 – by using the UNION ALL operator. First, modify Query 1 by adding a dummy column so it will have the same number of columns as Query 2. All queries merged by the UNION operator must have the same number of columns. This dummy column will return NULL in the OrderMonth column, identifying the OrderYear total rows of this query. The UNION ALL query looks like this:
Query 3. Company’s income per year and per year and month.
|
1 2 3 4 5 6 7 8 9 10 11 12 13 14 15 |
SELECT YEAR(OrderDate) AS OrderYear, NULL AS OrderMonth, --Dummy Column SUM(SubTotal) AS Incomes FROM Sales.SalesOrderHeader GROUP BY YEAR(OrderDate) UNION ALL SELECT YEAR(OrderDate) AS OrderYear, MONTH(OrderDate) AS OrderMonth, SUM(SubTotal) AS Incomes FROM Sales.SalesOrderHeader GROUP BY YEAR(OrderDate), MONTH(OrderDate) ORDER BY OrderYear, OrderMonth; GO |
Figure 1 shows the result set produced by Query 3. Review the comments in the figure which identify the grouping sets.
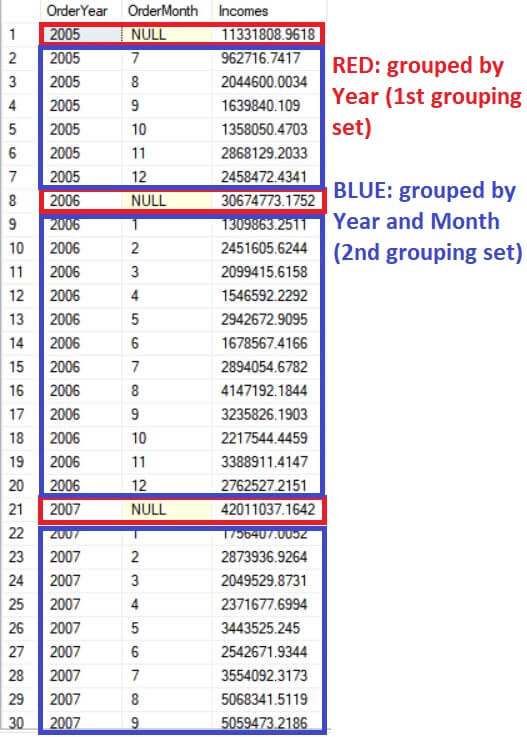
Figure 1. Company’s income per year and per year and month. Notice the comments added to the figure.
This information doesn’t look new, because you already know that in 2005 the company’s income was around eleven million dollars. In July 2005 the company’s income was around nine hundred sixty thousand dollars, and so on. What’s new to you is that each grouping result –year grouping result and year and month grouping result– is merged.
Maybe you’ve figured out how the NULL values appeared in the result set. Remember you used the NULL as a dummy column to identify the results from the order year grouping. Look carefully at Figure 2 which details the placeholders in the first grouped query.
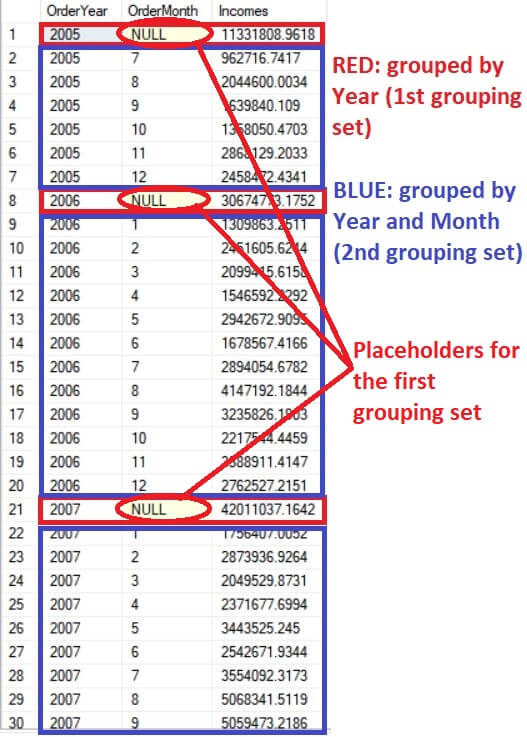
Figure 2. Pointing out the placeholders.
When there’s more than one group by expression list involved in the query, a NULL is used as a placeholder to identify one of the groupings in the results. Looking at Figure 2 again, a row that has NULL in the OrderMonth column means the row belongs to the order year grouping. When the row has a value in both the OrderYear and OrderMonth columns, it means the row belongs to the order year and month grouping. This situation happens when one of the grouped queries doesn’t have the same number of columns grouped. In this example, the first grouping is by order year and the second grouping is by order year and month.
Although you obtained the desired result, Query 3 would be even larger if you added another grouping set, such as order day. As a data analyst, you decided to search the internet to find a way to achieve the same results but with less work. You find that by using the GROUPING SETS operator you should get the same result set, but with less coding! This really motivates you, and you write the following query using GROUPING SETS:
Query 4. Getting the same result set produced by the Query #3 but using the GROUPING SETS clause.
|
1 2 3 4 5 6 7 8 9 10 11 12 |
SELECT YEAR(OrderDate) AS OrderYear, MONTH(OrderDate) AS OrderMonth, SUM(SubTotal) AS Incomes FROM Sales.SalesOrderHeader GROUP BY GROUPING SETS ( YEAR(OrderDate), --1st grouping set (YEAR(OrderDate),MONTH(OrderDate)) --2nd grouping set ); GO |
The result set produced by Query 4 is the same as that displayed in Figure 1. Figure 3 shows the results, but the new technique requires less code. The GROUPING SETS operator is used along with the GROUP BY clause, and allows you to make multi-grouped queries just by specifying the grouping sets separated by comma. However, you need to be careful when specifying the grouping sets. For example, if a grouping contains two columns, say column A and column B, both columns need to be contained within parenthesis: (column A, column B). If there’s not a parenthesis between them, the GROUPING SETS clause will define them as separate groupings, and the query will not return the desired results.
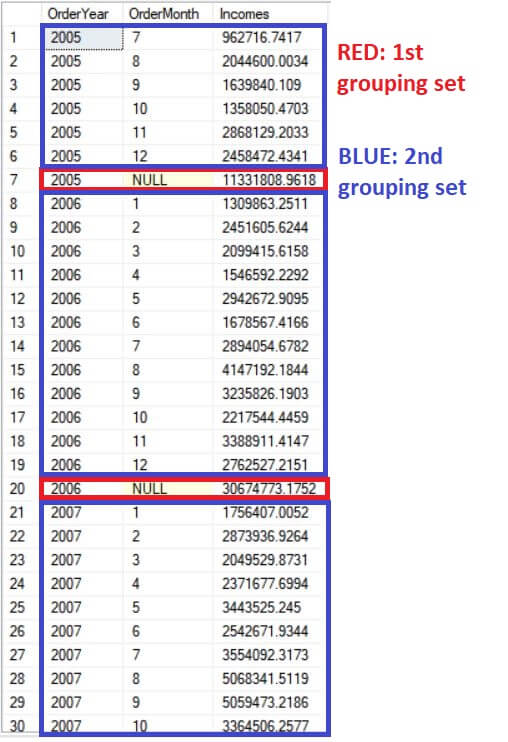
Figure 3. Company’s income per year and per year and month using the GROUPING SETS clause.
By the way, if you want to perform the aggregation over the entire result set without grouping but still use the GROUPING SETS operator, just add an empty parenthesis for the grouping set. Look at Query 5 which calculates the company’s income per year, month, and overall total:
Query 5. Company’s income per year, per year and month, and overall.
|
1 2 3 4 5 6 7 8 9 10 11 12 13 |
SELECT YEAR(OrderDate) AS OrderYear, MONTH(OrderDate) AS OrderMonth, SUM(SubTotal) AS Incomes FROM Sales.SalesOrderHeader GROUP BY GROUPING SETS ( YEAR(OrderDate), --1st grouping set (YEAR(OrderDate),MONTH(OrderDate)), --2nd grouping set () --3rd grouping set (grand total) ); GO |
Notice the placeholders for the third grouping shown in Figure 4. The query calculated the grand total of incomes by just specifying an empty parenthesis as the third grouping set; the third grouping set is the sum of SubTotal for the table itself.
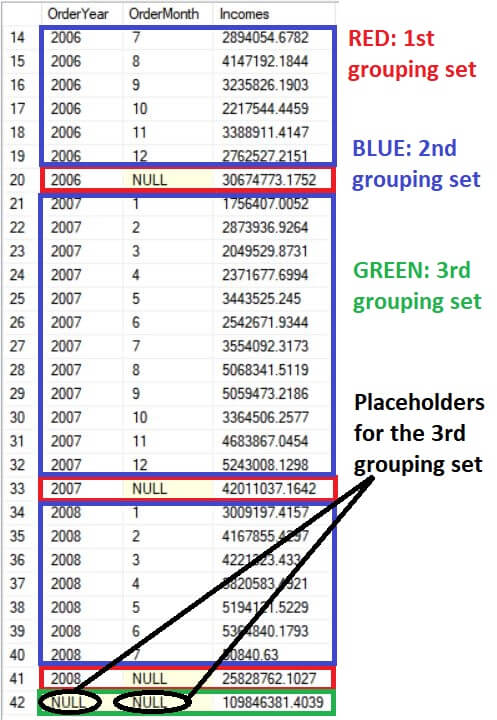
Figure 4. Company’s income per year, per year and month and all over the time.
By the way, if you’ve asked yourself “What would happen if the NULL is part of the data and isn’t used as placeholder?” or “How can I tell when NULL is used as placeholder or is just the value?” In this example, I ensured that the grouped columns aren’t nullable, so the NULLs are used as placeholders. In case the grouped columns are nullable, you will need to use the GROUPING or GROUPING_ID function to identify if the NULL came from the GROUPING SETS operator – it can also come with other groupings operators like ROLLUP and CUBE– or is part of the data. Both functions – GROUPING and GROUPING_ID– will be treated in another article.
Conclusion
In this article, you learned how to achieve an aggregate query with more than one grouping expression list by using the GROUPING SETS operator. Unlike other operators such as ROLLUP and CUBE, you must specify each grouping set. These grouping operators are very important for summarizing data and producing grand totals and sub totals. If you want more information about these operators, please read this article.
I suggest that you practice what you’ve learned in this article; this topic is very important for anyone working with SQL Server data. The data volume is increasing very quickly, and it’s vital to summarize it for better knowledge about the business.
This document contains proprietary information and is protected by copyright law.
Copyright © 2026 Red Gate Software Limited. All rights reserved
Load comments