
Report Builder 3.0 is a report-authoring tool that’s part of the Reporting Services suite of tools available in SQL Server 2008 R2. However, Report Builder is a free, stand-alone application that can be used by SQL Server developers and business users alike to create reports rich in data visualizations. It provides an Office-like interface that makes it easy to connect to a variety of data sources-such as SQL Server, SQL Azure, Oracle, and SAP NetWeaver BI-and to display the data from those sources in tables, charts, lists, gauges, and maps.
In this article, you’ll learn how to use Report Builder to create a report that displays data from a SQL Server database. Keep in mind that this article is only the first in a series of articles about Report Builder. This one covers only what you need to know to build a basic report. As we progress through the series, you’ll learn how to use other Report Builder elements that let you create a variety of interesting and informative reports.
You can download Report Builder at the Microsoft Download Center. There you’ll find details about system requirements and additional information about the installation process. You can also download sample reports that you can open in Report Builder.
To try out the examples in this article, you’ll need Report Builder 3.0 installed on your system. You’ll also need access to a SQL Server instance with the AdventureWorks sample database installed. The database will provide the data you need to create your report based on the examples I demonstrate here. On my system, I used a local instance of SQL Server 2012 with the AdventureWorks2012 database installed. But you can use different versions of both SQL Server (2005 and on) and the AdventureWorks database.
The best way to learn Report Builder is to jump right in. In this article, I walk you through the steps necessary to connect to a data source, define a dataset, and present the data in a formatted table. The goal of the article is to provide you with the foundation you need so you can create other types of reports as you need them. Of course, I can’t show you everything in a single article, but I can give you the information you need to start working with Report Builder right away.
Getting Started with Report Builder
All it takes to use Report Builder is to have it installed on your system. Of course, to create a report, you’ll also need to have access to a data source, such as a SQL Server database. But everything else is available through the Report Builder interface, so to get started, your initial step is to launch the application.
When you first open Report Builder, the GettingStarted dialog box appears, as shown in Figure 1. (You can see the Report Builder interface behind it.) The dialog box provides several options for creating a new report or opening an existing one. For the purposes of this article and the ones to follow, we won’t be using this dialog box. If you like, you can select the Don’t show this dialog box at startup option so you don’t have to mess with it going forward. Or you can simply close the box by clicking the red Close button in top-right corner.
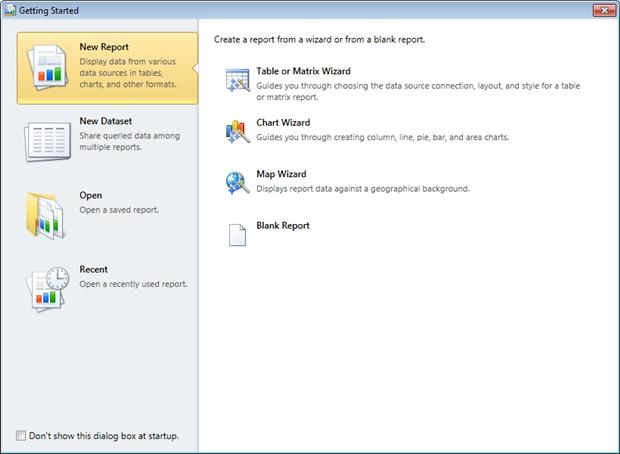
Figure 1: The welcome screen that appears when you open Report Builder
After you close the GettingStarted dialog box, you’re presented with the Home tab of the Report Builder interface, which is shown in Figure 2. At the top of the interface is the type of ribbon you’ve become familiar with in Microsoft Office products. It contains the options necessary to create and design your report. For each tab of the interface, the ribbon contains a different set of options. (You’ll learn more about these options as we progress through this article and the ones to follow.)
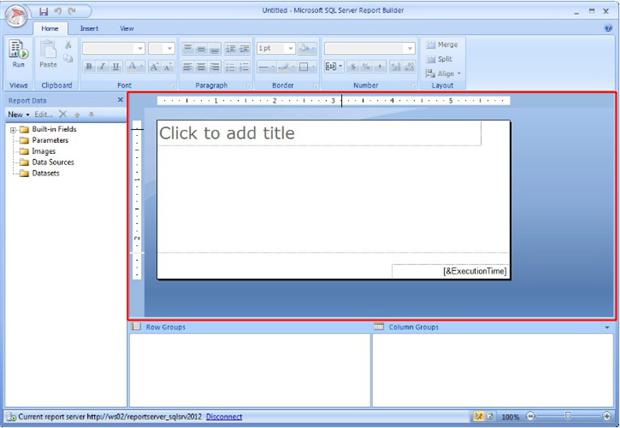
Figure 2: The Home tab of the Report Builder interface
At the left edge of the Report Builder interface is the ReportData window, which provides a hierarchical view of the built-in fields, parameters, images, data sources, and data sets available to your report. As with the ribbon options, we’ll dig into these more as we progress through this series. Same thing for the RowGroups and ColumnGroups windows, which, as you might expect, are tied to the way you group data on your report.
The main part of the Report Builder interface is the layout window (outlined in red). This is where you construct your report. Here you can add and configure the elements necessary to display your data, such as tables, graphs, and charts. You can also add elements such as text, images, and lines-many of the things that make your reports more appealing and effective.
Report Builder also includes a set of options that apply to the application as a whole. To access these options, click the Report Builder button (the large round button at the top-left corner of the screen), and then click the Options button. This launches the ReportBuilderOptions dialog box, shown in Figure 3.
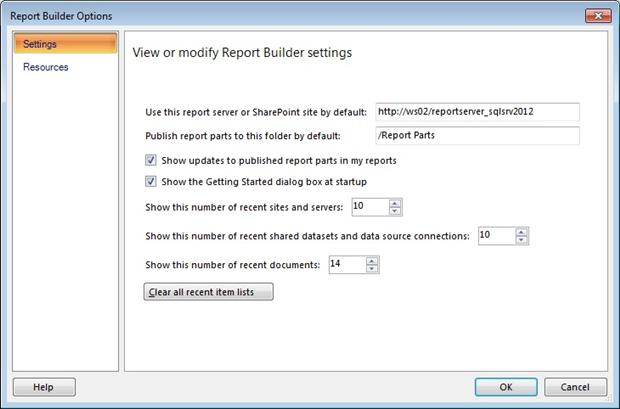
Figure 3: The Report Builder Options dialog box
The dialog box opens to the Settings page, which lists a number of options related to the Report Builder interface and report deployment. For now, the only setting that might concern you is the option Use this report server or SharePoint site by default. When you installed Report Builder, you might have specified a Reporting Services (SSRS) report server where you would eventually deploy your reports. If you provided an incorrect URL or that URL has changed, this is the place to enter the correct information. If the information is incorrect, you will have to wait for Report Server to verify the connection every time you start the application, which can be somewhat time-consuming. So if this issue applies to you, enter the path and then click OK.
Note: If you’re connecting to a Reporting Services instance other than the default, you append the instance name onto the path, preceded by an underscore. For example, the report server on my system was installed as part of SQL Server instance ws02/SqlSrv2012. As a result, I appended _sqlsrv2012 onto the URL http://ws02/reportserver so it became http://ws02/reportserver_sqlsrv2012, as you can see in Figure 3.
You might have noticed that the ReportBuilderOptions dialog box also includes a Resources page, which provides access to details about Report Builder and to additional information available online.
One other feature you should be aware of before we get started is how to save a report. When you first open Report Builder, you are essentially starting a new report. You can save this report and then access it as you work on it. To do so, click the ReportBuilder button and then click Save. This launches the SaveAsReport dialog box, shown in Figure 4.
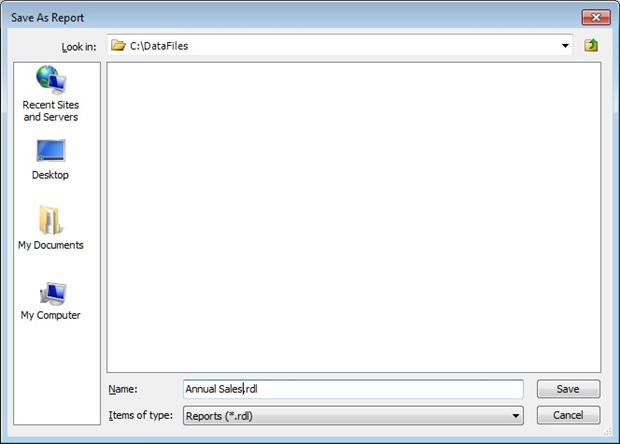
Figure 4: Saving a report in Report Builder
Although the SaveAsReport dialog box shows several option for saving a report, you essentially have two choice: save to the file system or save to the report server you designated in the ReportBuilderOptions dialog box. For now, we’ll simply save our report file to the local file system. On my system I navigated to the C:\DataFiles folder and named the report Annual Sales, which becomes the file name.
Notice that Report Builder reports use the .rdl extension, just like Reporting Services reports. Reporting Services reports and Report Builder reports are created using the Report Definition Language (RDL), an XML-based language that defines how data is retrieved and a report is laid out.
Once you’ve named and saved your report file, you’re ready to start creating your report. Be sure to save the file regularly as you develop your report. That way, you can always come back to the report and start where you left off. So, with that in mind, let’s get started.
Adding a Data Source to Your Report
Before you can add data to a report, you must be able to connect to a data source. The data source provides the connection necessary for your report to retrieve the data used to populate its contents. To add a data source, right-click the Data Sources node in the ReportData window, and then click AddDataSource. This launches the DataSourceProperties dialog box, shown in Figure 5.
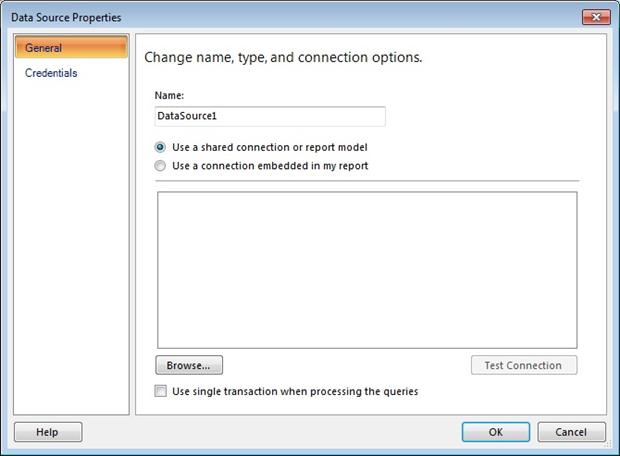
Figure 5: Adding a data source to your report
As you can see in the figure, you provide a name for your data source and then choose whether to use a shared connection or a connection embedded in the report. The first option lets you browse to a shared data source that has been published to a report server. Since we have not set up any shared data sources, we’ll go with the second option, which means we need to configure the connection we want to embed in the report.
So provide a name for your data source-I used AdventureWorks on my system-and then select the option Use a connection embedded in my report. When you select this option, new options appear in the DataSourceProperties dialog box, as shown in Figure 6. Notice that you must now select a connection type and define a connection string.
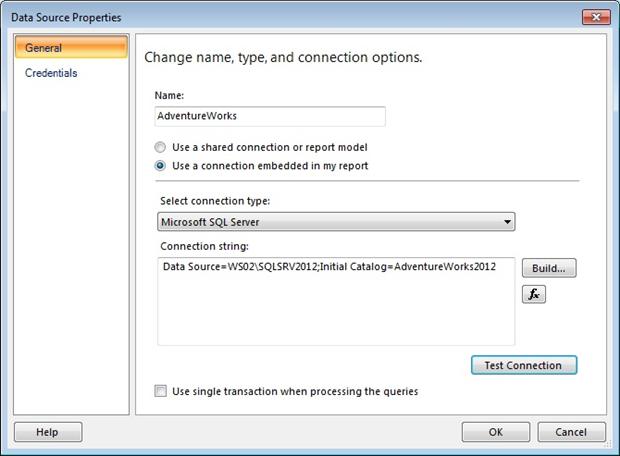
Figure 6: Configuring your data source
A Report Builder data source supports numerous connection types. To see a full list of what’s available, click the down arrow on the Selectconnectiontype drop-down list. You can then select the connection type you want to use. For this article, we’ll be using the MicrosoftSQLServer connection type, which is the default value, so in this case, you don’t need to take any steps to specify the connection type.
Next, you must build your connection string. The connection string shown in Figure 6 (in the Connectionstring text box) is the one I built for our examples. To build the connection string, click the Build button. This launches the ConnectionProperties dialog box, shown in Figure 7.
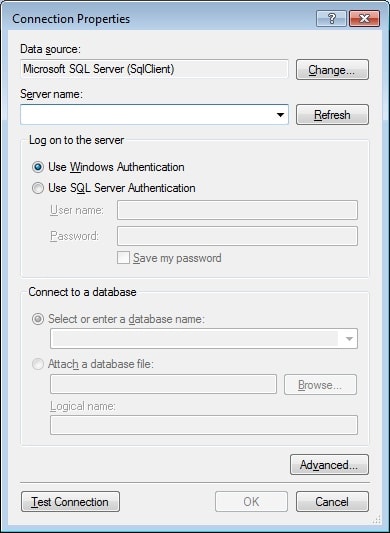
Figure 7: Building a connection string for your data source
From the Servername drop-down list, select the SQL Server instance that contains your source data. Then, if necessary, select an authentication model for connecting to that SQL Server instance. If you plan to use Windows Authentication, you don’t need to do anything. However, if you’ll be using SQL Server Authentication, you must select the Use SQL Server Authentication option and provide the necessary credentials. (To keep things simple for these exercises, I used Windows Authentication and ran Report Builder as an administrator.)
Next you must select the database that contains the source data. Since I’m using the AdentureWorks2012 database, that’s the one I selected. Figure 8 shows you what the ConnectionProperties dialog box looked like on my system after I finished configuring the connection properties.
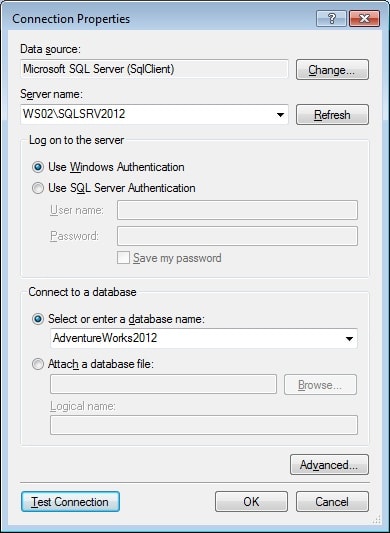
Figure 8: Configuring the connection properties
After you’ve configured the properties, you should test your connection. Then click OK to close the dialog box. You’ll be returned to the DataSourceProperties dialog box, which should now look similar to the one shown in Figure 6.
You might have also noticed that the DataSourceProperties dialog box includes a Credentials page. (So far, we’ve been working on the General page.) As shown in Figure 9, the Credentials page lets you change the credentials used to connect to the data source. You can configure this page only if your data source connection is embedded in the report (otherwise the options are grayed out). The report server can then use these credentials to connect to that data source. This enables other users to run the report without having to provide credentials for the underlying data source connection.
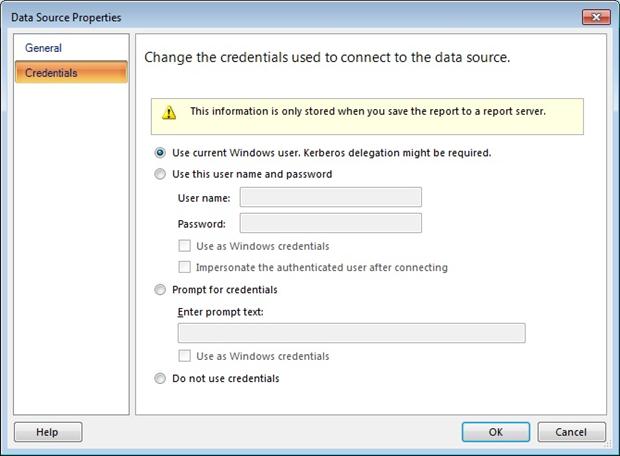
Figure 9: Changing the credentials used to connect to a data source
For now, we don’t need to be concerned about setting these credentials. So return to the General page if necessary and again test your connection. Then click OK to close the DataSourceProperties dialog box. Your new data source is added to the DataSources node in the ReportData window.
Adding a Dataset to Your Report
The next step in building your report is to create a dataset. A dataset defines the actual data that you want to retrieve from your data source. For example, if you’re data source is a SQL Server database, the dataset will be based a query or stored procedure that returns a result set you can use to populate your reports. The dataset acts as a bridge between your report and the data source. The data source establishes the connection, and the dataset defines what data is retrieved through that connection.
To create a dataset, right-click the Datasets node in the ReportData window, and then click AddDataset. This launches the DatasetProperties dialog box, shown in Figure 10. The dialog box opens on the Query page, which is the only page we need to be concerned about for now.
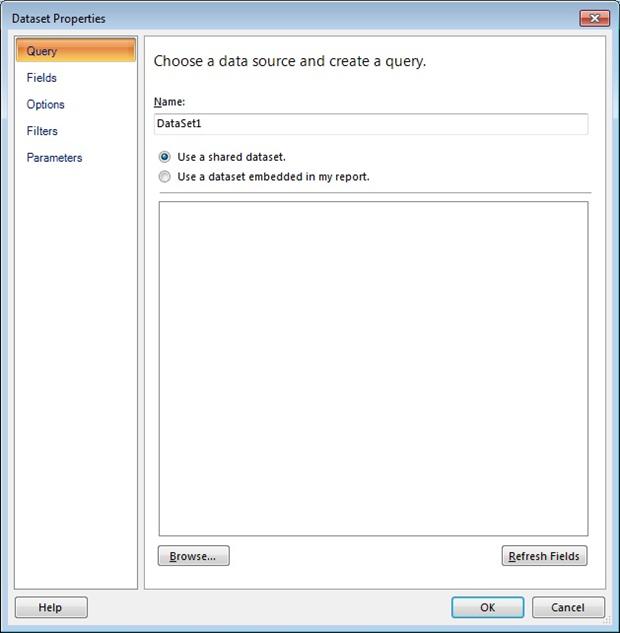
Figure 10: Adding a dataset to your report
As with the data source, you can use either a shared dataset or embed one in your report. Again, we’ll embed the information in the report. So provide a name for the dataset-I used AnnualSales-and then select the option Use a dataset embedded in my report. When you click this option, you’re presented with a several additional options, as shown in Figure 11.
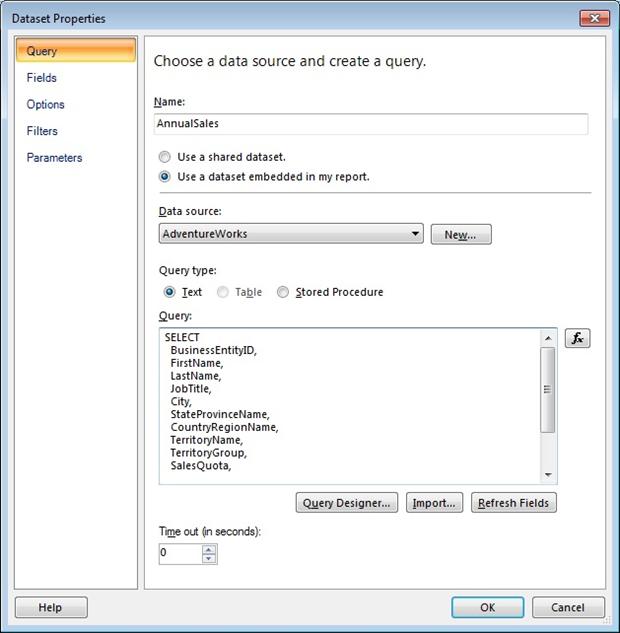
Figure 11: Configuring a dataset for your report
First, you’ll need to select the data source on which the dataset is based. From the Datasource dropped-down list, select the AdventureWorks data source (or whatever you named your data source). Then, in the Query text box, enter the following query:
|
1 2 3 4 5 6 7 8 9 10 11 12 13 14 15 16 17 |
SELECT BusinessEntityID, FirstName, LastName, JobTitle, City, StateProvinceName, CountryRegionName, TerritoryName, TerritoryGroup, SalesQuota, SalesYTD, SalesLastYear FROM Sales.vSalesPerson WHERE TerritoryGroup IS NOT NULL; |
As you can see, we’re selecting several columns from the Sales.vSalesPerson view. Each column returned from the query can be used as a field in your report. Click OK to close the DatasetProperties dialog box.
Your dataset should now be listed on the Datasets node in the ReportData window. And beneath the dataset, you should see a list of the fields returned by your dataset. For example, you should see the BusinessEntityID, FirstName, LastName, JobTitle, and all the other columns returned by your result set. You can now use these fields to build your report.
Adding a Table to Your Report
Once you’ve added your data source and dataset, you can add a data region or data visualization. A data region is a report object that displays your source data in a tabular format (rows and columns). Report Builder supports the following data region objects:
- Table: A tabular object that contains a fixed number of columns. But the rows are dynamic, which means they can expand to accommodate the data you’re trying to display. It also means you don’t need to know how many rows of data will be returned by the data source when you add your table to the report, although you do have to specify the columns.
- Matrix: A tabular object similar to a table, except that your columns can be static or dynamic, which means the report can grow both vertically and horizontally. A matrix is a lot like a crosstab or pivot table.
- List: A tabular object that presents data in a freeform fashion. Lists are handy for creating forms such as invoices.
As we work through this series, we’ll dig deeper into each of these data region types. But for now, let’s look at the data visualizations. A data visualization is an object that displays the source data graphically in order to provide a conceptual overview of the underlying information. Report Builder supports the following data visualizations:
- Chart: A graphical presentation of the data in the form of such objects as bar, pie, and line charts.
- Gauge: A key performance indicator (KPI) that presents a range of data, with an indicator that points to a specific value within that range.
- Map: Data presented against a geographical background. The data can be based on SQL Server spatial data, an Economic and Social Research Institute (ESRI) shapefile, or Microsoft Bing map tiles.
- Data bar: A simple chart used in conjunction with other data and charts to present complex information in a small space. A data bar typically represents only a single data point.
- Sparkline: A simple chart similar to a data bar, except that it typically presents a series of information.
- Indicator: A small gauge that displays the state of a single data value.
As with the various types of data regions, we’ll go into each of the data visualizations more deeply as we progress through this series. For now, let’s focus on how to add a table to our report. To do so, go to the Insert tab, shown in Figure 12. As you’ll discover, the ribbon includes the data regions and data visualizations-along with other elements-that you can add to your report.
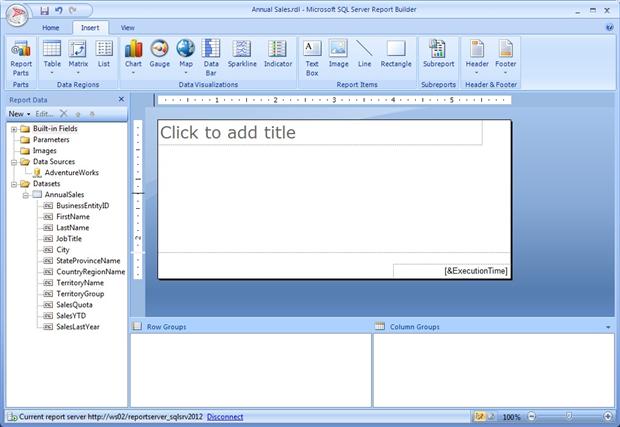
Figure 12: The Insert tab of the Report Builder interface
If you want, you can modify your design surface to make it bigger. You can also reduce the size of the RowGroups and ColumnGroups windows. For example, as you can see in Figure 13, I made the design surface bigger and moved the text box within the footer. (The footer is the region beneath the dotted line near the bottom of the design surface.)
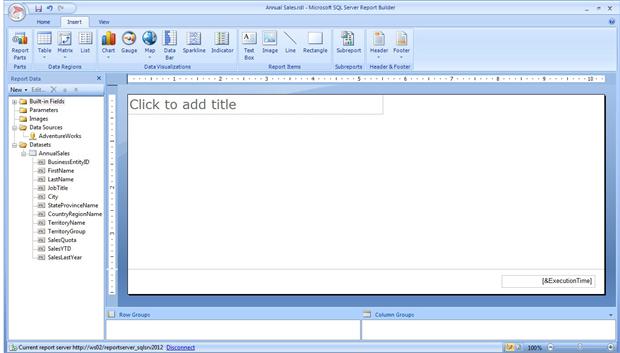
Figure 13: Modifying the design surface in Report Builder
The best way to learn how to move these elements around is to experiment with them. Normally it involves dragging a corner or side from one point to the other. If you’ve ever worked with a draw program, you’ll find the principles to be essentially the same.
Now let’s add out table. Click the down arrow beneath the Table icon on the ribbon, and then click InsertTable. Next, move your cursor to the design surface. The cursor becomes a plus sign with a tiny table icon. Position the cursor where you want the top-left corner of your table to sit, click the left mouse button, and then drag the cursor to the point where you want the bottom-right corner to sit. The red arrow in Figure 14 shows the direction to move the cursor.
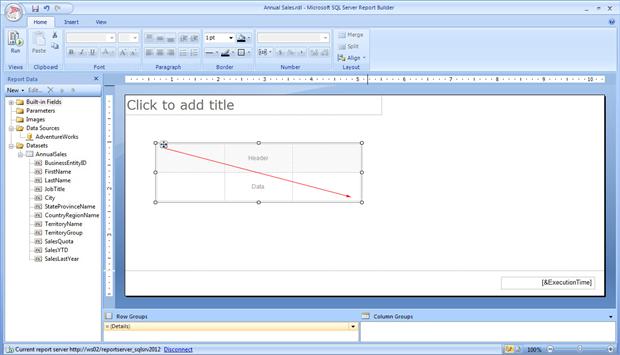
Figure 14: Adding a table to your report
When you let go your cursor, the table object is added to your report. It should look similar to the one shown in Figure 14 (without the red arrow, of course). The next step is to add the fields you want to include in your report. For the report I’m demonstrating here, we’ll add the following fields (in the specified order): FirstName, LastName, TerritoryGroup, SalesQuota, and SalesYTD.
To add a field, drag it from the list of fields in the ReportData window to the appropriate column in the table object. For example, drag the FirstName field to the first column and the LastName field to the second column. For the fourth column, drag the field to the right side of the table. When a heavy blue line appears, drop the field on that line. The column will be added to the table. You might have to play around with this a bit, but over all you should find the process very straightforward. Once you’ve added all five columns, your table should look similar to the one shown in Figure 15.
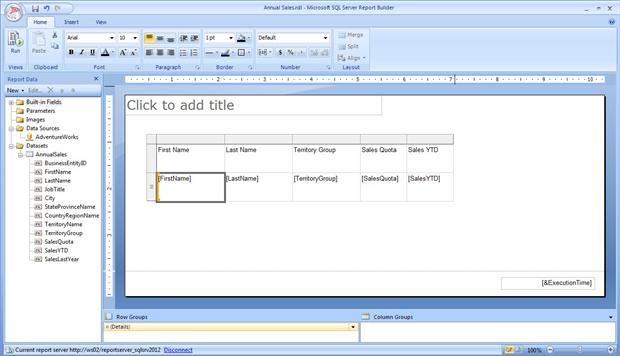
Figure 15: Adding columns to your table
That’s all there is to adding a table to a report. You can now view the report so you can see how the table will look after the report has been deployed report. To view the report, click the View button at the left end of the ribbon. This will take you to the Run tab, as shown in Figure 16.
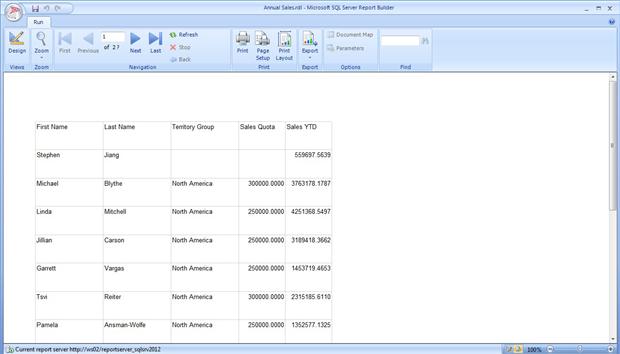
Figure 16: Viewing the table you’ve added to your report
As you can see, the table is now populated with the columns and rows of data from your data source, with the column headings displayed in the first row. Notice that Report Builder automatically changes compound column names to separate words. By previewing the report in this way, you know how it will be rendered once it is actually deployed. The data might change, but the format itself will remain.
Moving Ahead with Report Builder
Of course, the way the table is currently displayed in the report is fairly inadequate. Although you now know how to add a data source, dataset, and table, that’s not enough to make a report something that people will want to look at. You must attend to the elements that control how the table and the rest of the report look so you’re presenting data in a readable and accessible way. In the next article, I’ll show you how to format your report to address these issue. Be sure to save the report you created here, because we’ll be building on that as we learn more about the various ways you can make your report a lot more appealing.


Load comments