
In an earlier article, I explained why you might see log file switches taking place much more frequently than expected, with the archived redo files being much smaller than the online redo log files.
When I do presentations about the odd effects that can appear in a fairly ordinary Oracle system, I’m often asked what I did to work out what was happening under the covers. In this article, I will describe a few of the steps I took to investigate this aspect of the logging and archiving mechanism. It’s not rocket science, and most of the time, all I ever do is use methods that have been available for decades.
cpu_count
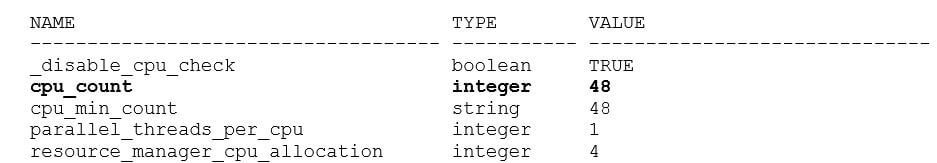
I started with a review of some default parameter settings and the resulting allocation of public and private redo strands. Somewhere along the line, I pointed out that with “my cpu_count of 48” I got 3 public redo strands.
I don’t actually have a laptop with 48 CPUs – I have a laptop with a single core and 4 CPUs that can do double-threading to look like 8 CPUs, and I was running 19c in a virtual machine configured with 4 CPUs. I set the cpu_count parameter to 48 and restarted the instance – which still told me I had only 4 CPUs until I also set the parameter _disable_cpu_check to true. Now, after startup, I see the following:
|
1 |
SQL> show parameter cpu |
Given that I was going to mess with parameters a lot, I switched from a binary spfile to a pure text pfile, (create pfile from spfile command) and ended up issuing the following pair of commands fairly frequently:
shutdown transactional
|
1 |
startup pfile=’./initor19.ora’ |
That should tell you how I decided that processes defaults to 80 * cpu_count + 40 and found that the manual was slightly wrong in its statement about the default value of sessions (actually 1.5 * processes + 24) but correct in its statement about transactions (1.1 * sessions). I kept restarting the instance after changing the cpu_count in my pfile to see how the other parameters changed.
Redo Strands and In-Memory Undo (IMU)
In the previous article, I mentioned the existence of x$ structures but used v$latch_children to find out more about in-memory undo and redo strands. If you want access to the memory for redo strands and in-memory undo, you can query x$kcrfstrand (redo strands) and x$ktifp (in-memory undo) while connected as sys. First, the redo strands:
|
1 2 3 4 5 6 7 8 9 10 |
select ptr_kcrf_pvt_strand, first_buf_kcrfa, last_buf_kcrfa, total_bufs_kcrfa, strand_size_kcrfa, indx from x$kcrfstrand / |
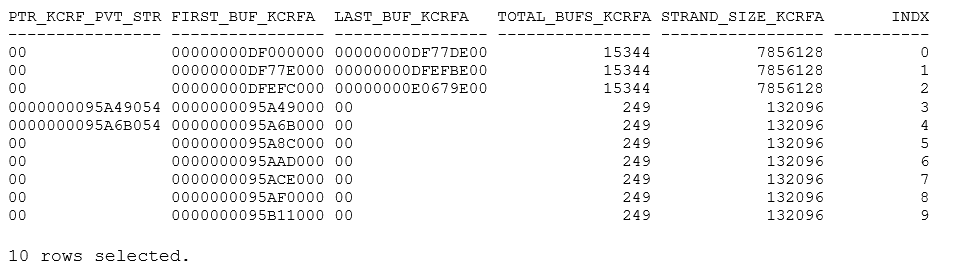
This output shows 3 (= 48/16) public redo strands using 7,856,128 bytes of memory each, and 7 private strands using 132,096 bytes of memory each. The latter was surprising since the number of redo allocation latches told me I should have 644 private strands. Possibly there’s some memory effect that stopped this from happening, or it’s an initial allocation that grows dynamically on demand. Still, I’ve actually been able to disable private redo strands completely by setting an “unlucky” size for the log_buffer parameter which left me with no private strands on startup and resulted in the system activity statistics incrementing the “IMU pool not allocated” and “IMU- failed to get a private strand” statistics on every transaction.
Now the in-memory undo:
|
1 2 3 4 5 6 7 8 9 10 11 12 13 14 15 |
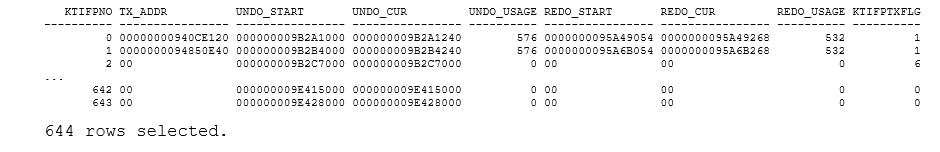
select ktifpno, ktifpxcb tx_addr, ktifpupb undo_start, ktifpupc undo_cur, to_number(ktifpupc,'XXXXXXXXXXXXXXXX') - to_number(ktifpupb,'XXXXXXXXXXXXXXXX') undo_usage, ktifprpb redo_start, ktifprpc redo_cur, to_number(ktifprpc,'XXXXXXXXXXXXXXXX') - to_number(ktifprpb,'XXXXXXXXXXXXXXXX') redo_usage, ktifptxflg from x$ktifp / |
I’ve selected all the rows from this structure (but deleted most of them) to show that Oracle had allocated all 644 even though it had only allocated a few of the private redo strands. If I wanted to query this structure for troubleshooting purposes, I’d probably add the predicate: where tx_addr != hextoraw('00') to limit the output to just the strands currently in use.
The log buffer and the log file
The next step was checking the connection between the log buffer / public strands and the log file. I had set the log_buffer parameter to 60MB with 3 public strands and a log file of 65MB and then made a single process do a lot of work. After seeing the effect on the size of the archived redo log file, I made the initial hypothesis that the three strands had been mapped to 3 areas in the log file. What could I do to confirm this hypothesis?
When I had my 3 strands of 20MB, the first 3 rows of x$kcrfstrand looked like this:
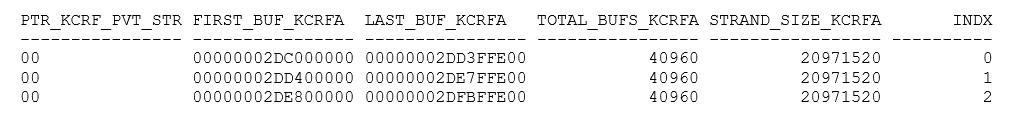
Notice the addresses given in the first_buf_kcrfa and the gaps between them:
- 0x00000002DE800000 – 0x00000002DD400000 = 0x1400000 = 20971520 (dec) = 20MB
- 0x00000002DD400000 – 0x00000002DC000000 = 0x1400000 = 20971520 (dec) = 20MB
You might assume that the three addresses are the starting addresses of the three memory areas of 20MB each. Take a look at the actual memory content by logging in as a privileged user and executing:
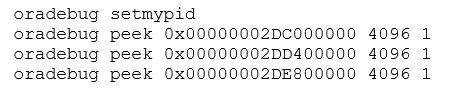
The oradebug peek commands will dump 4,096 (= 8 * 512) bytes starting at the memory location given (note the 0x prefix) to the session trace file and will also echo the first few of those bytes on screen. Here are the first 20 bytes that appeared on screen for the three calls:

A couple of numbers stand out here – the leading 00002201 (but I don’t know what that means) and the 0000025E that repeats down the list, which was the sequence number (v$log.sequence#) of the current online redo log file.
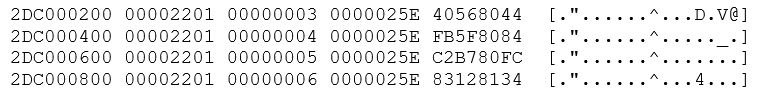
Using the UNIX grep command to find more occurrences of 00000253 in the trace files here are a few lines the first peek command:
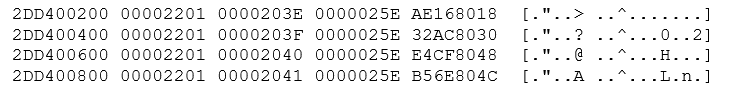
from the second peek:
and the third peek:
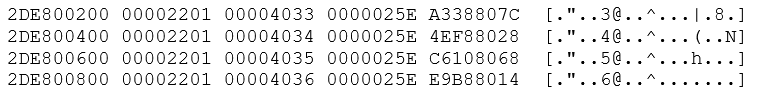
The left-hand column is the memory address; the next 4 columns hold the 16 bytes starting at that memory address. As you can see, the lines that grep has selected show memory addresses that are separated by 512 (hex 0x200) bytes and the second column is incrementing by one every time. The seco
nd column is the block number within the redo log file where each block of 512 bytes will be written.
There’s an important detail here. The block within file numbers aren’t consistent with blocks that are 20MB apart from each other (the gaps are approximately 0x2000 blocks, i.e. roughly 4MB). This shows that even though Oracle may have allocated three areas of 20MB in the log file, it hasn’t mapped each 20MB of file to a corresponding contiguous 20MB of memory; the mechanisms for using the memory must be a little more sophisticated than that.
To get a finer grained view of the activity, I changed the test to execute a larger number of smaller transactions and then started stepping through a redo strand 512 bytes (one block) at a time dumping 16 bytes at each step. I used a little PL/SQL to write a script to do this:
|
1 2 3 4 5 6 7 8 9 10 11 12 |
declare n1 number := to_number('&m_head','XXXXXXXXXXXXXXXX'); begin for i in 0 .. 127 loop dbms_output.put_line( 'oradebug peek 0x' || to_char(n1 + 512 * i , 'FMXXXXXXXXXXXXXXXX') || ' 16' ); end loop; end; / |
This script produced a list of oradebug peek {address} 16 commands that I spooled to a file then executed from SQL*Plus. You’ll see that I’ve got a substitution variable &m_head that I used to supply the starting address of a redo strand. Here are the results from the start of the first of the three redo strands in the latest test – the 0X2AD in the penultimate column tells you that I’ve switched log files several times since my previous experiments.
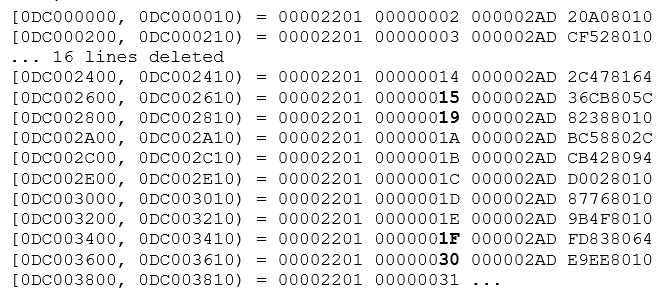
You’ll notice that this redo strand starts with blocks 0x2 to 0x15 of the redo file then jumps to block 0x19 and gets as far as block 0x1F before leaving another gap and jumping to block 0x30.
When executing the list of peeks into the second redo strand, you can discover the “missing” blocks:
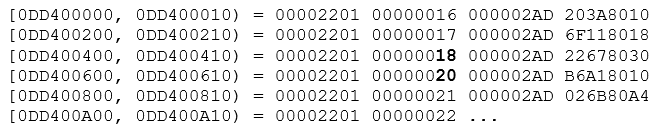
The result tells us that there’s something very dynamic about how Oracle handles the mapping between the redo log file and the in-memory public redo strands. Even though Oracle seems to use the size of the public redo strands as a sort of “rationing” mechanism, it’s not hard mapping from memory to file. This is good since the log writer would otherwise be making huge jumps around the redo log file to write it every time a session issued a commit. The appearance of large gaps in the lists of block numbers in the previous test must have been something to do with the sizes and numbers of concurrent transactions.
Next Steps
At this point, it’s important to pause for a moment to consider what’s been learned. The experiment established (with a reasonable degree of confidence) that the number of CPUs and the value of the log_buffer parameter have a critical impact on the size and number of the public redo threads and the potential “wastage” of space in the redo log files. You have determined that the actual wastage is then affected by the degree of concurrency of the work going on, and have noted that the pattern of the work (small or large transactions) may make some difference to the way writes to the redo log files are scattered.
The question at this point is – “what do we need to do next?” The answer, I think, is “Nothing”.
So far, what’s been learned provides an argument for picking a suitable size for the redo log files. Any further investigations are probably not going to tell anything useful. This is an excellent moment to stop digging unless you’re seeing some further problem that hasn’t yet been addressed.
On the other hand, there may be some interesting little details waiting to be discovered, and maybe there’s something that might turn out to be useful in a couple of years’ time. Here are a few more thoughts and observations and a few pointers on how to get started – for entertainment value only – that you might think about investigating.
Open Questions
Is the (hypothesized) block number seen in the in-memory redo thread really used to identify the location where that bit of the thread will be written, or is it just a hang-over from a time when the redo writing mechanism was much simpler?
When Oracle writes to the redo log file, does it write sequentially or will it have to jump around the log file? (Is this question answered by the previous one?)
When recovery is taking place, will Oracle read the log file sequentially or will it have to jump around the log file to read redo records in the correct SCN order? (Is this also addressed by the first question?)
Will a single transaction be associated with a single public redo thread until it commits? (If so, how would this affect scalability in the face of a lot of highly concurrent activity?)
One strategy to start finding answers to these questions is simply to dump an archived log file and start comparing the “logical” dump with a raw physical dump.
If you are interested in extending your understanding of the activity as Oracle handles redo, there’s some interesting material in Oracle Core (ISBN 978-1-4302-3955-0). However, for a very detailed examination of the concurrency issues and all the latching that goes on as Oracle moves data between sessions, private redo strands, public redo strands and the log files, Frits Hoogland has spent a lot of time in recent years investigating and writing up the details on his blog. A good starting point would be: https://fritshoogland.wordpress.com/2018/01/29/a-look-into-oracle-redo-part-1-redo-allocation-latches/
Looking at log files
After generating a little over 70 MB of redo by starting three concurrent processes in a loop doing many multi-row updates with commits so that Oracle filled and archived the current log file, I dumped the entire archived log file using the basic command:
alter system dump logfile {archived_log_filename};
Be careful when doing this, the archived log file was just under 65MB, but the trace file was just over 374MB. If you want to see what’s happening with a single transaction, you could limit the log file dump to a single transaction. Modify the update code to report transaction IDs (from v$tranaction.xidusn, xidslot and xidsqn) just before each commit and use one of the transaction triplets in the following command:
|
1 2 |
alter system dump logfile {archived_log_filename} xid {xidusn} {xidslot} {xidsqn}; |
One thing to pick out from the trace file would be an ordered list of “Redo Records”. Here’s how to find their headers with a simple grep command – or an egrep command if you want the “Change Vectors” at the same time:
|
1 2 |
grep -n "^REDO RECORD" {tracefile_name} egrep -n -e "^REDO RECORD" -e "^CHANGE" {tracefile_name} |
Here are the first few lines of output from my trace file (by this time I was on log file sequence 768 / 0x300)

The thing to pick out is the three-part RBA (redo byte address) which consists of {sequence#.block#.byte#} which tells you exactly where in the file the redo record starts. An interesting bit appeared further down my file:
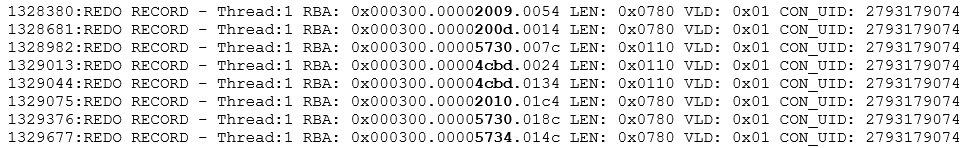
Take a look at the block numbers: to display these redo records in order (i.e. in SCN order) Oracle is jumping around three different areas of the archived redo log file. It’s important to spot backwards jumps, of course; if all you see are forward jumps, then that may simply be a timing/delay effect.
This result suggests two things: first, recovery does not read a log file sequentially to apply redo at the roll-forward stage; if your system uses multiple redo threads, recovery may be doing far more random I/Os than you had expected. Secondly, when Oracle writes to the redo log file the log writer (or each log writer slave) must be doing something far more complicated than it did in older versions – a writer may be turning a single contiguous piece of log buffer into a number of separate writes corresponding to the different areas of the log file, and that may have to be done with each public strand in turn for a fairly large number of commits.
Of course, it’s just possible (though it seems very unlikely) that with multiple private strands the RBA is no longer an indicator of the truth, maybe RBA 0x000300.0000200d.0014 no longer means the redo record at byte 0x14 of block 0x200d; but you can check that very easily with an O/S block dump. Block 0x200D (8205) will start after 8204 * 512 bytes so a suitable od (octal dump) command would be:
|
1 |
od -j4200960 -N512 -Ad -x {archived_log_filename} |
This skips 4,200,960 bytes, prints 512 bytes, gives the address in decimal, and the values in hexadecimal, with the following results for the first 48 bytes of the block:
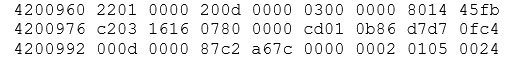
You’ll spot the 2201, 200d, 300 in the first line here that identify the block and conform to the three (8 byte) values stored at the start of each block in a public strand – so the RBA does mean what it says – and if you look at the whole redo record, you could start matching the contents of the O/S dump with the log file dump:

As a starting point, the first obvious match is the LEN: 0x0780 with the 0780 that appears at the 20th byte, another easy match is the SCN 0x00000b860fc4d7d7 / 0b86 d7d7 0fc4 and SUBSCN 13 / 000d
It looks as if any data in the public strands is copied directly to the log files, and the block address shown in each 512 byte block of memory really is the file block number that the data will be written to. Still, it may take a few more experiments to make us confident that that really is the case.
Conclusion
This article has been an exercise in demonstrating a few tools to poke around inside Oracle to get a broad idea of how some parts of the code are probably working. There hasn’t been much arcane knowledge needed; every tool or mechanism I’ve mentioned has been written about many times in the last 30 years.
In summary, the article:
- Tweaked a couple of parameters (one of them a hidden parameter)
- Took advantage of starting Oracle with a pfile instead of an spfile
- Queried v$latch_children
- Mentioned v$log.sequence#
- Queried x$kcrfstrand and x$ktifp – the closest you got to rocket science
- Used the oradebug peek command
- Used a couple of grep and egrep commands
- Looked for patterns in lists of numbers and made a couple of guesses
Then, considering options for further digging, we:
- Used a couple of “dump logfile” options of the alter system command
- Used the od command to view the raw contents of a file
What this proved (with some degree of confidence) is why the effective size of the online redo logs (as seen in the archived redo logs) isn’t always the same as the actual size, and how the log writer process and any “recover/replay” mechanism may have to do more work than it used to in earlier versions of Oracle to deal with the multiple public redo strands.
This document contains proprietary information and is protected by copyright law.
Copyright © 2026 Red Gate Software Limited. All rights reserved
Load comments