
F. Scott Fitzgerald
One of the most important tasks of a Proactive DBA is undoubtedly to gather accurate and reliable information. It is relatively easy to manage a few databases and instances, but when these get towards triple figures, you’ll need centralized management. Measurements, checks and alerts are vital for good centralized management of databases. To get effective checks for abnormalities that could mean a potential problem, you require information about what is normal. Every system has its own unique characteristics, , and so, to have a real idea of ââwhat’s going on with its health, we need a baseline of its behavior as a starting point.
There are many sources on the internet where you will find figures specifying the thresholds beyond which some activity, such as waits, is abnormal, but they are unlikely to reflect the actual circumstances of your system.
Remember your system is unique. For example , you’ll often hear it said that, if your system is running with constant CPU above 80% , then you’re wrestling with some kind of bottleneck . Well, this could be true, but would this necessarily mean you should become alarmed and try to work out what’s changed to give this figure? No. We get alerted to stress in the system before it becomes a problem by detecting changes in a range of metrics from the normal, not by seeing whether they exceed thresholds. It could be that, even after you’ve tuned your system to perfection, your normal baseline for CPU activity could be between 80% and 90%. This will always indicate that you need more hardware, but it could mean that you’re making very efficient use of the available hardware, and you haven’t the resources to upgrade it. There is no way of avoiding the need for baselines measured on your server-environment. I guarantee you will need to know the actual state of health of your servers, and the threshold figures that you find on the internet may not reflect the real world you inhabit and so will mislead you about what is going on with the servers in your care. Do not guess, collect.
These articles from my good friend and SQL Server MVP Ted Krueger is a very good start point. You should read it
Also the SQL Server MVP Erin Estellato has a good course in PluralSight – SQL Server: Benchmarking and Baselining
There are several tools for getting baselines, but Performance Monitor (PerfMon) is most commonly used, because it is free and comes with Windows. Performance Monitor uses Windows Performance counters which are a standard, so you can gather performance metrics from any server process. Even applications can be instrumented to produce them. There are several tools used by Ops teams to report and alert on the information gained from performance counter data. By gathering information from performance counters, you can, potentially, collect data from the entire technology stack in one place. You can then use PerfMon to overlay the data collected from the various sources to see how processes and servers interact under different conditions.
Today we will see how to properly use Windows PowerShell and the native cmdlet Get-Counter to collect Performance counters.
Get-Counter
Windows PowerShell has a native cmdlet called Get-Counter and by definition :
|
1 2 3 4 5 |
NAME Get-Counter SYNOPSIS Gets performance counter data from local and remote computers. |
This means that I don’t need to worry about the low-level process of getting counters. Instead, I just need to get to learn how to properly use the Get-counter cmdlet.
Selecting the Counters
You’ll probably find that the set of counters you need is already there. To find them in the Get-Counter cmdlet we use the parameter -listset.
|
1 |
Get-Counter -ListSet* |
|
1 2 3 4 5 6 7 8 9 10 11 12 13 14 15 16 17 18 19 20 21 |
PS C:\Users\Administrator> Get-Counter -ListSet * CounterSetName : TBS counters MachineName : . CounterSetType : SingleInstance Description : Performance counters for the TPM Base Services component. Paths : {\TBS counters\CurrentResources, \TBS counters\CurrentContexts} PathsWithInstances : {} Counter : {\TBS counters\CurrentResources, \TBS counters\CurrentContexts} CounterSetName : WSMan Quota Statistics MachineName : . CounterSetType : SingleInstance Description : Displays quota usage and violation information for WS-Management processes. Paths : {\WSMan Quota Statistics(*)\Process ID, \WSMan Quota Statistics(*)\Active Users, \WSMan Quota Statistics(*)\Active Operations, \WSMan Quota Statistics(*)\Active Shells...} PathsWithInstances : {\WSMan Quota Statistics(WinRMService)\Process ID, \WSMan Quota Statistics(WinRMService)\Active Users, \WSMan Quota Statistics(WinRMService)\Active Operations, \WSMan Quota Statistics(WinRMService)\Active Shells...} Counter : {\WSMan Quota Statistics(*)\Process ID, \WSMan Quota Statistics(*)\Active Users, \WSMan Quota Statistics(*)\Active Operations, \WSMan Quota Statistics(*)\Active Shells...} |
We can improve the view to show only the counter sets in alphabetical order, sorting and selecting only the CounterSetName Property ...
|
1 2 3 |
Get-Counter -ListSet* | Sort-Object CounterSetName| Select-ObjectCounterSetName |
|
1 2 3 4 5 6 7 8 9 10 11 12 13 14 15 16 17 18 19 |
PS C:\Users\Administrator> Get-Counter -ListSet * | Sort-Object CounterSetName | Select-Object CounterSetName CounterSetName -------------- .NET CLR Data .NET CLR Exceptions .NET CLR Interop .NET CLR Jit .NET CLR Loading .NET CLR LocksAndThreads .NET CLR Memory .NET CLR Networking .NET CLR Networking 4.0.0.0 .NET CLR Remoting .NET CLR Security .NET Data Provider for Oracle .NET Data Provider for SqlServer .NET Memory Cache 4.0 {970ffd59-856f-4caf-8bac-0bd9ab178afa} |
… or you can filter for only the SQL Server counter sets …
|
1 2 3 |
Get-Counter -ListSet SQL* | Sort-Object CounterSetName | Select-Object CounterSetName |
… filtering ‘SQL*’ in the -listset parameter:
|
1 2 3 4 5 6 7 8 9 10 11 12 13 14 15 16 17 18 19 20 21 22 23 24 25 26 27 28 29 30 31 32 33 34 35 36 37 38 39 40 41 42 43 44 45 46 47 48 |
PS C:\Users\Administrator> Get-Counter -ListSet SQL* | Sort-Object CounterSetName | Select-Object CounterSetName CounterSetName -------------- SQLAgent:Alerts SQLAgent:Jobs SQLAgent:JobSteps SQLAgent:Statistics SQLServer:Access Methods SQLServer:Availability Replica SQLServer:Backup Device SQLServer:Batch Resp Statistics SQLServer:Broker Activation SQLServer:Broker Statistics SQLServer:Broker TO Statistics SQLServer:Broker/DBM Transport SQLServer:Buffer Manager SQLServer:Buffer Node SQLServer:Catalog Metadata SQLServer:CLR SQLServer:Cursor Manager by Type SQLServer:Cursor Manager Total SQLServer:Database Mirroring SQLServer:Database Replica SQLServer:Databases SQLServer:Deprecated Features SQLServer:Exec Statistics SQLServer:FileTable SQLServer:General Statistics SQLServer:Latches SQLServer:Locks SQLServer:Memory Broker Clerks SQLServer:Memory Manager SQLServer:Memory Node SQLServer:Plan Cache SQLServer:Query Execution SQLServer:Replication Agents SQLServer:Replication Dist. SQLServer:Replication Logreader SQLServer:Replication Merge SQLServer:Replication Snapshot SQLServer:Resource Pool Stats SQLServer:SQL Errors SQLServer:SQL Statistics SQLServer:Transactions SQLServer:User Settable SQLServer:Wait Statistics SQLServer:Workload Group Stats |
In that view format, we are only showing the counter sets, but we can expand any specific set that we want in order to check what counters are included in it. Let´s use the SQLServer:Buffer Manager :
If we just select that listset…
|
1 |
Get-Counter -ListSet'SQLServer:Buffer Manager' |
…the output will be :
|
1 2 3 4 5 6 7 8 9 10 11 |
PS C:\Users\Administrator> Get-Counter -ListSet 'SQLServer:Buffer Manager' CounterSetName : SQLServer:Buffer Manager MachineName : . CounterSetType : SingleInstance Description : Statistics related to SQL Servers buffer manager Paths : {\SQLServer:Buffer Manager\Buffer cache hit ratio, \SQLServer:Buffer Manager\Page lookups/sec, \SQLServer:Buffer Manager\Free list stalls/sec, \SQLServer:Buffer Manager\Database pages...} PathsWithInstances : {} Counter : {\SQLServer:Buffer Manager\Buffer cache hit ratio, \SQLServer:Buffer Manager\Page lookups/sec, \SQLServer:Buffer Manager\Free list stalls/sec, \SQLServer:Buffer Manager\Database pages...} |
Or if we get the members :
|
1 |
Get-Counter -ListSet'SQLServer:Buffer Manager' |Get-Member |
|
1 2 3 4 5 6 7 8 9 10 11 12 13 14 15 16 17 18 |
PS C:\Users\Administrator>Get-Counter -ListSet 'SQLServer:Buffer Manager' | get-member TypeName: Microsoft.PowerShell.Commands.GetCounter.CounterSet Name MemberType Definition ---- ---------- ---------- Counter AliasProperty Counter = Paths Equals Method bool Equals(System.Object obj) GetHashCode Method int GetHashCode() GetType Method type GetType() ToString Method string ToString() CounterSetName Property string CounterSetName {get;} CounterSetType Property System.Diagnostics.PerformanceCounterCategoryType CounterSetType {get;} Description Property string Description {get;} MachineName Property string MachineName {get;} Paths Property System.Collections.Specialized.StringCollection Paths {get;} PathsWithInstances Property System.Collections.Specialized.StringCollection PathsWithInstances {get;} |
You will have noticed the’ Counter‘ property that contains all the counters within the SQLServer:Buffer Manager list set. By expanding this property …
|
1 |
Get-Counter -ListSet'SQLServer:Buffer Manager' |Select-Object -ExpandPropertyCounter |
… we then have all the counters :
|
1 2 3 4 5 6 7 8 9 10 11 12 13 14 15 |
PS C:\Users\Administrator> Get-Counter -ListSet 'SQLServer:Buffer Manager' | Select-Object -ExpandProperty Counter \SQLServer:Buffer Manager\Buffer cache hit ratio \SQLServer:Buffer Manager\Page lookups/sec \SQLServer:Buffer Manager\Free list stalls/sec \SQLServer:Buffer Manager\Database pages \SQLServer:Buffer Manager\Target pages \SQLServer:Buffer Manager\Integral Controller Slope \SQLServer:Buffer Manager\Lazy writes/sec \SQLServer:Buffer Manager\Readahead pages/sec \SQLServer:Buffer Manager\Page reads/sec \SQLServer:Buffer Manager\Page writes/sec \SQLServer:Buffer Manager\Checkpoint pages/sec \SQLServer:Buffer Manager\Background writer pages/sec \SQLServer:Buffer Manager\Page life expectancy |
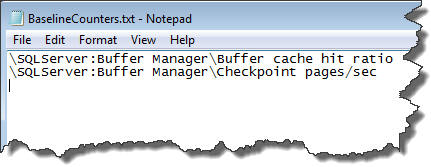
We also can export those counter s that we want to a text file :
|
1 2 3 4 |
Get-Counter -ListSet 'SQLServer:Buffer Manager' | Select-Object -ExpandProperty Counter | Where-Object {$_ -match '(Buffer Cache|CheckPoint)'} | Out-File c:\temp\BaselineCounters.txt -Append |
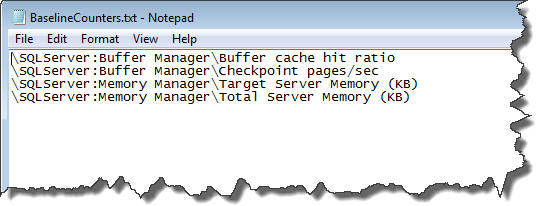
Now, in order to add other counters, we just need to repeat the same process : Lets do it with SQLServer:Memory Manager
|
1 2 3 4 |
Get-Counter -ListSet 'SQLServer:Memory Manager' | Select-Object -ExpandProperty Counter | Where-Object {$_ -match '(Target|Total)'} | Out-File c:\temp\BaselineCounters.txt -Append |
This way we can select all the counters, whether they are relevant to SQL Server or not, that we need in order to start our gathering.
Performance counters are combined under categories , as we’ve just seen by using the Get-Counter cmdlet with the-listset parameter. These categories combine the performance counters into a logic unit, but performance counters can also be partitioned into instances, such as ‘process thread' or ‘logical disk'. Let’s take a look into the ‘Logical Disk' list set. The property that says if it will have instances or not is CounterSetType :
|
1 |
Get-Counter -ListSet LogicalDisk | Select-Object CounterSetType | Format-list |
|
1 2 3 4 |
PS C:\Users\Administrator> Get-Counter -ListSet LogicalDisk | Select-Object CounterSetType | Format-list CounterSetType : MultiInstance |
It is a MultiInstance type. In case of only one instance, it will show SingleInstance. So if we expand the Counter Property:
|
1 |
Get-Counter -ListSetLogicalDisk | Select-Object -ExpandProperty Counter |
|
1 2 3 4 5 6 7 8 9 10 11 12 13 14 15 16 17 18 19 20 21 22 23 24 25 |
PS C:\Users\Administrator>Get-Counter -ListSet LogicalDisk | Select-Object -ExpandProperty Counter \LogicalDisk(*)\% Free Space \LogicalDisk(*)\Free Megabytes \LogicalDisk(*)\Current Disk Queue Length \LogicalDisk(*)\% Disk Time \LogicalDisk(*)\Avg. Disk Queue Length \LogicalDisk(*)\% Disk Read Time \LogicalDisk(*)\Avg. Disk Read Queue Length \LogicalDisk(*)\% Disk Write Time \LogicalDisk(*)\Avg. Disk Write Queue Length \LogicalDisk(*)\Avg. Disk sec/Transfer \LogicalDisk(*)\Avg. Disk sec/Read \LogicalDisk(*)\Avg. Disk sec/Write \LogicalDisk(*)\Disk Transfers/sec \LogicalDisk(*)\Disk Reads/sec \LogicalDisk(*)\Disk Writes/sec \LogicalDisk(*)\Disk Bytes/sec \LogicalDisk(*)\Disk Read Bytes/sec \LogicalDisk(*)\Disk Write Bytes/sec \LogicalDisk(*)\Avg. Disk Bytes/Transfer \LogicalDisk(*)\Avg. Disk Bytes/Read \LogicalDisk(*)\Avg. Disk Bytes/Write \LogicalDisk(*)\% Idle Time \LogicalDisk(*)\Split IO/Sec |
As we can see, all of the counters have (*) in the name. It means that each counter has more than one instance, or logical disk in this case. The ‘% Free Space’ counter will be present in each logical disk of your system. If you want to get the data from a specific logical disk, you need to specify it, otherwise the cmdlet will get the data from all logical disks. Let’s expand the instances:
|
1 |
Get-Counter -ListSetLogicalDisk | Select-Object -ExpandProperty PathsWithInstances |
|
1 2 3 4 5 6 7 8 |
PS C:\Users\Administrator>Get-Counter -ListSet LogicalDisk | Select-Object -ExpandProperty PathsWithInstances \LogicalDisk(HarddiskVolume1)\% Free Space \LogicalDisk(C:)\% Free Space \LogicalDisk(_Total)\% Free Space \LogicalDisk(HarddiskVolume1)\Free Megabytes \LogicalDisk(C:)\Free Megabytes \LogicalDisk(_Total)\Free Megabytes |
So if I just want the ‘Free Megabytes' from C: I will use ‘\LogicalDisk(C:)\Free Megabytes'. One of the beauties of PowerShell is that if I want all the instances, then I can just use the * and ‘\LogicalDisk(*)\Free Megabytes'. It will automatically collect the data from all instances of that counter.
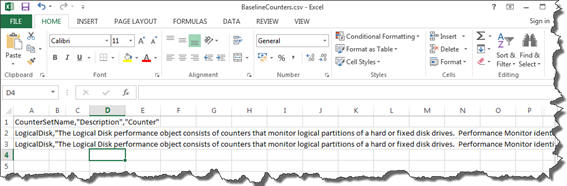
Another important point is that we can use a formatted file (as a .csv) to store the counters. I prefer that approach, since in a formatted file I can use the columns of the file as properties in PowerShell. This way I can create a file with more information but only use what I need in the Get-Counter cmdlet.
|
1 2 3 4 5 6 7 8 9 10 11 12 13 |
Get-Counter -ListSet 'LogicalDisk' | ForEach-Object { $CounterCategory = $_ $CounterCategory | Select-Object -ExpandProperty Counter | ForEach-Object { $CounterName = $_ $CounterName | Where-Object {$CounterName -match '(sec/Transfer|Avg. Disk Queue Length)'} | Select-Object @{E={$CounterCategory.CounterSetName};N="CounterSetName"}, @{E={$CounterCategory.Description};N="Description"}, @{E={$CounterName};N="Counter"} } } | Export-csv C:\temp\BaselineCounters.csv -NoClobber -NoTypeInformation -Append |
If you are using the PowerShell 4.0 version of the cmdlet, you have the benefits of using the new common parameter PipelineVariable. This parameter stores the current object into a variable, allowing you to use it in further levels of the pipeline process. Keith Hill explains it better in PowerShell V4 – PipelineVariable Common Parameter
|
1 2 3 4 5 6 7 |
Get-Counter -ListSet 'LogicalDisk' -PipelineVariable CounterCategory | Select-Object -ExpandProperty Counter -PipelineVariable CounterName | Where-Object {$CounterName -match '(sec/Transfer|Avg. Disk Queue Length)'} | Select-Object @{E={$CounterCategory.CounterSetName};N="CounterSetName"}, @{E={$CounterCategory.Description};N="Description"}, @{E={$CounterName};N="Counter"} | Export-csv C:\temp\BaselineCounters.csv -NoClobber -NoTypeInformation -Append |
And our csv will be looking like this:
Back to the text file, let’s use the same counters and we can do it in the same command line :
|
1 2 3 4 5 6 7 8 9 10 11 12 13 |
Get-Counter -ListSet 'LogicalDisk','SQLServer:Buffer Manager','SQLServer:Memory Manager' | ForEach-Object { $CounterCategory = $_ $CounterCategory | Select-Object -ExpandProperty Counter | ForEach-Object { $CounterName = $_ $CounterName | Where-Object {$CounterName -match '(sec/Transfer|Avg. Disk Queue Length|Buffer Cache|CheckPoint|Target Server|Total)'} | Select-Object @{E={$CounterCategory.CounterSetName};N="CounterSetName"}, @{E={$CounterCategory.Description};N="Description"}, @{E={$CounterName};N="Counter"} } } | Export-csv C:\temp\BaselineCounters.csv -NoClobber -NoTypeInformation -Append |
Or using the PowerShell 4.0 Pipeline Variable :
|
1 2 3 4 5 6 7 |
Get-Counter -ListSet 'LogicalDisk','SQLServer:Buffer Manager','SQLServer:Memory Manager' -PipelineVariable CounterCategory | Select-Object -ExpandProperty Counter -PipelineVariable CounterName | Where-Object {$CounterName -match '(sec/Transfer|Avg. Disk Queue Length|Buffer Cache|CheckPoint|Target Server|Total)'} | Select-Object @{E={$CounterCategory.CounterSetName};N="CounterSetName"}, @{E={$CounterCategory.Description};N="Description"}, @{E={$CounterName};N="Counter"} | Export-csv C:\temp\BaselineCounters.csv -NoClobber -NoTypeInformation -Append |
As I mentioned already, if you want an instance of some counter in Logical Disk or any that is multi instance, it is just a matter of selecting what you want and then exporting it to the CSV file, using the -append parameter.
In this case , if you are using PowerShell 2.0, it does not have the -append parameter in the Export-Csv cmdlet. The trick is to use the cmdlet Convertto-Csv and then output the results to CSV file using Out-File:
|
1 2 3 4 5 6 7 8 9 10 11 12 13 14 |
Get-Counter -ListSet 'LogicalDisk','SQLServer:Buffer Manager','SQLServer:Memory Manager' | ForEach-Object { $CounterCategory = $_ $CounterCategory | Select-Object -ExpandProperty Counter | ForEach-Object { $CounterName = $_ $CounterName | Where-Object {$CounterName -match '(sec/Transfer|Avg. Disk Queue Length|Buffer Cache|CheckPoint|Target Server|Total)'} | Select-Object @{E={$CounterCategory.CounterSetName};N="CounterSetName"}, @{E={$CounterCategory.Description};N="Description"}, @{E={$CounterName};N="Counter"} } } | ConvertTo-Csv -NoTypeInformation | out-file C:\temp\BaselineCounters.csv -Append |
Or In PowerShell 4.0 using PipelineVariable:
|
1 2 3 4 5 6 7 8 |
Get-Counter -ListSet 'LogicalDisk','SQLServer:Buffer Manager','SQLServer:Memory Manager' -PipelineVariable CounterCategory | Select-Object -ExpandProperty Counter -PipelineVariable CounterName | Where-Object {$CounterName -match '(sec/Transfer|Avg. Disk Queue Length|Buffer Cache|CheckPoint|Target Server|Total)'} | Select-Object @{E={$CounterCategory.CounterSetName};N="CounterSetName"}, @{E={$CounterCategory.Description};N="Description"}, @{E={$CounterName};N="Counter"} | ConvertTo-Csv -NoTypeInformation | out-file C:\temp\BaselineCounters.csv -Append |
Now it is just choosing the counters you want and storing them in the CSV file.
Gathering the Data
Using the idea of the CSV file, we already have all the counters that we want to collect, lets start to do it :
It is just a matter of importing the CSV file, choosing the counter property and then using the Get-Counter cmdlet:
|
1 2 3 |
$Counters = (Import-Csv C:\temp\BaselineCounters.csv).counter Get-Counter -Counter $Counters |
|
1 2 3 4 5 6 7 8 9 10 11 12 13 14 15 16 17 18 19 20 21 22 23 24 25 26 |
PS C:\Users\Administrator> $Counters = (Import-Csv C:\temp\BaselineCounters.csv).counter Get-Counter -Counter $Counters Timestamp CounterSamples --------- -------------- 04/03/2014 02:52:14 \\vader\logicaldisk(harddiskvolume1)\avg. disk queue length : 0 \\vader\logicaldisk(c:)\avg. disk queue length : 0,0486539327351918 \\vader\logicaldisk(_total)\avg. disk queue length : 0,0486539327351918 \\vader\logicaldisk(harddiskvolume1)\avg. disk sec/transfer : 0 \\vader\logicaldisk(c:)\avg. disk sec/transfer : 0,00815002966757939 \\vader\logicaldisk(_total)\avg. disk sec/transfer : 0,00815002966757939 \\vader\sqlserver:buffer manager\buffer cache hit ratio : 100 \\vader\sqlserver:buffer manager\checkpoint pages/sec : 0 \\vader\sqlserver:memory manager\target server memory (kb) : 110864 \\vader\sqlserver:memory manager\total server memory (kb) : 110856 |
Well, it is not the best view. We need to expand the CounterSamples property and select the properties :
|
1 2 3 4 5 6 7 |
$Counters = (Import-Csv C:\temp\BaselineCounters.csv).counter Get-Counter -Counter $Counters | Select-Object -ExpandProperty countersamples | Select-Object @{E={$_.timestamp};N="Date"}, @{E={$_.path};N="Counter"}, InstanceName, @{E={$_.cookedvalue};N="Value"} |
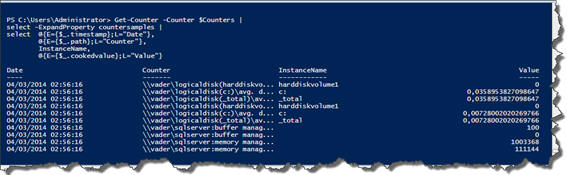
Now we get a better visualization of the counter information.
As I am not specifying the -computername parameter because it is collecting in the local computer. I could do the same process in any computers I want, just by informing the cmdlet via the -computername parameter …
|
1 2 3 4 5 6 7 |
$Counters = (Import-Csv C:\temp\BaselineCounters.csv).counter Get-Counter -ComputerName Vader,Obiwan,QuiGonJinn,Yoda,R2D2,C3PO -Counter $Counters | Select-Object -ExpandProperty countersamples | Select-Object @{E={$_.timestamp};N="Date"}, @{E={$_.path};N="Counter"}, InstanceName, @{E={$_.cookedvalue};N="Value"} |
…or even loading the computer names from a text file :
|
1 2 3 4 5 6 7 8 |
$Counters = (Import-Csv C:\temp\BaselineCounters.csv).counter $Computers = Get-Content c:\temp\Servers.txt Get-Counter -ComputerName $Computers -Counter $Counters | Select-Object -ExpandProperty countersamples | Select-Object @{E={$_.timestamp};N="Date"}, @{E={$_.path};N="Counter"}, InstanceName, @{E={$_.cookedvalue};N="Value"} |
So if we are running in several computers, why not separate the data to server and counter/Instance? Well, sure. First lets take a look in the Path property. It contains all the information that I need :
|
1 2 3 |
Get-Counter -Counter $Counters | Select-Object -ExpandProperty countersamples | Select-Object path |
|
1 2 3 4 5 6 7 8 9 10 11 12 |
Path ---- \\vader\logicaldisk(harddiskvolume1)\avg. disk queue length \\vader\logicaldisk(c:)\avg. disk queue length \\vader\logicaldisk(_total)\avg. disk queue length \\vader\logicaldisk(harddiskvolume1)\avg. disk sec/transfer \\vader\logicaldisk(c:)\avg. disk sec/transfer \\vader\logicaldisk(_total)\avg. disk sec/transfer \\vader\sqlserver:buffer manager\buffer cache hit ratio \\vader\sqlserver:buffer manager\checkpoint pages/sec \\vader\sqlserver:memory manager\target server memory (kb) \\vader\sqlserver:memory manager\total server memory (kb) |
If we split the path property in the ‘\\’ char it will create an array and we can see the items of that array with its index :
|
1 2 3 4 5 6 |
$Splitted = ((Get-Counter -Counter '\SQLServer:Buffer Manager\Buffer cache hit ratio' | select -ExpandProperty countersamples).path) -split '\\' (0..$Splitted.Count) | % { write-host "Index $_ is $($splitted[$_])" } |
|
1 2 3 4 5 6 7 8 9 10 11 12 |
PS C:\Users\Administrator> $Splitted = ((Get-Counter -Counter '\SQLServer:Buffer Manager\Buffer cache hit ratio' | select -ExpandProperty countersamples).path) -split '\\' (0..$Splitted.Count) | % { write-host "Index $_ is $($splitted[$_])" } Index 0 is Index 1 is Index 2 is vader Index 3 is sqlserver:buffer manager Index 4 is buffer cache hit ratio Index 5 is |
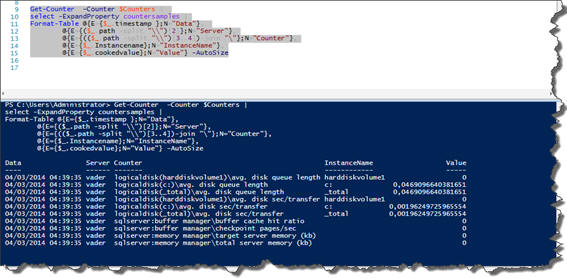
As we know that arrays in PowerShell are zero-based, the server name will be in the 2 index and the counter name 3 and 4 index. Now it is just a simple matter of splitting the values :
|
1 2 3 4 5 6 7 |
Get-Counter -Counter $Counters | select -ExpandProperty countersamples | select @{E={$_.timestamp };N="Data"}, @{E={($_.path -split "\\")[2]};N="Server"}, @{E={(($_.path -split "\\")[3..4])-join "\"};N="Counter"}, InstanceName, @{E={$_.cookedvalue};N="Value"} |
|
1 2 3 4 5 6 7 8 9 10 11 12 13 14 15 |
PS C:\Users\Administrator> Get-Counter -Counter $Counters | select -ExpandProperty countersamples | select @{E={$_.timestamp };N="Date"}, @{E={($_.path -split "\\")[2]};N="Server"}, @{E={(($_.path -split "\\")[3..4])-join "\"};N="Counter"}, InstanceName, @{E={$_.cookedvalue};N="Value"} Date : 04/03/2014 04:08:56 Server : vader Counter : logicaldisk(c:)\avg. disk queue length InstanceName : c: Value : 0,0454640661220845 |
We also can use the Format-Table and -autosize parameter :
|
1 2 3 4 5 6 7 |
Get-Counter -Counter $Counters | select -ExpandProperty countersamples | Format-Table @{E={$_.timestamp };N="Data"}, @{E={($_.path -split "\\")[2]};N="Server"}, @{E={(($_.path -split "\\")[3..4])-join "\"};N="Counter"}, @{E={$_.Instancename};N="InstanceName"}, @{E={$_.cookedvalue};N="Value"} -AutoSize |

We can see that theInstanceName property is unnecessary, since it is shown also in the Counter property. In the further examples we will omit it.
SampleInterval, Continuous and MaxSamples
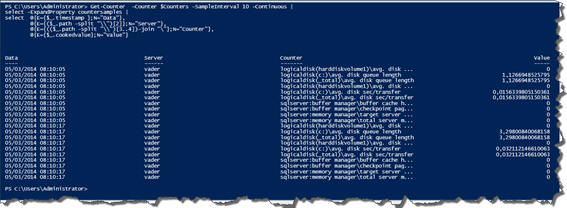
These parameters are used control de latency of the gathering. The SampleInterval parameter allows you to specify the time, in seconds, between the samples gathered. The Continuous, as the name itself suggests, is to collect the samples continuously. By Default, if it is not specified, Get-Counter only gets one sample. Lets say that I want to get the data in intervals of 10 seconds , continuously :
|
1 2 3 4 5 6 |
Get-Counter -Counter $Counters -SampleInterval 10 -Continuous | Select-Object -ExpandProperty countersamples | Select-Object @{E={$_.timestamp };N="Data"}, @{E={($_.path -split "\\")[2]};N="Server"}, @{E={(($_.path -split "\\")[3..4])-join "\"};N="Counter"}, @{E={$_.cookedvalue};N="Value"} |
With the MaxSamples parameters, you can specify the number of sample to gather. The default is one. Assuming that you only want to gather 20 samples in an interval of 10 seconds each one :
|
1 2 3 4 5 6 |
Get-Counter -Counter $Counters -SampleInterval 10 -MaxSamples 20 | Select-Object -ExpandProperty countersamples | Select-Object @{E={$_.timestamp };N="Data"}, @{E={($_.path -split "\\")[2]};N="Server"}, @{E={(($_.path -split "\\")[3..4])-join "\"};N="Counter"}, @{E={$_.cookedvalue};N="Value"} |
Note: The samples are gathered for the counter or set of counters specified in the Counter parameter. It also applies to the ComputerName Parameter. For a large set of counters and/or servers, it is highly advisable do it in background and asynchronous mode using runspaces or with Windows PowerShell Background Jobs and the Start-job Cmdlet.
Summary
In this article, we covered how to use the Get-Counter cmdlet for gathering the performance counters we need. In the next one, we will see how to store this data in a SQL Server table, and I’ll show some different ways to do it. Also we will learn how to do all this process using Windows PowerShell Background Jobs and scheduling them using Windows PowerShell Scheduled Jobs.

Load comments