
Catching them in the act
There are plenty of ways of finding out what processes are consuming CPU, killing your database’s performance. Beginning with SQL Server 2016, it’s become so much easier to monitor performance in SQL Server with Query Store, but there are plenty of techniques that are still useful to investigate SQL Server high CPU, particularly if you don’t have SQL Server 2016 Query Store on the database that you’re checking.
I have my favourite techniques for doing this: I like to use both process explorer and sp_whoisactive to find the queries that are taking too much CPU in SQL Server, but I like to run them at the actual moment that the heavy usage happens, even if I’m actually at home relaxing. In this article, I will show you how to use both these tools and, especially, how to do it in real time when the CPU needle is ‘hitting the red’. It is like catching a close-up of a villain in the floodlights at the very moment of the crime. I am talking about a technique where you set up an event-driven solution that will be fired by a WMI event when the CPU is high, thereby avoiding pooling and jobs having to running every few seconds. When it fires, the process checks if the source of the WMI event is SQL Server and then logs in and executes the statements for you. Yes, you don’t need to be in the front of your workstation; you can check later and then perform whatever corrective action needs to be done in the light of the data you’ve captured.
One of these techniques, using Process Explorer, is very nicely described here by Michael J Swart: Note that he updated the post, explaining that now he uses sp_whoisactive. I will show how to do it using both (Michael J Swart – Identifying High CPU SQL Processes)
Whatever the query you prefer to use, the big question will be how to do it in real time when the problem is actually happening, and log whatever information you need, even on the unattended server. There are plenty of times you need to do this, especially if you don’t have a full-time DBA or if you are running in the cloud and needs some support from the cloud provider. You can help the support Engineer by sending him the queries that are breaking your system. In AWS, this kind of service is out of scope of support, but if you have luck to find an Engineer that knows SQL Server and is willing to help you, as I was, it will, help him or her to help you to tune the queries. You just need to leave the solution and then get the CSV log with the queries.
This is how the solution works:
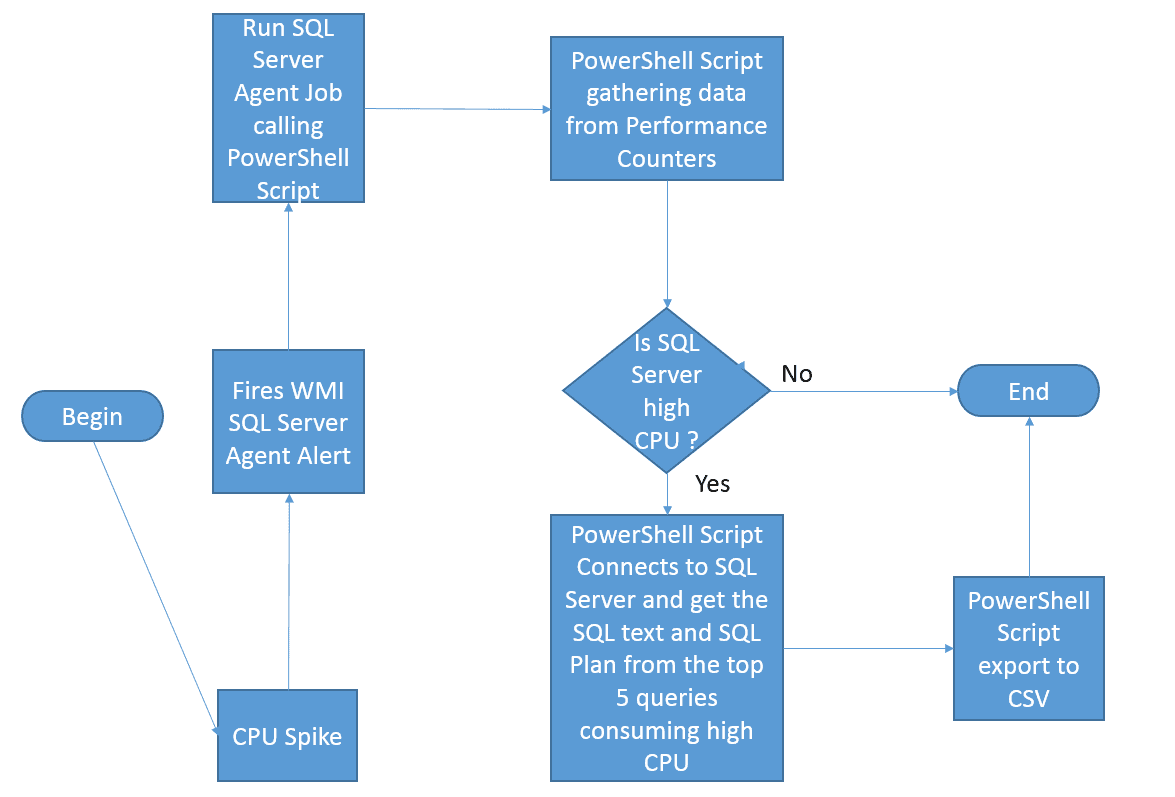
Because the PowerShell script needs to modify the registry to change the output from the Get-Counter [1], the account that will runs the PowerShell Script will need to have administrative rights; the SQL Server Agent Service account in this case.
In the case of AWS EC2 with SQL Server ( but not RDS, since this solution does not works in RDS), the account that is installed By default is the NT Service\SQLServerAgent, which does not have the appropriate permissions. For that we have two options :
- Change the SQL Server Agent Account to LocalSystem or an appropriate service account with elevated rights. Server Configuration – Service Accounts
- Create a SQL Proxy account to run the PowerShell Script. That is what we will use.
[1] See the following references – The Process object in Performance Monitor can display Process IDs (PIDs) and Handling Duplicate Instance Names
Configuring Permissions to run the Script
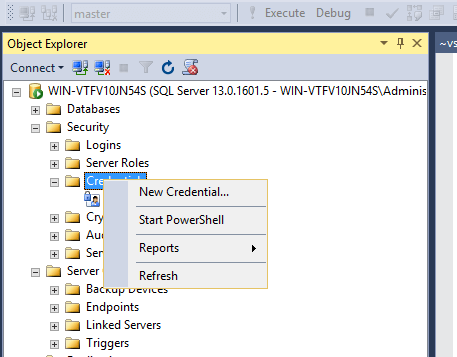
Open SSMS :
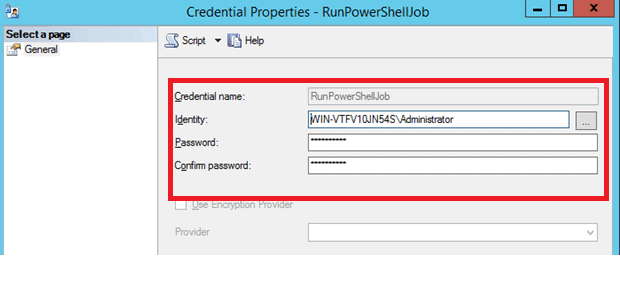
Create a Credential
‘Security’ -> ‘Credentials’->’New Credential’ and define a name and identity for the credential
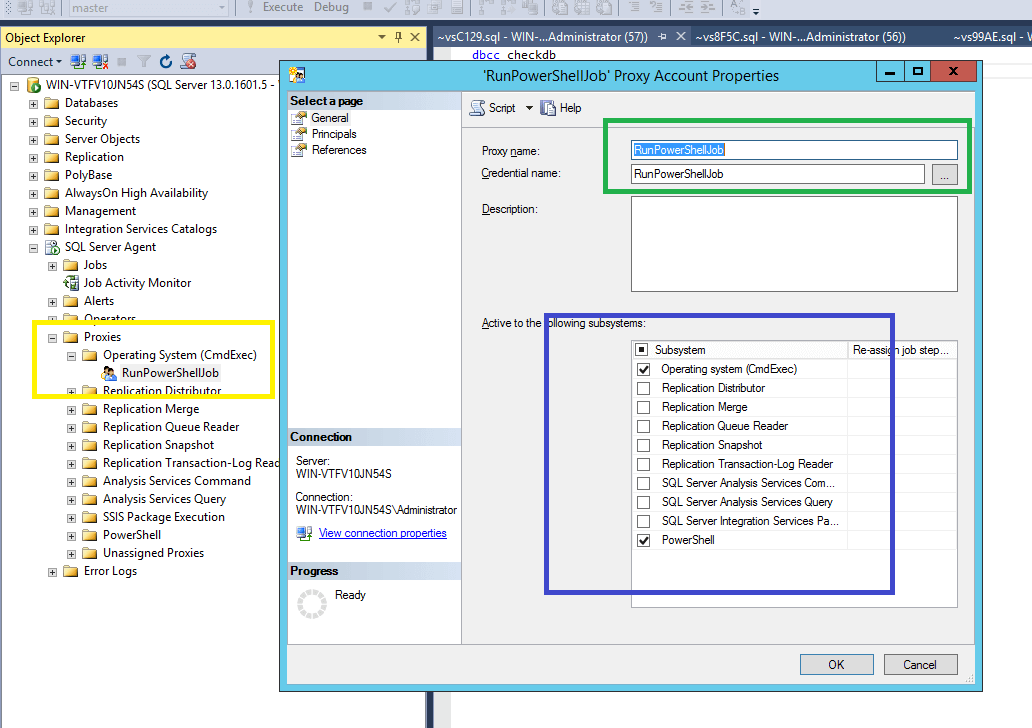
Create a SQL Proxy Account
‘SQL Server Agent’->’Proxies’->’Operating System(CmdExec)’->’New Proxy’ (Yellow box)
Type the ProxyName and associate this with the previous credential account created (Green box)
Check box what the account can do -> ‘Operating System(CmdExec)’ (checking ‘PowerShell’ is optional because the SQL Server job that will be created is a CmdExec Job and not PowerShell job)
Create the SQL Server Agent Job to call the PowerShell Script
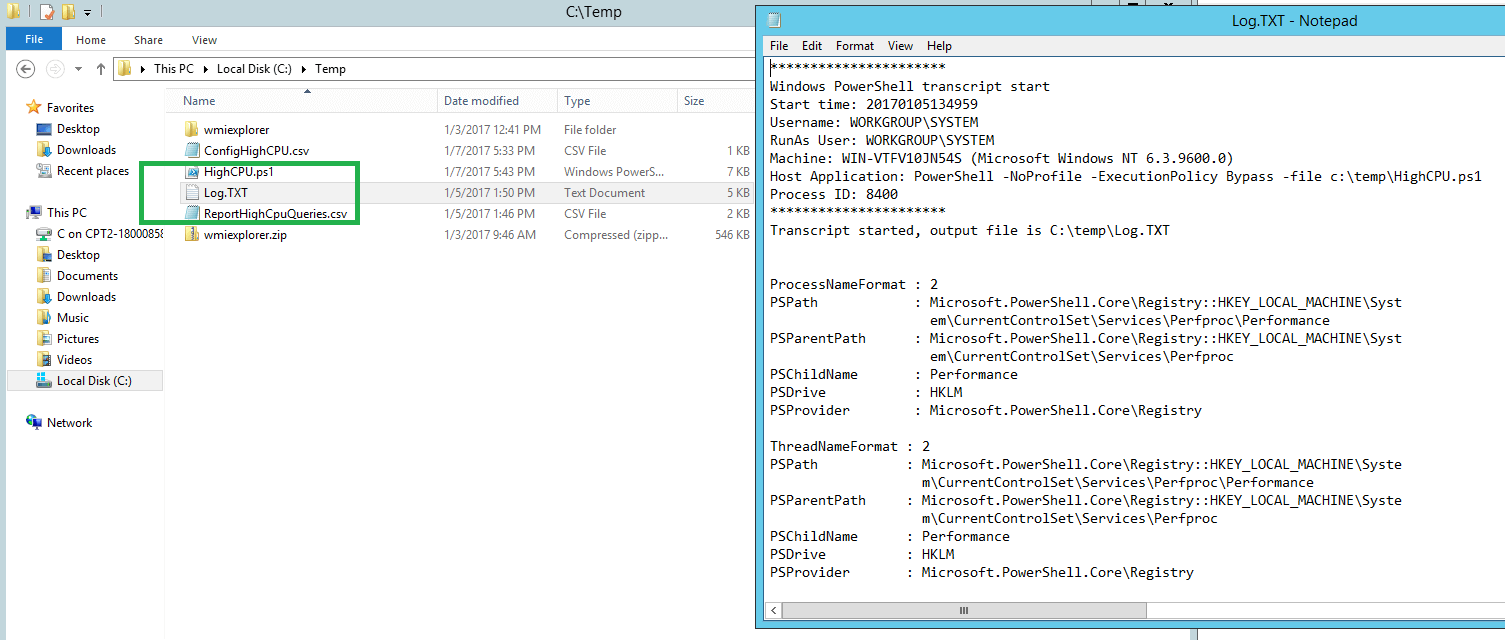
Create a path and save the HighCPU.ps1and ConfigHighCpu.csv files in this path ie: C:\temp
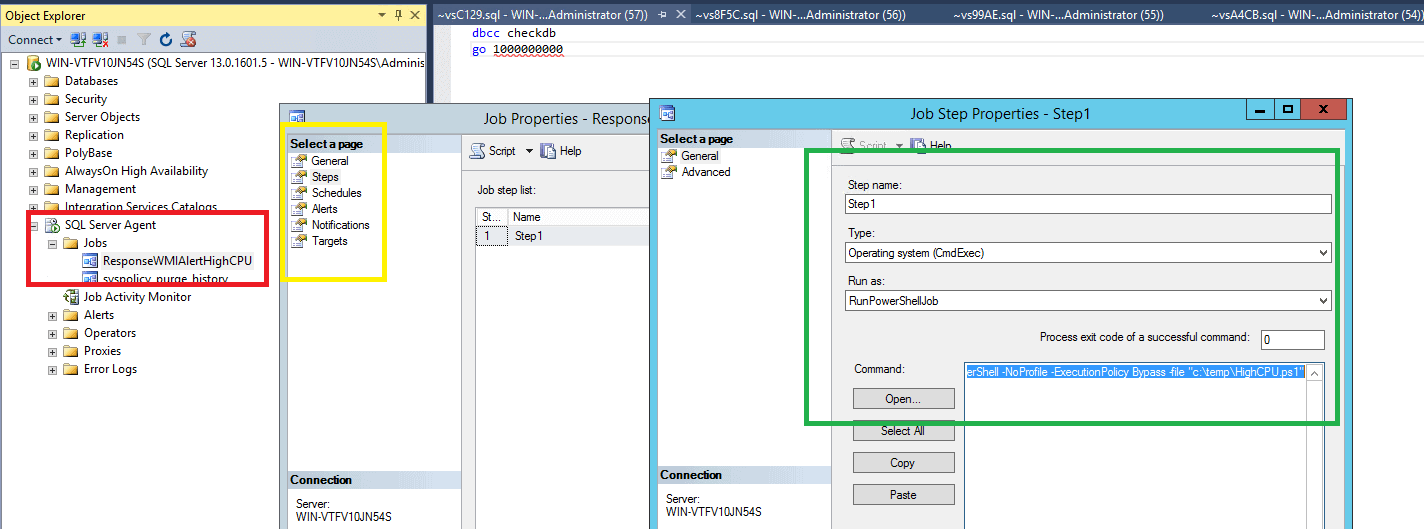
Go to ‘SSMS’->’SQL Server Agent’ -> ‘Jobs’ -> ‘New Job’ (Red)
In the tab ‘General’ (on the left side), type the name of the Job and click in the Step tab (Yellow box)
Type (see the Green box):
- The name of the Step. ie : ‘Step 1’
- In the ‘Type’ Choose ‘Operating System (CmdExec)’
- Run as – the Proxy Account previously created
- In the Command type :
PowerShell -NoProfile -ExecutionPolicy Bypass -file “c:\temp\HighCPU.ps1”, where the –file parameter requires the full path of the .ps1 file
Create a SQL Server WMI Alert for the High CPU
The intention is to avoid having any kind of program polling the CPU. We will, instead, use WMI Events fired by a SQL Server Agent Alert. It will be fired when the CPU exceeds the threshold defined in the WQL (Windows Query Language). It does not matter at this point if SQL Server is consuming CPU. This check will be made in the PowerShell script. The WMI SQL Server Agent Alert for high CPU is :
|
1 |
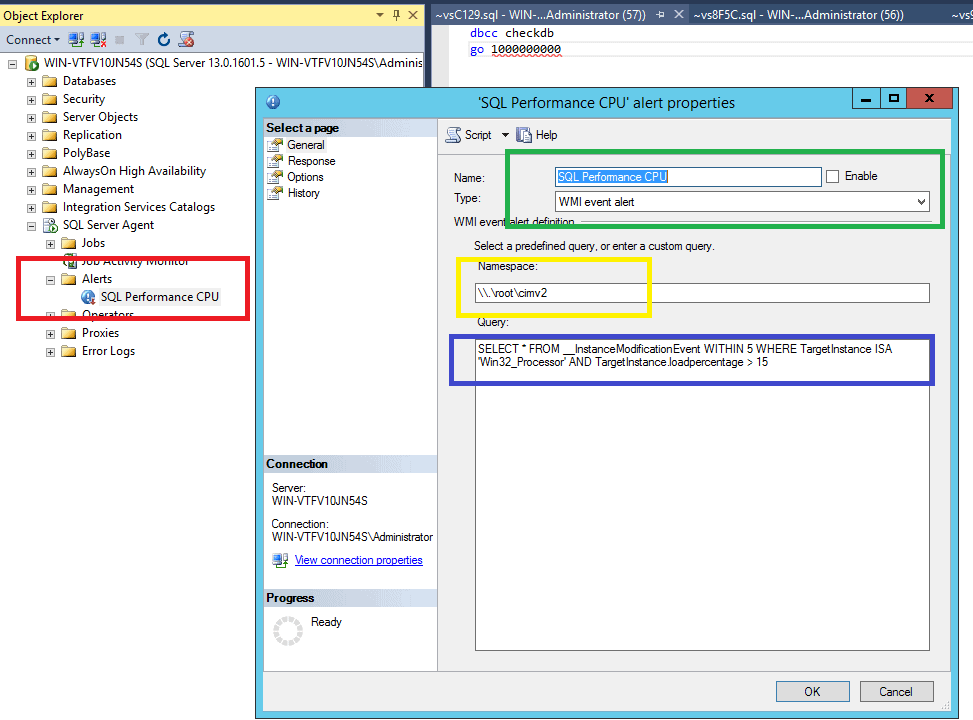
SELECT * FROM __InstanceModificationEvent WITHIN 5 WHERE TargetInstance ISA Win32_Processor' AND TargetInstance.loadpercentage > 50 |
The statement TargetInstance.loadpercentage > 50 identifies the threshold for the CPU. In the example the alert will be fired with anything more than 50% of CPU in Total.
To register the event :
- ‘SSMS’-> ‘SQL Server Agent’->’Alerts’->(Right Click)->’New Alert…’ (see the Red box)
- Add the name of the Alert and, in the ‘Type’ combo box, select ‘WMI event alert’ (see the Green box)
- In the ‘NameSpace’ type
\\.\root\cimv2(Yellow box) - In the Query Type the WQL I’ve already shown you : (Blue box)
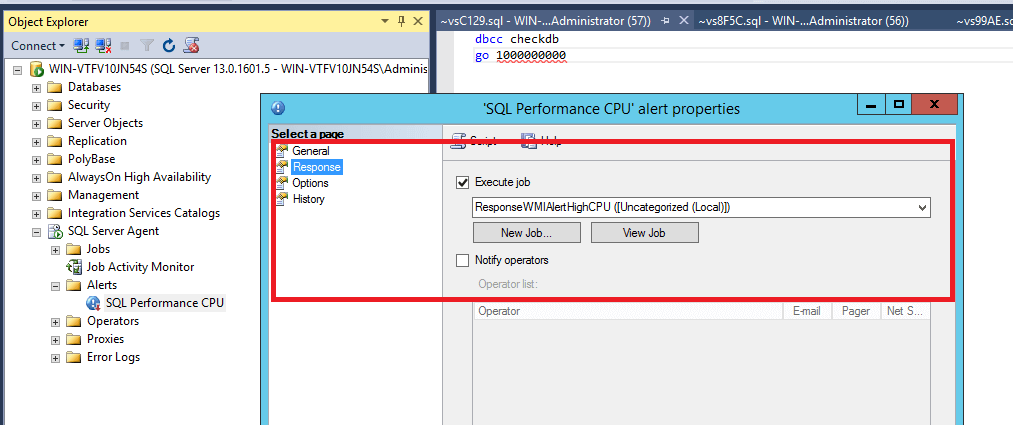
- In the ‘Response’ Tab, check the box ‘Execute Job’ and select the SQL Server Agent Job previously created
Set up the Configure File
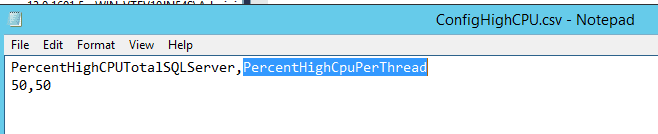
In the alert, we are setting up the event to be fired by total CPU so this configuration file will define the CPU threshold for the SQL Server process and each SQL Server thread from this process. Just open the ConfigHighCPU.csv file located at the same folder as the .ps1 file and provide:
PercentHighCPUTotalSQLServer – Defines the threshold for the total load percentage of the SQL Server process itself need to be above. IE 50 means that if the total process of the SQL Server is higher than 50% the PowerShell Script will gather the threads of this process.
PercentHighCpuPerThread – – Defines the threshold for the each thread of the SQL Server Process. IE 50 means if there are any thread higher than 50% the script will get the SQL Server statement and SQlL Server plan from this T-SQL
All is now set up.
When the Total CPU exceed 50%, the script will check if the SQL Server process CPU load percentage is higher than 50 (defined in the configuration file) and if it is, it will get the top 5 thread ids higher than 50% in a sample of 5 seconds and will connect into SQL Server, get the SQL Server statements related to these thread ids and log these in a CSV file called ReportHighCpuQueries.CSV. The information in this file is appended by the date and time.
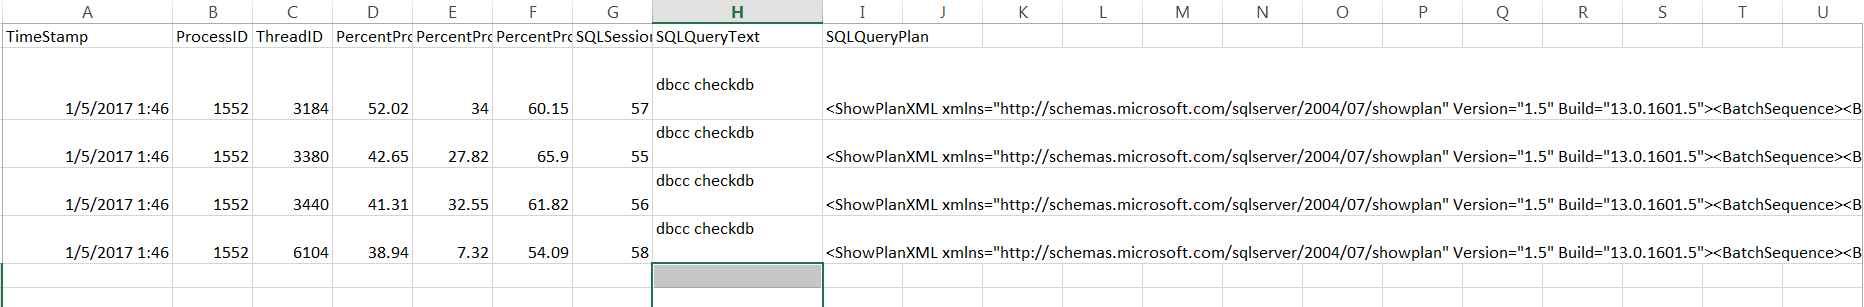
ReportHighCpuQueries.CSV
The output file called ReportHighCpuQueries.CSV will store the information :
- TimeStamp : Date and Time of the gathering
- ProcessID : ProcessID of the SQL Server
- ThreadId : Thread Id of the SQL Server Process
- PercentProcessorAVG : Average percent for this particular thread . This value is calculated always by the last gathering.
- PercentProcessorMin : Minimum percent for this particular thread . This value is calculated always by the last gathering.
- PercentProcessorMax: Maximum percent for this particular thread . This value is calculated always by the last gathering.
- SQLSessionID : Session Id in the SQL Server
- SQLQueryText : T-SQL that is running the high thread CPU
- SQLQueryPlan : SQL Plan of the query
The CSV file :
To check the query plan
Copy the SQLQueryPlan cell . Just the column SQLQueryPlan
Open SSMS and type :
|
1 2 3 |
set showplan_xml on go select '' |
–2 single quotes and then paste the cell you just copied between the ”
IE :
|
1 2 3 |
Set showplan_xml on GO SELECT '<ShowPlanXML xmlns="http://schemas.microsoft.com/sqlserver/2004/07/showplan" Version="1.5" Build="13.0.1601.5"><BatchSequence><Batch><Statements><StmtSimple StatementText="dbcc checkdb" StatementId="1" StatementCompId="1" StatementType="DBCC" RetrievedFromCache="false" /></Statements></Batch></BatchSequence></ShowPlanXML>' |
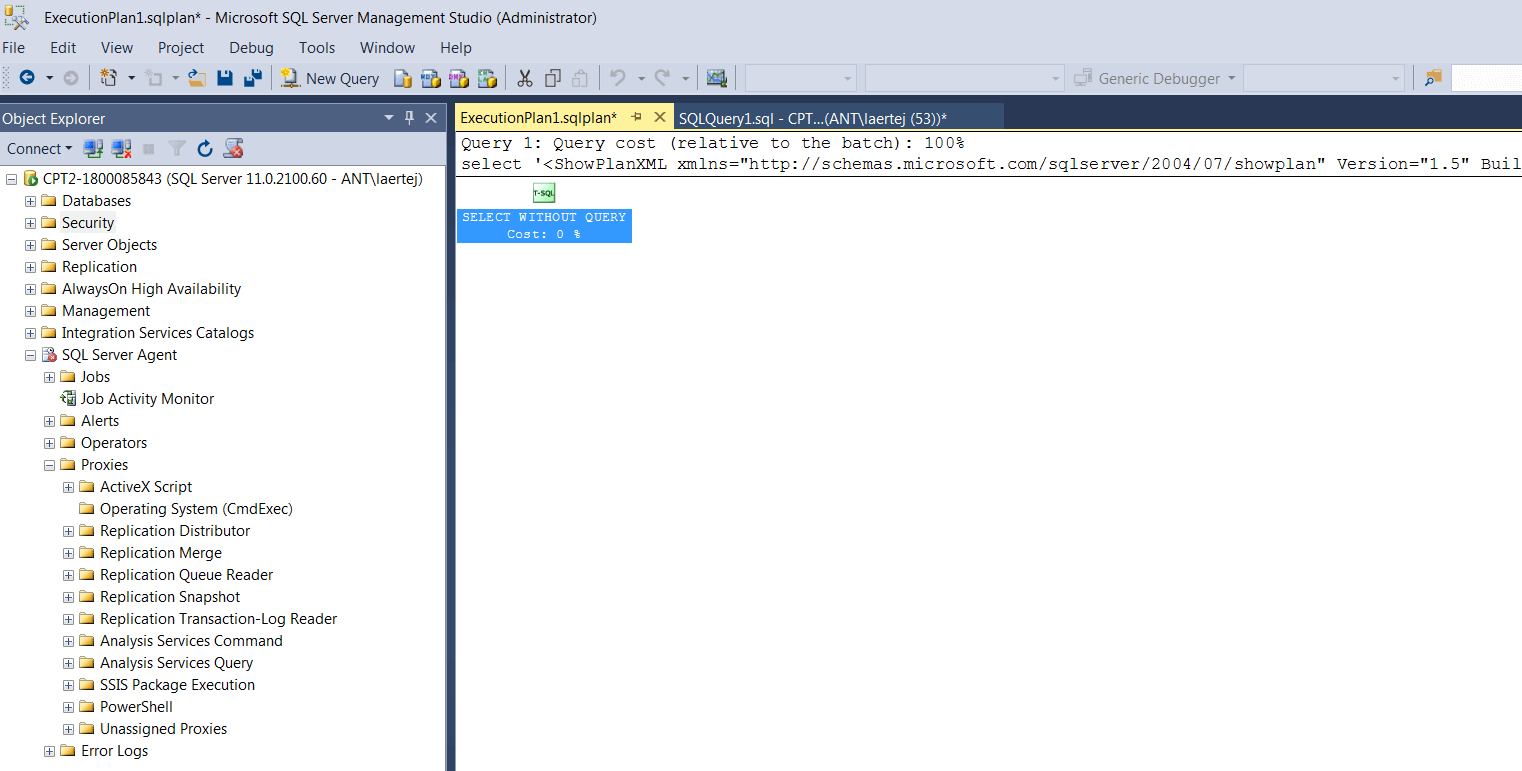
Run the Query – F5 or CRTL + E and you have the SQL Server plan from the query with problems.
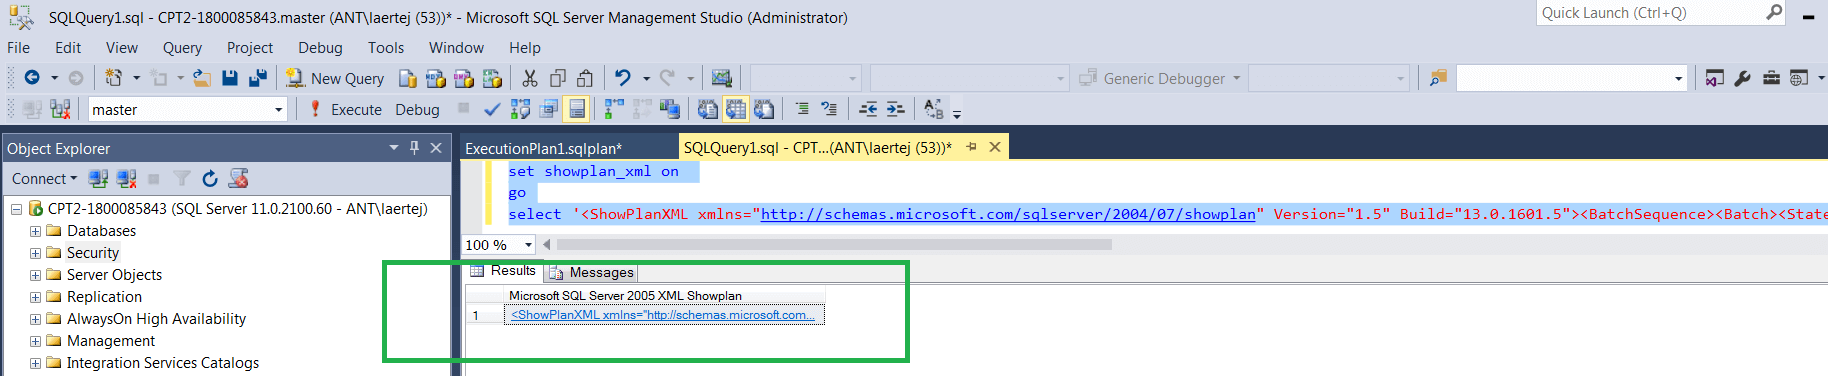
Click in the link generated (Green)
Also all the steps for each time the script ran are logged in a file called LOG.TXT in the same path.
The PowerShell script file is included with this article and it’s an optimised version of a script published in this article. Thanks to the author of SQLscope for the original script :
SQLScope – Identifying high CPU SQL Server threads
In the case of sp_whoisactive, its even easier. You just need to setup the WMI agent job that will call a script that runs the SP_Whosactive and output to a file something like :
|
1 2 3 4 |
$SQL = “ EXEC master..sp_whoisactive ……” $SQLReturn = Invoke-sqlcmd -ServerInstance $ComputerName -Database master -Query $SQL #-ErrorAction stop | Select ColumnIwantShow1, ColumnIwantShow2 | Export-csv -Path "$($PSScriptRoot)\ReportHighCpuQueries.csv" -Force -NoClobber -NoTypeInformation –Append |
Conclusion
The busy DBA wants precision in his alerts. Baselines and details are all very well, but it is too much irrelevant information. What is better is the DBA equivalent of CCTV or a dashcam that captures the moment when things go wrong and stores the data. The way we can do this is to configure SQL Agent to use WMI and specify our alerts in WQL. Doing this is like setting a trap for catching critters. We don’t want to have to sit there watching a mousetrap do we? It doesn’t matter what sporadic event we’re interested in because we just choose the best for the task. Then we can relax, pull on the headphones and the death metal music, and dream of Copacabana beach while WMI lies in wait to catch that elusive database problem.
If you like this article, you might also like How to find CPU intensive queries
This document contains proprietary information and is protected by copyright law.
Copyright © 2026 Red Gate Software Limited. All rights reserved


Load comments