
Introduction
This article describes a way of checking the health of any number of SQL Server instances and servers. It quickly collates server performance statistics and highlights potential problems such as missing indexes, untrusted foreign keys and database options that aren’t set to the default. Whether you are an accidental or deliberate DBA, this tool will either save you paying a consultant to run a health check for you or it will save you writing and executing all of the necessary scripts and formatting the report. This tool is open-source, on GitHub and is free for use. It.is rather different from SQLBlitz in that it is PowerShell-driven and does not attempt to be prescriptive. It is also designed to be easy for the user to customize.
To get started, all you need to do is to:
- Download and extract
HealthCheck.zipto the desired location (it is in a link at the bottom of the article). - Open DBList.txt and replace server and database names as required. Alternatively, execute the PowerShell script passing the name of the server and the database as parameters and skip the third step.
For example:./HealthCheck.ps1 Server1\InstanceA DB1 - Execute HealthCheck.bat.
The report can be found in the\HealthCheck\Reports directory.
The Report
The report contains one worksheet for each of the T-SQL scripts. I have included what I think is most important when evaluating a SQL Server from a performance perspective.
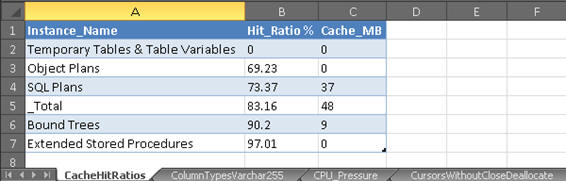
- CacheHitRatios
- shows the hit ratios and sizes for each plan cache store. The closer the hit ratios are to 100%, the better. Lower values could indicate memory pressure or plan cache bloat.
- ColumnTypesVarchar255
- lists tables that have more than one column defined as varchar(255). These tables should be evaluated to see whether other data types would be more appropriate.
- CPU_Pressure
- Calculates signal waits and resource waits as a percentage of the overall wait time. As a guideline, signal waits should usually be below 20%. If you see values higher than this, try tuning the queries highlighted by the
MissingIndexesProcsByCPUreport. - CursorsWithoutCloseDeallocate
- lists objects with cursors that have not been closed or deallocated. Static cursors use the most memory and could therefore have the greatest impact if not closed correctly.
- DatabaseOptions
- returns database options that are enabled as well assome other information such as compatibility leveland recovery model.
- DataTypes_Deprecated
- lists tables with columns that use deprecated types text, ntext and image. These should be replaced by the new types
(n)varchar(max)andvarbinary(max)to avoid your code breaking after upgrading SQL Server. - FillFactor
- lists indexes with fill factors of less than 90. You may want to review these and decided if space is being wasted.
- ForeignKeysUntrusted
- lists untrusted foreign keys.These constraints will not be considered by the query optimizer. See http://sqlblog.com/blogs/hugo_kornelis/archive/2007/03/29/can-you-trust-your-constraints.aspx for more details.
- HeapsNoIndexes
- lists tables that have no indexes. It is usually a good idea to have at least a clustered index on a table.
- HeapsWithNCIndex
- lists tables that have a non-clustered index but do not have a clustered index. There are exceptions where this might be acceptable. See the following article for more information: https://msdn.microsoft.com/en-GB/library/hh213609.aspx
- HypotheticalIndexes
- lists hypothetical indexes. They are usually created by the Database Tuning Advisor but can also be created using T-SQL. It is best to ensure these are removed to avoid clutter. Also, there have been bugs related to these such as the following: http://blogs.msdn.com/b/sqlserverfaq/archive/2009/06/25/exception-when-selecting-from-sysindexes-in-sql-server-2005.aspx
- IndexesIgnoreDupKey
- lists tables with non-clustered indexes that have the
ignore_dup_keyoption enabled. This option harms performance of inserts and updates as describedin Craig Freedman’s article on MSDN:http://blogs.msdn.com/b/craigfr/archive/2008/01/30/maintaining-unique-indexes-with-ignore-dup-key.aspx - IndexesUnusedSizes
- lists tables that have unused indexes. Before removing indexes, remember that the index usage stats DMV is cleared upon a server restart.
- IndexKeysOver900Bytes
- lists indexes that have a maximum key width over 900 bytes which could result in error 1946 during an insert or update operation.
- IndexKeyWidth
- lists tables with wide cluster keys. These should be reviewed as cluster keys are also present in all non-clustered indexes and can therefore consume a lot of space, possibly unnecessarily.
- InMemoryTables (2014 only)
- lists In-Memory OLTP tables along with their memory usage.
- IO_Stats
- returns IO stall statistics for all databases with the target database listed first.
- LatchStats
- returns latch wait statistics. The latch stats DMV is also cleared upon a server restart.
- MemoryClerks
- lists top ten memory clerks and total memory usage.
- MissingIndexesÂ
- lists missing indexes for the target database with an estimated impact above 70 and index advantage above1,000.
- MissingIndexesForeignKeys
- lists unindexed columns referenced by foreign keys. Deletes on the referenced tables will result in scans on the parent tables. Evaluate whether indexes on the parent tables are required.
- MissingIndexesProcsByCPU (2008-2014 only)
- returns missing index information for the ten stored procedures that consume most CPU resource. Filtered on indexes with an impact above 70.
- MissingIndexesProcsByReads (2008-2014 only)
- as above but for the highest consumers of I/O.
- PlanCacheByType
- returns plan cache size broken down by type. Look out for a bloated ad hoc cache store, which is a common problem.
- ServerAudits
- lists active server audits. Watch out for any synchronous server audits, with a queue delay of 0. These can really hurt performance.
- ServerConfig
- returns non-default server configurations. Look out for a non-default fill factor. I prefer to leave this setting as the default of zero and assign each index its own fill factor, if required. Check that the “max degree of parallelism” has been set according to the official guidelines from Microsoft https://support.microsoft.com/en-gb/kb/2806535. A common oversight is to leave the maximum server memory as the default 2 TB. This is one setting where you will definitely want to have a non-default configuration.
- ServerInformation.ps1
- PowerShell script that returns information on the target server’s CPUs, BIOS, and memory, as well as SQL Server-specific details.
- ServerTraces
- lists active traces on the server. Beware of traces where is_rowset = 1 as this means somebody is running SQL Profiler against your server, which has a big overhead.
- sp_xml_removedocument
- lists objects that prepare XML documents but do not remove them. Microsoft recommends alwaysincluding this to avoid running out of memory.
- StatisticsDuplicates
- lists duplicate statistics with their sizes.This report uses the key_ordinal column to identify the first column of an index statistic due to the following bug\unexpected behavior with the stats_column_id: https://connect.microsoft.com/SQLServer/Feedback/Details/1163126
- TablesAnsiNulls
- lists tables created with
ANSI_NULLSoff. This setting is deprecated and should no longer be used. Also, various features in SQL Server will generate an error when this setting is off, such as indexed views and filtered indexes. - TablesManyIndexes
- lists tables with more than five indexesand an index count greater than half the column count. Having five indexes or more isn’t necessarily bad, it’s just a starting point for finding tables that possibly have an unnecessarily large amount of indexes. They can often be consolidated into fewer indexes, saving space and improving write latencies.
- TablesOver10GB
- lists tables larger than 10 GB. Good candidates for data compression, assuming you have SQL Server 2008 or a later version and the Enterprise edition.
- TablesWithMoreIndexesThanColumns
- lists tables that have more indexes than columns. Not usually a very good sign!
- UniqueIdentifierClusterKey
- lists tables that have a unique identifier as the first column of the clustered index. This is rarely a good idea, although there are exceptions to this such as latch contention on increasing keys. This MSDN article explains in more detail. http://blogs.msdn.com/b/sqlserverfaq/archive/2010/05/27/monotonically-increasing-clustered-index-keys-can-cause-latch-contention.aspx
- WaitStats
- Returns server wait statistics. These give a good indication as to where you should focus your performance tuning efforts.
I deliberately didn’t include missing indexes resulting from ad hoc queries in the report due to the slow performance of the sys.dm_exec_query_stats DMV on servers with a lot of memory. If you find that the DMV returns results quickly on your servers, feel free to add a script to report on this.
I also decided not to includeindex fragmentation statistics for the same reason.
The performance of the sys.dm_db_index_physical_stats DMV can be really slow with large tables. If you do want to include this information, there are plenty of ready-made scripts out there on the various SQL Server forums.
The scripts for the stored procedures missing index reports …
(MissingIndexesProcsByCPU.sql and MissingIndexesProcsByReads.sql)
…are not available for SQL Server 2005 instances as the sys.dm_exec_procedure_stats DMV was only introduced in SQL Server 2008.
How Does It Work?
The batch file reads a list of SQL Server instance and database names from a text file and passes them as parameter values to a PowerShell script, which it executes in a loop, once for each database (see the “Permissions Required” section below for security issues). The PowerShell script is intended to do a health check on a single instance, putting the result in an excel file of the same name as the instance. It does this health check by executing a set of diagnostic T-SQL and PowerShell scripts, exporting metadata to CSV files. Finally, a VBA Excel macro is executed from PowerShell to merge the CSV files into an Excel spreadsheet and then formats the report. I could have implemented this part in PowerShell too, but as I had written a formatting macro a few years ago, I decided to reuse it.
Software Required
The following software is required to run the health check:
- PowerShell version 2.0 or higher (comes with Windows 7 and Windows Server 2008 R2)
- Microsoft Excel 2007 or higher.
- SQLPS PowerShell module, which is installed with SQL Management Tools.
Permissions Required
A windows account must be used with the following access to the target server and database:
Server Scope
- View Server State
Database Scope
- View Definition in target database.
- ddl_admin to run DBCC SHOW_STATISTICS if the target server is pre-SQL 2012 SP1, otherwise db_datareader is enough.
- Remote WMI access is required to run the ServerInformation.ps1 script. The following article has details on how to grant this access to non-admin users.
http://www.adilhindistan.com/2013/10/permissions-to-access-wmi-remotely.html
If the user does not have the necessary access, the report will still run but will not include the server information worksheet.
Customising the report
You can adjust the report by deleting or adding scripts, or by changing them as you would any other T-SQL.
- To expand the range of the health check to meet your requirements simply add the T-SQL scripts that you need to the relevant scripts directory and they will be automatically executed the next time you run the health check. A corresponding worksheet will be added to the Excel report.
- Similarly, to remove a worksheet, you just need to remove the unwanted T-SQL script from its directory or, if it’s a temporary change, rename the extension to something like “old”.
- You can add or remove a column in an existing script and this will be reflected in the final report too.
The scripts are maintained at four different levels of compatibility, so you should repeat these operations for each directory, Scripts_2005, Scripts_2008, Scripts_2012 & Scripts_2014.
The Code
HealthCheck.zip contains the following five files:
HealthCheck.ps1 – This PowerShell script controls the flow of the program.
After initializing some variables the script determines the SQL Server version and database compatibility level (see Listing 1 below). Each major version has a directory with its own scripts, from SQL Server 2005 to SQL Server 2014.
|
1 2 3 4 5 6 7 8 9 10 11 12 |
#Get SQL Server version and compatibility level of target database. [int]$compLevel=invoke-sqlcmd-ServerInstance$args[0]-Query"SELECT compatibility_level FROM sys.databases WHERE name = '$DatabaseName';"|%{'{0}'-f$_[0]} [int]$ver=invoke-sqlcmd-ServerInstance$args[0]-Query"SELECT REPLACE(LEFT(CONVERT(varchar, SERVERPROPERTY ('ProductVersion')),2), '.', '');"|%{'{0}'-f$_[0]} #Set folder path depending upon SQL version. if ($ver-eq 9) {$FolderPath="$dir\Scripts_2005\"} elseif ($ver-eq 10) {$FolderPath="$dir\Scripts_2008\"} elseif ($ver-eq 11) {$FolderPath="$dir\Scripts_2012\"} elseif ($ver-eq 12) {$FolderPath="$dir\Scripts_2014\"} |
Listing 1
Next, another PowerShell script is run to gather information on the target server before executing the SQL scripts from the relevant directory (see Listing 2 below). The output is temporarily stored in CSV files in the \Reports\Temp directory.
|
1 2 3 4 5 6 7 8 9 10 11 12 13 |
powershell.exe-file"$FolderPath\ServerInformation.ps1"$args[0],$dir #Loop through the .sql files and run them. foreach ($filenamein$files|sort-object) { $i++ $outfile="$dir\Reports\Temp\"+$filename.Name.Replace(".sql","") +".csv" invoke-sqlcmd-ServerInstance$args[0]-Database$args[1]-InputFile$filename.Fullname |Export-Csv-Path$outfile-NoTypeInformation Write-Progress-activity"Exporting $filename to CSV. File $i/$count."-status"Completed: "-PercentComplete (($i/$count)*100) } |
Listing 2
Databases which have compatibility level 80 (SQL Server 2000) will not be compatible with all of the scripts due to the presence of T-SQL operators such as APPLY and UNPIVOT. The affected scripts are, therefore, stored in a subdirectory called “80” and are executed in the context of the master database as shown in Listing 3.
|
1 2 3 4 5 6 7 8 9 10 11 |
#For SQL 2005/2008 compatibility 80 databases, run scripts that use CROSS APPLY or UNPIVOT against the master database. if ($ver-eq 9-OR$ver-eq 10 ) {$FolderPath="$FolderPath\80\" $files=get-childitem-path$FolderPath-filter"*.sql" foreach ($filenamein$files|sort-object) { $outfile="$dir\Reports\Temp\"+$filename.Name.Replace(".sql","") +".csv" invoke-sqlcmd-ServerInstance$args[0]-Database"master"-InputFile$filename.Fullname -Variable"DB='${DatabaseName}'"|Export-Csv-Path$outfile-NoTypeInformation } } |
Listing 3
Finally, the CSV files are imported into an Excel spreadsheet using a VBA macro, which is stored in \Reports\Master.xlsm.
|
1 2 3 4 5 6 7 8 9 10 11 12 13 14 15 |
#Create report file. copy-item"$dir\Reports\Master.xlsm"-Destination$report-force #Open report file. $excel=new-object-comobjectexcel.application $excel.Visible=$False $workbook=$excel.workbooks.open($report) $worksheet=$workbook.worksheets.item(1) #Run import macro. $excel.Run("loader") #Run formatting macro. $excel.Run("FormatWorksheets") |
Listing 4
Master.xlsm- This contains the VBA code that imports the CSV files and formats the report. It contains five subroutines:
Loader– contains a loop that calls the CSV import subroutine.ImportCSV– imports the CSV files and renames the worksheets.FormatWorkSheets– adjusts column widths and aligns the text.SelectAllMakeTable– formats the data as tables.SortWorksheets– sorts worksheets into alphabetical order.
HealthCheck.bat – This is the executable that creates the report. It loops through the list of servers and databases in DBlist.txt and passes these names as parameters to the PowerShell script.
DBList.txt – Put the names of the target servers and databases in this file. Use a semi-colon as a delimiter, for example:
- For servers that don’t have the SQL Browser service enabled, you can specify the port number delimited by a back tick and a comma, as follows:
Server1`,1433; DB1
ErrorLog.txt – The PowerShell script appends errors to this file.
Conclusion
I hope you find this tool useful in evaluating and troubleshooting the performance of your SQL Servers. I tried to create something that would quickly provide a detailed health check, while also being customizable. There are hundreds of more checks that you could include in the report but my work here is done: What I’ve done works for me. Now it’s your turn!
Note: The latest source to the SQL Healthcheck utility is on GitHub.
Load comments