
Introduction
There’s important information in the default trace, and after a while it gets deleted. If you need to look back over a time-period to investigate a problem, you’ve got to find a way of preserving it.
The default trace in SQL Server can help to diagnose a problem retrospectively because it logs the major events that happen, such as security audit , database and error events, along with database object changes . Not only does it provide information about the event, but it also identifies which database user made the changes. If you can find a way of preserving this information, then you can be certain of being able to find out what happened for certain.
What’s the Default Trace?
The Default Trace has been with the product since SQL Server 2005, but has now been deprecated and will be removed in a future version of Microsoft SQL Server . Extended events has superseded it in SQL Server 2012 with the default system_health extended event session. Having said that it is deprecated, I must add that it will continue to provide very valuable information for many years to come until the last servers running SQL Server 2005 and 2008 are upgraded . The newer system has a similar problem with making data persistent as does the default trace, but discussing any solution for this is beyond the scope of this article.
The default trace is a system-defined trace which consists of 5 files, each one of 20 MB which reside in the SQL Server directory. These files are used as a circular buffer that records a large number of events. Information in this circular buffer will be deleted after a while, since the oldest file is deleted on restart, or when the current file reaches 20Mb in size. In a busy OLTP system this could be a matter of minutes. There are quite a few events collected, and on a busy server the 5 files, 20 MB each, will be rolled over very fast. (Some maintenance tasks may fill up the trace files quickly.) In this article, we’ll go on to describe various ways of getting around this problem.
Where is it? Is it running?
By default, the trace is enabled. When the advanced option of sp_configure is set, it will list the option and whether it is enabled.
This is how you can check via script whether the default trace is running on a sql server instance:
|
1 2 3 4 5 6 7 8 9 10 |
EXEC sp_configure 'show advanced options', 1; Create table #Options (name Varchar(68), minimum int, maximum int, config_value int, run_value int) insert into #Options execute sp_configure Select case when exists (select * from #Options where name like 'default trace enabled' and run_value=1) then 'Enabled' else 'disabled' end |
Listing 1: TSQL batch to determine if the default trace is running
If it isn’t enabled, you can, if your userID has the necessary rights, start it running …
|
1 2 3 4 5 6 7 |
EXEC master.dbo.sp_configure 'allow updates', 1; EXEC master.dbo.sp_configure 'show advanced options', 1; EXEC master.dbo.sp_configure 'default trace enabled', 1; RECONFIGURE WITH OVERRIDE; EXEC master.dbo.sp_configure 'show advanced options', 0; EXEC master.dbo.sp_configure 'allow updates', 0; RECONFIGURE WITH OVERRIDE; |
Listing 2: TSQL Batch to start the default trace
What’s in the trace?
You can determine what is in the default trace by using this code
|
1 2 3 |
SELECT distinct e.name AS EventName FROM fn_trace_geteventinfo(1) evi JOIN sys.trace_events e ON evi.eventid = e.trace_event_id |
Listing 3: Expression to return the types of traces collected
Here is what is collected in the default trace, by category:
Database events
- Data file auto grow
- Data file auto shrink
- Database mirroring status change
- Log file auto grow
- Log file auto shrink
Errors and warnings
- Errorlog
- Hash warning
- Missing Column Statistics
- Missing Join Predicate
- Sort Warning
Full text events
- FT Crawl Aborted
- FT Crawl Started
- FT Crawl Stopped
Object events
- Object Altered
- Object Created
- Object Deleted
Security audit events
- Audit Add DB user event
- Audit Add login to server role event
- Audit Add Member to DB role event
- Audit Add Role event
- Audit Add login event
- Audit Backup/Restore event
- Audit Change Database owner
- Audit DBCC event
- Audit Database Grant, Deny, Revoke
- Audit Login Change Property event
- Audit Login Failed
- Audit Login GDR event
- Audit Schema Object GDR event
- Audit Schema Object Take Ownership
- Audit Server Starts and Stops
How do I read the default trace?
The default trace is a standard *.trc file which can be opened by SQL Profiler, or it can be queried by using the sys.fn_trace_gettable system function. We’ll show how later on in the article
Here is a script which can tell us the exact path of the Default Trace files:
|
1 2 3 |
SELECT REVERSE(SUBSTRING(REVERSE(path), CHARINDEX('\', REVERSE(path)), 256)) AS [DefaultTracePath] FROM sys.traces WHERE is_default = 1 |
Listing 4: SELECT statement that returns the exact path of the default trace files
Here is an example of a T-SQL script which queries the most recent file from the Default trace:
|
1 2 3 4 5 6 7 |
SELECT * FROM sys.fn_trace_gettable(CONVERT(VARCHAR(150), ( SELECT TOP 1 f.[value] FROM sys.fn_trace_getinfo(NULL) f WHERE f.property = 2 )), DEFAULT) T JOIN sys.trace_events TE ON T.EventClass = TE.trace_event_id |
Listing 5: Selecting the most recent default trace file as a table
Saving information for later use
What can we do to persist the default trace data and make it available for aggregations and analysis at a later time?
There are several options that come to mind:
- We could query the default trace files and save aggregated values
- We could get the definition of the default trace and create a collection set, which can be used with Management Data Warehouse, which is built in with SQL Server.
- We could get the definition of the default trace and create a remote trace from another server and save the data to a database table
- We could use a robocopy script to copy the trace files from our server to a different folder or a remote machine, which will leave the files on disk for longer time, giving us the possibility to analyze them
Let’s look at these options in more detail:
Querying the default trace files and save aggregated values
A while back I wrote an article on the default trace (The Default Trace in SQL Server -The Power of Performance and Security Auditing ), which was followed by a set of custom reports which show aggregations from the default trace directly from Management Studio (http://sqlconcept.com/tools/default-trace-audit-documentation-and-faq/ ).
In this case, however, the real challenge is to manage to save the aggregated values only once for prolonged period of time. We do not know exactly when the events will occur and when the trace files will roll over, hence it is not so easy to take meaningful aggregations at regular intervals.
Of course, we can always write a script which runs every N minutes and aggregates the data for the past N minutes.
For example, here is a script which may be scheduled to query the trace every 5 minutes and will give an aggregated result for the occurrences of sort warnings and hash warnings in the past 5 minutes:
|
1 2 3 4 5 6 7 8 9 10 11 12 13 14 15 16 17 18 19 20 21 22 |
SELECT TE.name AS [EventName] , V.subclass_name , T.DatabaseName , T.ApplicationName , COUNT(*) AS TotalCount FROM dbo.fn_trace_gettable(( SELECT REVERSE(SUBSTRING(REVERSE(path), CHARINDEX('\', REVERSE(path)), 256)) + 'log.trc' FROM sys.traces WHERE is_default = 1 ), DEFAULT) T JOIN sys.trace_events TE ON T.EventClass = TE.trace_event_id JOIN sys.trace_subclass_values V ON V.trace_event_id = TE.trace_event_id AND V.subclass_value = T.EventSubClass WHERE StartTime > DATEADD(mi,-5,GETDATE()) AND (TE.name = 'Hash Warning' OR TE.name = 'Sort Warnings') GROUP BY TE.name , V.subclass_name , T.DatabaseName , T.ApplicationName |
Listing 6 Selecting the number of sort and hash warnings in the past minute
It is worth noting that the script queries all 5 default trace files, since we do not know whether the last 5 minutes are contained only in the most recent file or in any number of them.
Querying all trace files in the same file may be ensured by passing the code in Listing 4 as a parameter providing the trace path to the dbo.fn_trace_gettable function:
Collection Set and Management Data Warehouse
Management Data Warehouse(MDW) is a part of SQL Server which provides the capability of performance auditing and saving the results directly in a relational database. The MDW provides the administrator with some built in collection sets and reports (Disk Usage, Query Statistics, Server Activity) and also with the ability to create custom user-defined collection sets.
Here are a few words on how to extract the definition of the Default trace.
As previously mentioned, we can find out the folder in which the default trace files are saved by running the following script given in Listing 4:
|
1 2 3 |
SELECT REVERSE(SUBSTRING(REVERSE(path), CHARINDEX('\', REVERSE(path)), 256)) FROM sys.traces WHERE is_default = 1 |
After navigating to the folder we can double-click one of the trace files and it will open in the SQL Trace.
From here, the usual steps would be to go to File > Export > Script Trace Definition… however we cannot go further because the options are grayed out.
We can avoid this by saving the Default trace definition as a template first: go to File > Save as > Trace Template. After the template is saved, we have to run it, stop it and then we can extract the definitions.
There are several options under Script Trace Definion: For SQL Server, or for SQL Trace Collection Set.
If we script it for SQL Server, then we will get a T-SQL script which can be run to start a remote server trace, and if we script it as a collection set, we will get code which we can use to define a collection set for use in MDW.
The problem with the user-defined collection sets, however, is that the user needs to create custom reports in order to consume the data from the custom collection sets. Purging the data has some issues, as well.
User-defined Remote Server default trace
As mentioned above, there is a way to script the definition of the default trace as a T-SQL script. The script can be used to run a server side trace and save the results to a file. The advantages of this method are that the user can define the location and the size of the files.
The disadvantage is that we cannot write the trace results directly to a SQL Server table, however we can import them at a later time by using a script similar to this:
|
1 |
SELECT * INTO trace_table FROM ::fn_trace_gettable('c:\my_trace.trc', default) |
Listing 7 Importing a trace file into SQL Server
This method is also great if we have several servers we would like to monitor and if we wanted to save the trace files to a UNC path so the performance of the servers is not affected.
Use Robocopy to pull out default trace files
Another way to save the default trace files before they are rolled over is to use robocopy. This is a great tool which nowadays is part of Windows servers and is used to monitor source and destination folders and synchronize them.
The idea in our case is that we do not know when the changes to the default trace files will occur and we would like to save the files to a remote folder before they are overwritten.
Robocopy is perfect for this, because it has a parameter which does exactly this: it waits for 1 minute and checks if more than N changes have occurred and if this is the case, then it copies the changed files.
We can use this to reliably save up to 100 files because the name of the trace file cycles through 100 different names log_xx.trc (where xx is a number between 00 and 99)
Here is how it works:
For this example I set up a destination folder called c:\Robocopy\Destination on my local disk. But I could also use a UNC for it, or any network folder. Just for making this example colorful, I will actually use the UNC for the local folder: \\myMachine\c$\Robocopy\Destination
Then I ran the script which I mentioned above to get the trace files location folder, which in my case is C:\Program Files\Microsoft SQL Server\MSSQL10_50.SQL2008\MSSQL\Log.
I am only interested in *.trc files, so I will make sure to filter them in my robocopy script.
Here is the actual robocopy script:
|
1 |
robocopy "C:\Program Files\Microsoft SQL Server\MSSQL10_50.SQL2008\MSSQL\Log" "\\myMachine \c$\Robocopy\Destination" *.trc /MON:1 |
Listing 8: Routine to set up Robocopy to check every minute and copy any changed file
The /MON:1 parameter instructs robocopy to monitor the source folder every minute and to introduce new and changed files to the destination folder if there are any.
Open command line and execute your robocopy script.
The command line result will look similar to this:

Figure 1: Executing Robocopy from the command line
Now you can simply attempt to login to your SQL Server instance with a nonexistent login, i.e. make sure you create a login failed event in the default trace.
Wait for a minute and look at the trace file (either by querying it, or by simply opening it with SQL Profiler) in the destination folder – it will have the failed login recorded.
The command prompt window will look similar to this:
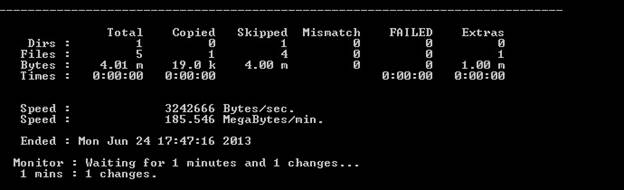
Figure 2: The status information from Robocopy
There is one small problem with this method – the robocopy in this case is not cleaning up the destination folder. However, we can do it ourselves after we have made sure that we have extracted whatever we need from the default trace data.
From here on, since we have the default trace files safe from overwriting, we can consume the data in several ways. We could use similar T-SQL to query and filter certain events:
|
1 2 3 4 5 6 7 8 9 10 11 12 13 14 15 16 17 18 19 20 |
DECLARE @traceFilesLocation VARCHAR(256) SET @traceFilesLocation = '\\myMachine\c$\Robocopy\Destination\' SELECT TE.name AS [EventName] , V.subclass_name , T.DatabaseName , T.ApplicationName , COUNT(*) AS TotalCount FROM dbo.fn_trace_gettable(( @traceFilesLocation + 'log.trc' ), DEFAULT) T JOIN sys.trace_events TE ON T.EventClass = TE.trace_event_id JOIN sys.trace_subclass_values V ON V.trace_event_id = TE.trace_event_id AND V.subclass_value = T.EventSubClass WHERE StartTime > DATEADD(hh, 24, GETDATE()) AND ( TE.name = 'Hash Warning' OR TE.name = 'Sort Warnings' ) GROUP BY TE.name , V.subclass_name , T.DatabaseName , T.ApplicationName |
Listing 9: scanning all archived files for aggregation of sort and hash warnings
Further, we could develop custom logic, for example by using SSIS, which will import the trace files into a SQL Server table (by using the dbo.fn_trace_gettable function) and then we can use T-SQL to query the imported rows in the table. By using this method we can ensure that historical default trace data is available at our fingertips and that we can aggregate and generate reports from the data in much more efficient way.
Conclusion:
In this article I provided several methods of retaining the data from the default trace in SQL Server, before it is overwritten and lost forever. This is a great way to retain data for security and performance auditing and to use it for alerting and notifications. By saving the default trace, it becomes possible to automate daily audit reports, or keep a reliable check on the database objects that are changed, and who by. By copying the files, the overhead of analyzing the trace data can be delegated to a reporting system, thereby freeing a production system of any extra burden.
Load comments