
Microsoft recently announced the ability to include Power BI reports inside Jupyter notebooks. After overcoming the dazzle of this exciting feature, what comes to my mind is: “Why do we need this?”
I’m far from being a Jupyter notebook expert, but as far as I know, they are used for interactive analysis. Why, in the middle of an interactive analysis, would I need to get a Power BI Report?
Even if the Power BI Report is not exactly what I need, I could continue the analysis in Power BI. Why should I move it to Jupyter and make this kind of integration with an existing report?
I decided to look for more opinions and asked this question on Twitter. This was the result:

The question has one “Love”, three retweets (it was not from my mom; she is still learning about Twitter). This probably means there are more people with the same question but no reply. Others have the same question, and no one has the answer yet.
The best way to discover what we can be done with it is to investigate the feature.
Choosing the tool
As I explained, I’m not a Jupyter expert. Where could I create a Jupyter notebook?
I chose to use Visual Studio Code to create the Jupyter notebook. Experts in Jupyter notebooks might use other tools, so I’m unsure if VS Code is the best tool to deal with data, but it works.
Once deciding to use Visual Studio Code, the Jupyter extension must be installed. It’s easy to find the Extensions on the left toolbar and check for Jupyter.

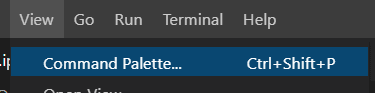
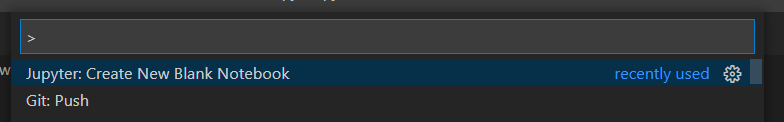
Once the extension is installed, you can use the Command Pallet to create a new empty Jupyter notebook:
This Jupyter extension in VS Code was released in April of this year and was demonstrated during the great Scott Hanselman keynote at Build. You can read more about the extension as well.
Installing the client
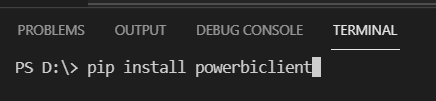
This feature is enabled by a new PyPI library called Power BI Client. It’s very easily installed using PIP, and the Visual Studio Code terminal supports PIP.
Navigate to View->Terminal or Terminal -> New Terminal in the VS Code menu to open the terminal and use PIP.
The Power BI Client is an open-source library. This is very helpful, because the source code provides a reference to use the Power BI api, and you could develop any feature missing from this library.
Building the notebook
Add a code block to the notebook. By adding the following code, you import the libraries used for this example. Here’s the code:
|
1 2 3 4 5 6 7 8 |
from powerbiclient import Report, models from powerbiclient.authentication import DeviceCodeLoginAuthentication import pandas as pd if sys.version_info[0] < 3: from StringIO import StringIO else: from io import StringIO import matplotlib.pyplot as plt |
Go ahead and execute the code block. The next action is to authenticate with Power BI. There are four authentication options, and all these options make me think this library can have many other uses than embed Power BI inside Jupyter notebooks.
Authentication options
Two of the four authentication options will require interactive actions by the user on the app, while the other two will not require any interactive action.
Interactive Flow: This one starts an interactive authentication process opening a browser window for authentication. Once the authentication is done, the notebook receives the authentication token back from the browser window.
Device Flow: This is the one to use for this example. It starts an interactive authentication process, but the process keeps no relation between the notebook and the browser window. In the notebook, it provides a link and a code. You need to access the link in any browser window you like, input the code, and authenticate. The website will provide the authentication token back to the notebook. Only after this process, the execution can continue.
Service Principal Flow: This authentication method is basically an App authentication, usually used by services and applications. An App is registered in Azure AD and generates a client_id and secret for the authentication of a client app.
Master User Flow: In this one, you have a username and password, and you will use them for the authentication.
The authentication code block
The import needed for the authentication was already included on the first code block, so this second one has only a single statement:
|
1 2 |
# Initiate device authentication device_auth = DeviceCodeLoginAuthentication() |
After the execution of this cell, you will see the URL and code needed for authentication:
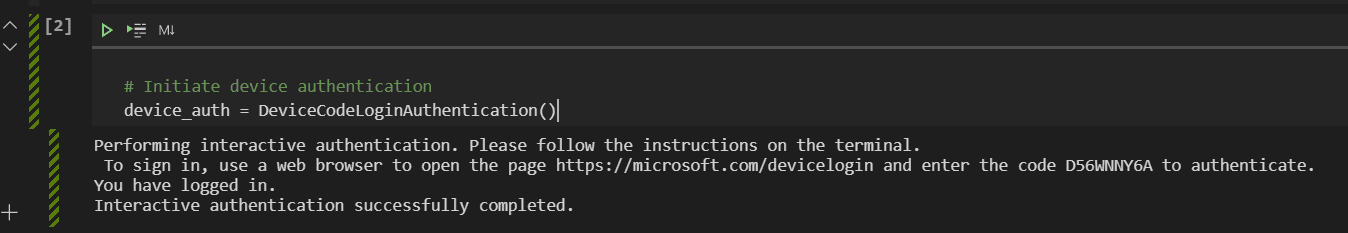
Open this URL on the browser, copy the code and complete authentication. Only after that will the execution continue.
Power BI object names
The next step is getting the report. This and the next few steps will need to use the name of the Power BI objects. The problem is that the name of the objects is not as apparent as one would expect and may be more difficult to find.
Let’s start with the workspace name and the report name, because we need to use both to retrieve the report.
Workspace name
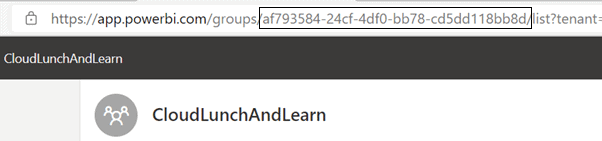
Navigate to Power BI online found at https://app.powerbi.com. Navigate to one of your workspaces. Once accessing the workspace, the name is the GUID in the URL. The workspace is also called “Group”. It’s important to keep this in mind this so you can recognize the code.
Report Name
In the same way as the workspace, the report’s GUID appears in the URL when launching a report.
![]()
Variables cell
Now create a cell to set these values in variables, so they can be used again whenever needed:
|
1 2 |
group_id="af793584-24cf-4df0-bb78-cd5dd118bb8d" report_id="c059c83d-41ee-4f11-9aaa-4c1ef8bdbf14" |
Embedding the report
After finding the name of the workspace and the report, our next code cell can already embed the report.
First, we recover the report object. Many methods are available over the report object, but if our objective is only to embed it, we can just let the object do the work:
|
1 2 |
report = Report(group_id=group_id, report_id=report_id, auth=device_auth) report |
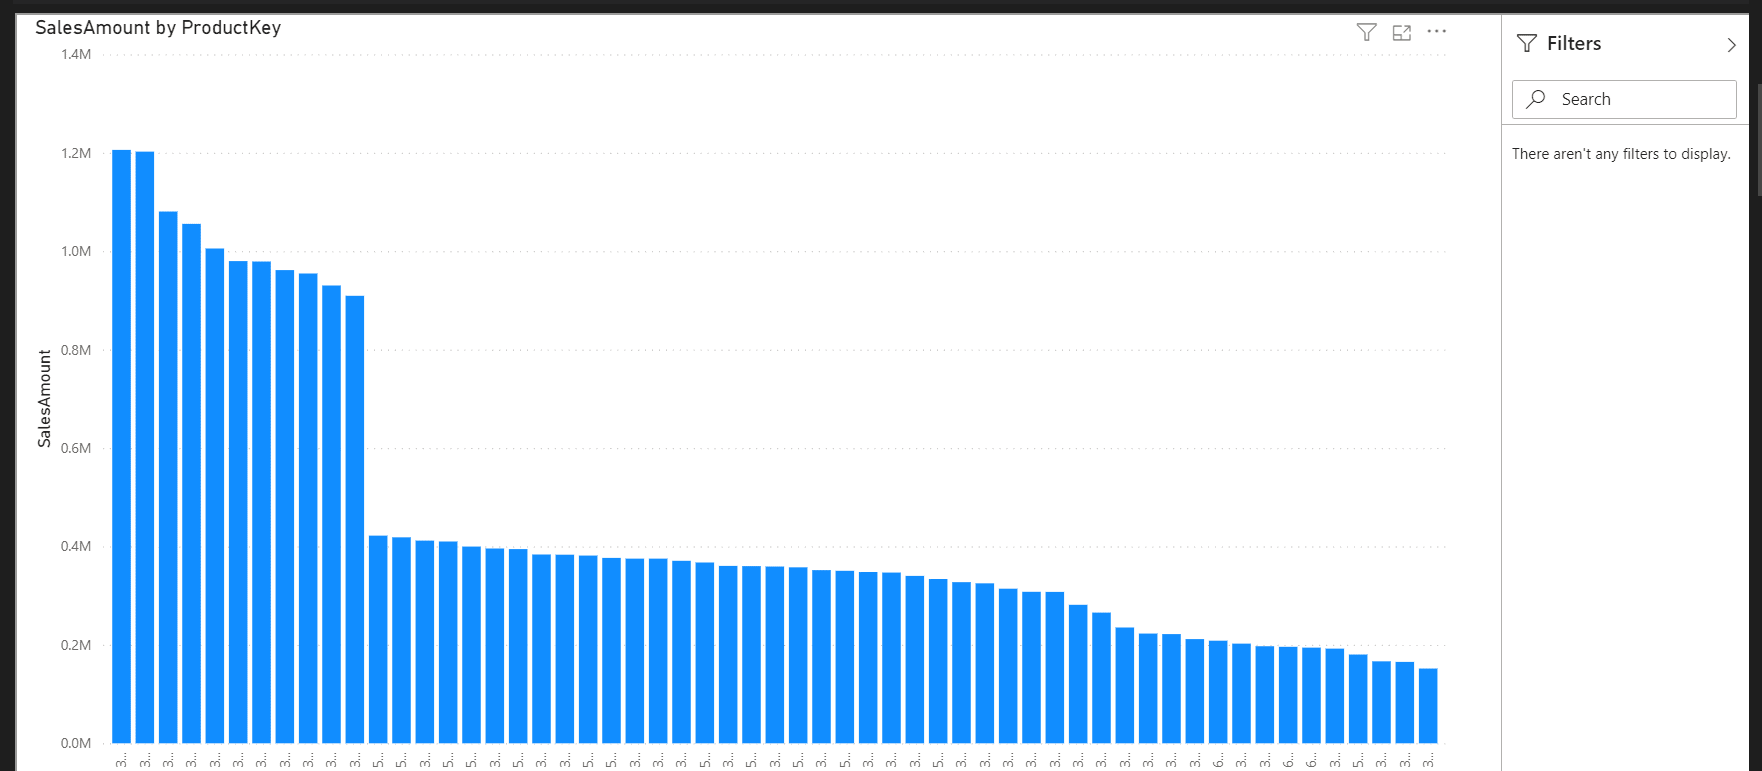
The image below is a very simple report embedded in a Jupyter notebook.
Beyond the report
The question remains: Why do you need a PBI report inside a Jupyter notebook?
If you can have access to the data, on the other hand, everything changes. You could retrieve the data from Power BI and do customized work with it, allowing Power BI analysts and Jupyter analysts to work on the same set of data. It would be way better to have direct access to a Power BI Dataset or Dataflow. However, what you can do with the Power BI Client is access the visuals and then get the underlying data from the visual as I’ll demonstrate in the subsequent sections.
If the purpose is to get the data, access a report, report page and visual to get the underlying data and be able to make further analysis with the data is a considerable work-around for this task. IMHO, I consider the word work-around very soft for these situations, that’s why we, Brazilians, are introducing into Europe the word “Gambiarra”.
Page and visual name
Once again, discovering the page and visual name can be a challenge. This time, it’s even a bigger challenge than before, because these two the names don’t appear in the URL.
To solve this problem, the Power BI Client enables retrieving this information from the list of pages of the report and list of visuals in a page.
Important: the methods to retrieve data from the report only work if the report is embedded on the page. The last statement from the previous code cell, executing the object Report to embed the Power BI report, was really needed. This is a limitation, and I will talk more about this later.
Pages list and page name
Begin with the list of pages in a report. A new code cell is needed for that. The methods for this task are available from the report object.
|
1 2 3 |
pages = report.get_pages() page_name=pages[0]["name"] pages |
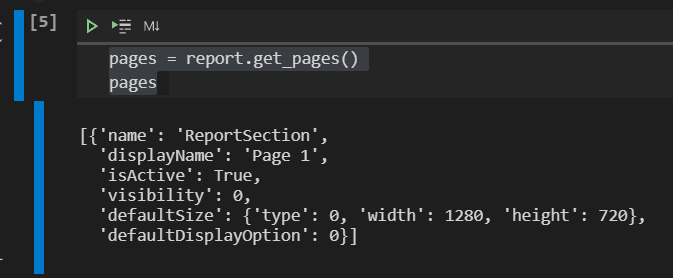
The first surprise is with the page: The name on the report is only the displayName. The real name of the page is something completely different, as you can see in the JSON returned.
The code defines a variable with the actual page name. The display of the page list is only for interactive view.
Visuals list and name
Now that you have the page name, you can retrieve the list of visuals in the page.
|
1 2 3 |
visuals = report.visuals_on_page(page_name) visual_name=visuals[0]["name"] visuals |
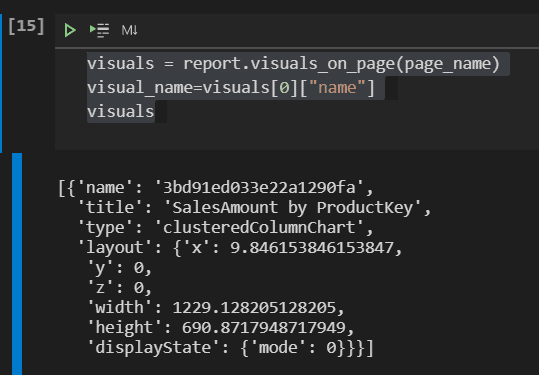
The name of the visual is even more unpredictable than the name of the page. Once again, the script defines a variable to contain the name of the visual
Finally, the data
Joining the report, page and visual, now you can retrieve the data and transform it into a Pandas dataframe.
The data returns as a big comma-separated string. The Read_CSV method requires a file or a buffer to transform a CSV in a dataframe. The STRINGIO method creates a buffer for a simple string, allowing conversion of the string to a dataframe.
The code cell will be this:
|
1 2 3 4 |
exported_data = report.export_visual_data(page_name, visual_name, rows=1000, export_data_type=models.ExportDataType.UNDERLYING.value) exported_data=StringIO(exported_data) df=pd.read_csv(exported_data,sep=",") display(df) |
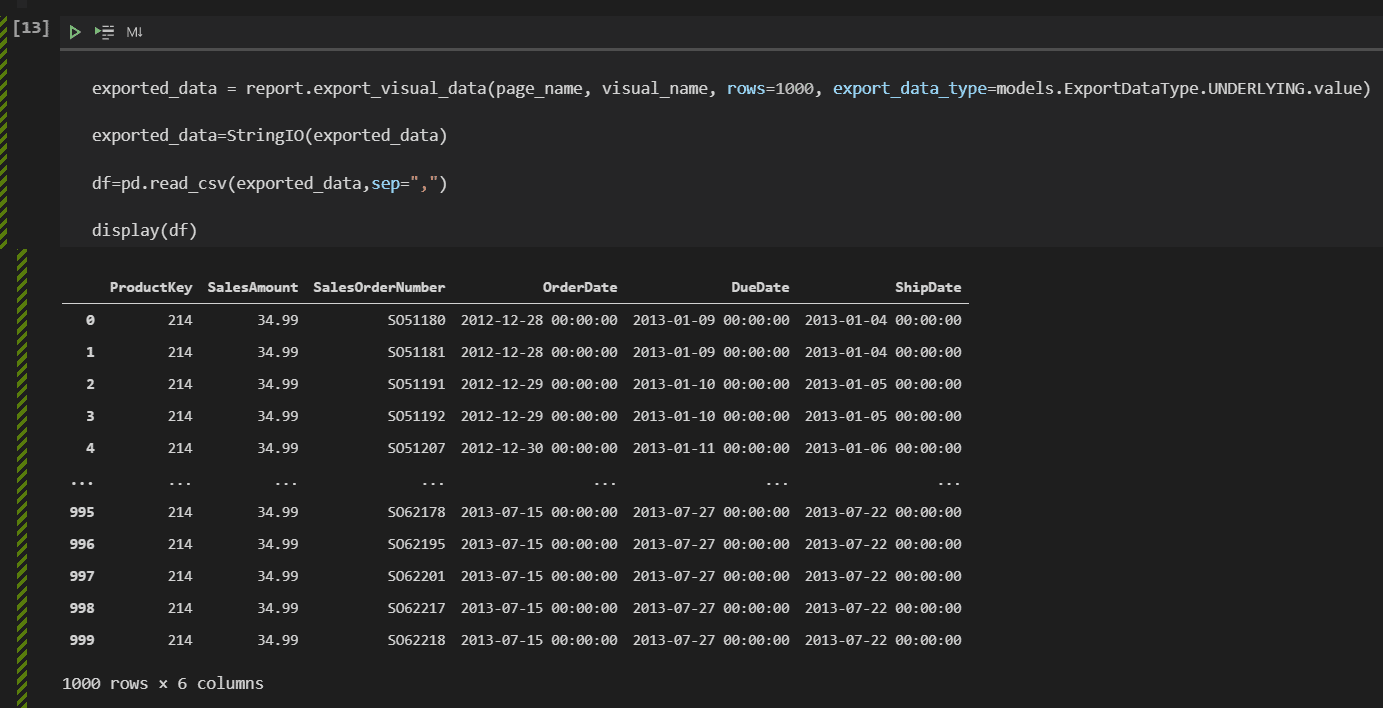
Besides the parameters we already know, there are two additional ones:
Rows
This parameter defines the number of rows to be recovered. That’s not good at all. The parameter is optional, but the default value is 10. This means we will need to know how many records there are in the underlying data, and that’s impossible.
Although it’s possible to recover the data and make transformations on the data, this parameter makes the feature very limited.
Export_Data_Type
This parameter supports two values:
ExportDataType.SUMMARIZED: Returns the data summarized by the visual according to the visual work.
ExportDataType.UNDERLYING: Returns the underlying data in relation to the visual.
Transforming the data
From this point and forward, you can transform the data using function on Python, Pandas or other libraries. I made some examples of these possible transformations:
|
1 2 3 4 5 |
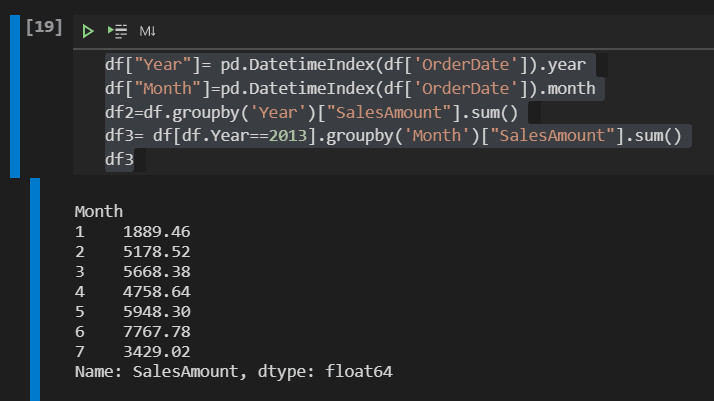
df["Year"]= pd.DatetimeIndex(df['OrderDate']).year df["Month"]=pd.DatetimeIndex(df['OrderDate']).month df2=df.groupby('Year')["SalesAmount"].sum() df3= df[df.Year==2013].groupby('Month')["SalesAmount"].sum() df3 |
This code cell makes two different transformations:
- Group the data by Year, totalizing the SalesAmount
- Filter the data by Year 2013, group by Month and totalize by SalesAmount
Two new columns were created in the dataframe, Year and Month, calculated from the OrderDate field.
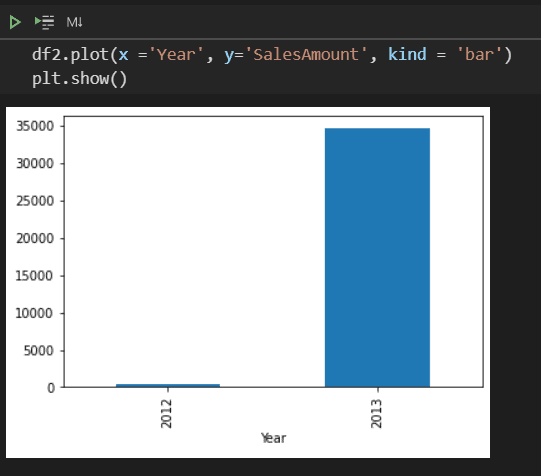
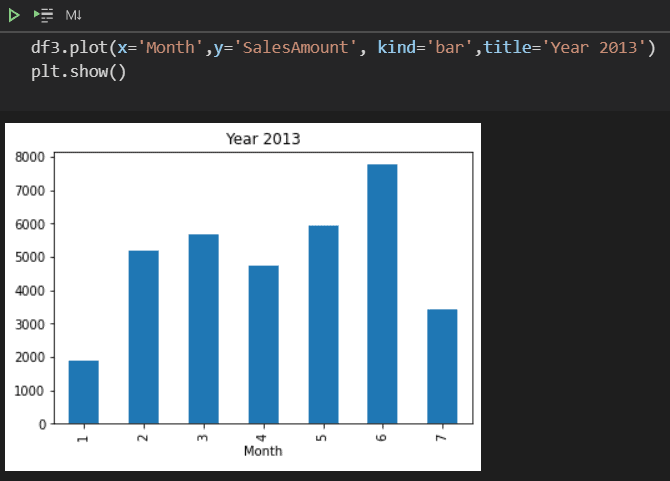
From these two new dataframes, you can plot new graphics to analyze the data.
What comes next?
The questions persist: Why do we need Power BI inside Jupyter notebooks? How should we use this? If you have additional ideas about how to use this feature, I woutld love to hear about it. Let’s talk; use the comment box on this blog.
Now it’s time to provide my guess. I made some correct guesses before; let’s see if it works now.
My guess
This feature was intended for other purposes. It’s being introduced in Jupyter notebooks because it’s easy, and it’s “pop”. However, we are struggling to understand how useful the feature is.
It would be great to have access to datasets and dataflows, creating teamwork between Jupyter analysts and Power BI analysts. However, even retrieving data from the reports is not enough to retrieve the data and make further analysis.
Let’s support these two guesses.
The features are not enough to analyze data
Retrieving the data from the report visuals instead of datasets or dataflows is a considerable work-around or gambiarra.
It’s not possible to retrieve the data without embedding the report. This means the analysis of data more limited.
The rows parameter makes any data analysis incomplete since you would need to guess the number of rows available.
Power BI Client has other purposes
- The tool can add or remove filters to the report
- The tool can manage bookmarks
- Register callbacks on the report events, allowing an interaction between the report interactivity and whatever is around the embedded report
In Summary: These features are the beginning of great interactivity between the embedded report and any application where the report is embedded. Would this tool be handy for the creation of embedded reports on other kinds of Python applications? Do you have any idea about this? Please, let’s talk more; use the comments to provide additional ideas.
Power BI in Jupyter Notebooks
The tool works, and it’s very interesting, but after the dazzle, the result is the question: How should we use this tool in real scenarios?
Besides that, the tool is open source. Could we adapt the tool to work the way we would like?
Reference Links
Feature Announcement: https://powerbi.microsoft.com/en-us/blog/announcing-power-bi-in-jupyter-notebooks/?WT.mc_id=DP-MVP-4014132
Github Documentation: https://github.com/microsoft/powerbi-jupyter/wiki#Export-the-data-of-a-given-visual-of-the-report
GitHub Open Code Repo: https://github.com/microsoft/powerbi-Jupyter
This document contains proprietary information and is protected by copyright law.
Copyright © 2026 Red Gate Software Limited. All rights reserved


Load comments