
There are many IT technologies available for storing data, but Excel remains the most popular data tool for users of IT in businesses. Excel is just so versatile, but the downside is that everything remains in your local machine. You can’t share the data, it doesn’t get backed up and it isn’t so secure. However, by using Power BI app too, you can view, analyze and share Excel files on the web.
In first section of article you will see, how to Publish an Excel file ‘as is’ to Power BI app, create a dashboard in Power BI and share components of an Excel file to other users. The second section will cover how to create a data model in Excel, export the Excel data model to Power BI and then create visualizations in the Power BI app. We will also explain how to analyze any Power BI dataset in Excel. In the final third section, we will cover the topic of how to import data from various data sources into Power BI.
Publish Excel file to Power BI, create dashboard in Power BI and share with others
In our daily work, many of us use Excel in one or other way. Once we finished doing our data massaging and creating visualization, we are ready to share the file with others. Very often, people will share an Excel workbook with others by attaching the Excel file in an email and sending an email to several people. Later on, if they find any problem with the Excel file or if they have done some enhancements to it, they have to send it again. This is a bad idea because the Excel file may contain a large amount of data which will clog the network and the recipients are likely to use the wrong version. We need a better way to share Excel file.
In Power BI, we can view the Excel file as is, we can select Excel chart and share selected Excel chart with others. Once you publish Excel file to Power BI, it is easy to reflect any changes in the original file to the publication in Power BI.
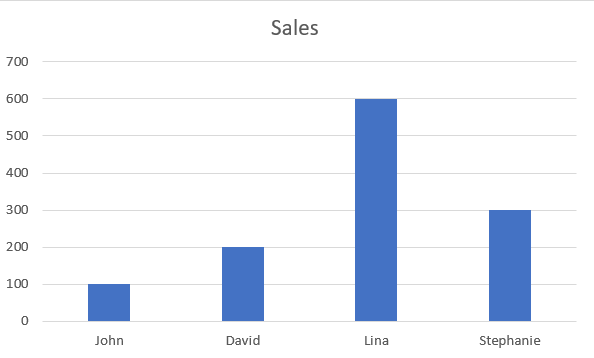
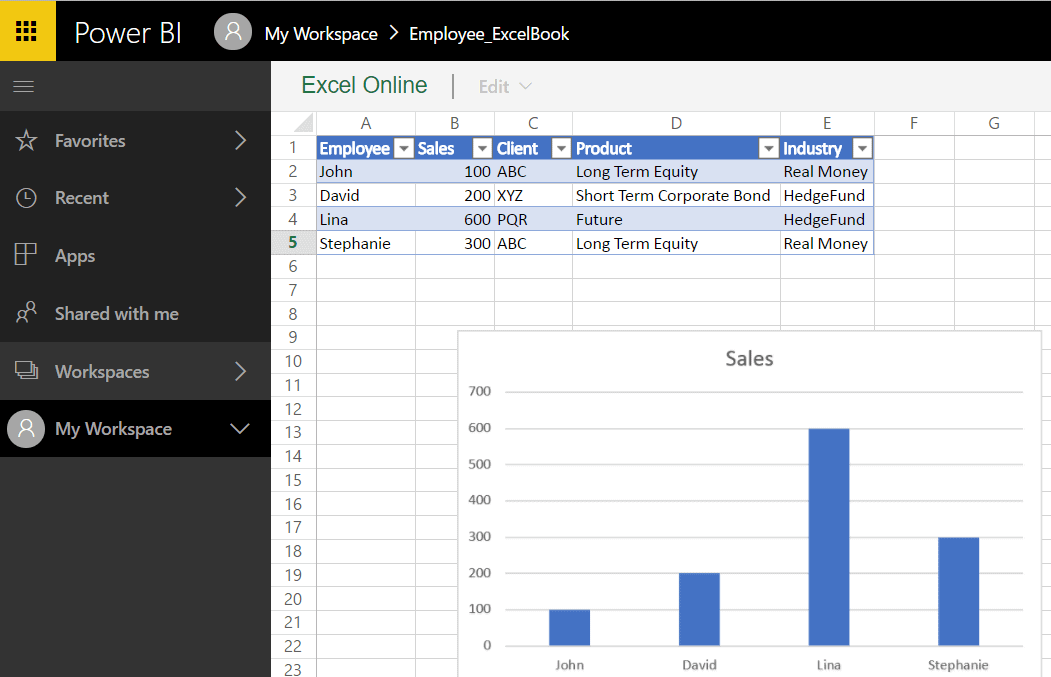
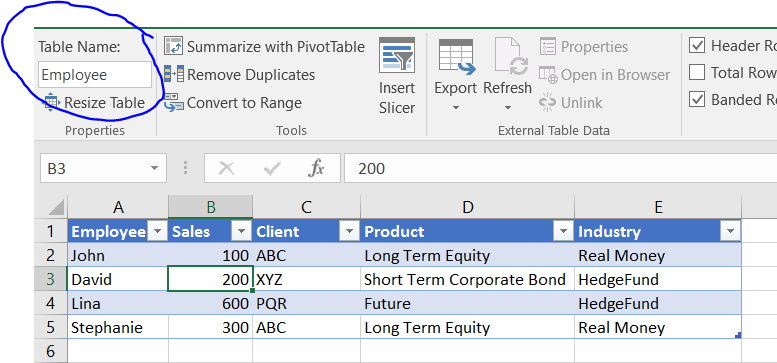
First, let’s publish an Excel file to Power BI. Open Excel and copy the data in the table into Excel. In Excel, select the data in the ‘Employee’ and ‘Sales’ fields, click on the ‘Insert’ tab and select ‘bar’ chart. Now in the Excel file, we have some data and a bar chart. Our Excel file is ready to save and publish.
|
Employee |
Sales |
Client |
Product |
Industry |
|
John |
100 |
ABC |
Long Term Equity |
Real Money |
|
David |
200 |
XYZ |
Short Term Corporate Bond |
HedgeFund |
|
Lina |
600 |
PQR |
Future |
HedgeFund |
|
Stephanie |
300 |
ABC |
Long Term Equity |
Real Money |
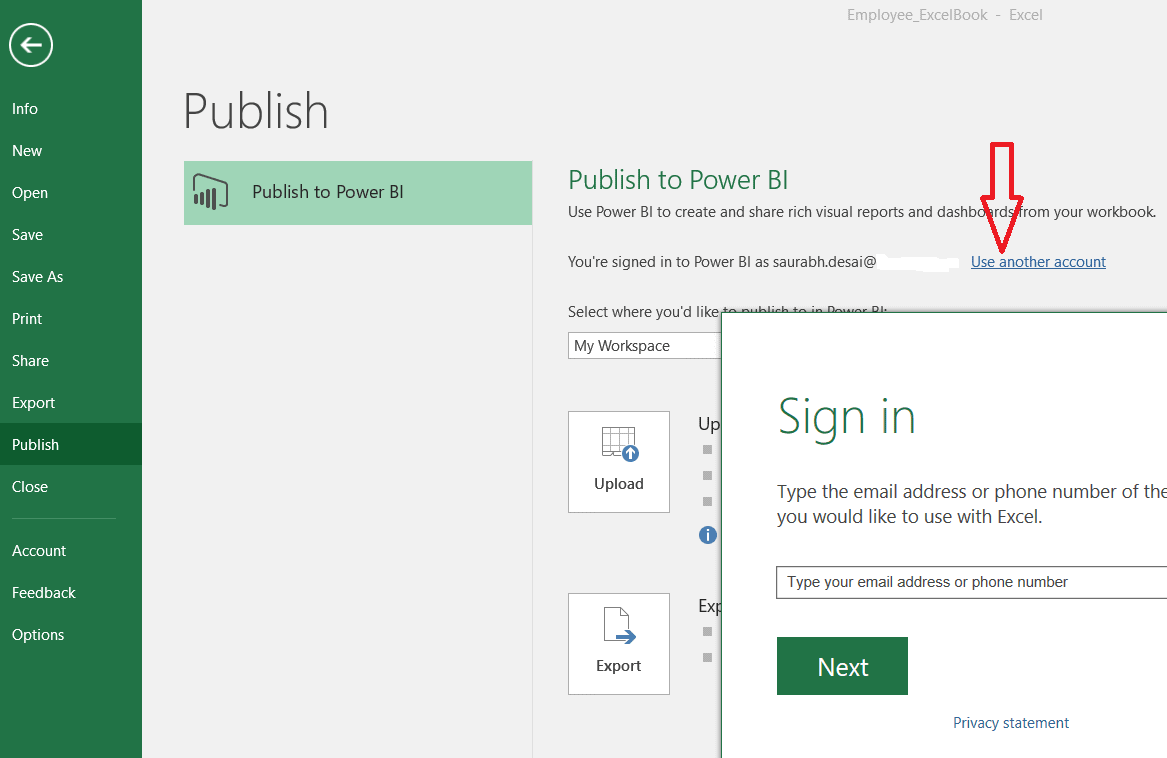
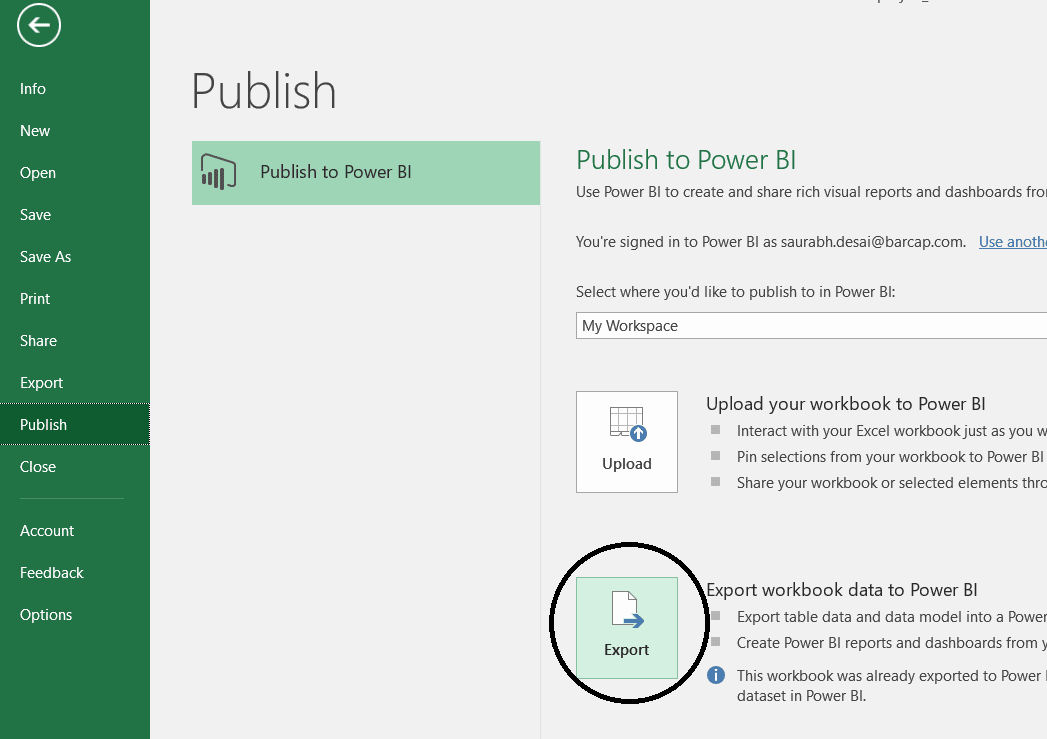
Save Excel file as ‘employee_Excelbook.xlsx’. Click on the ‘File’ menu and click ‘Publish’. To publish Excel file in Power BI, you need to ‘sign in’ using Power BI app account. You can use your ‘Office 365’ account or you can switch to another account.
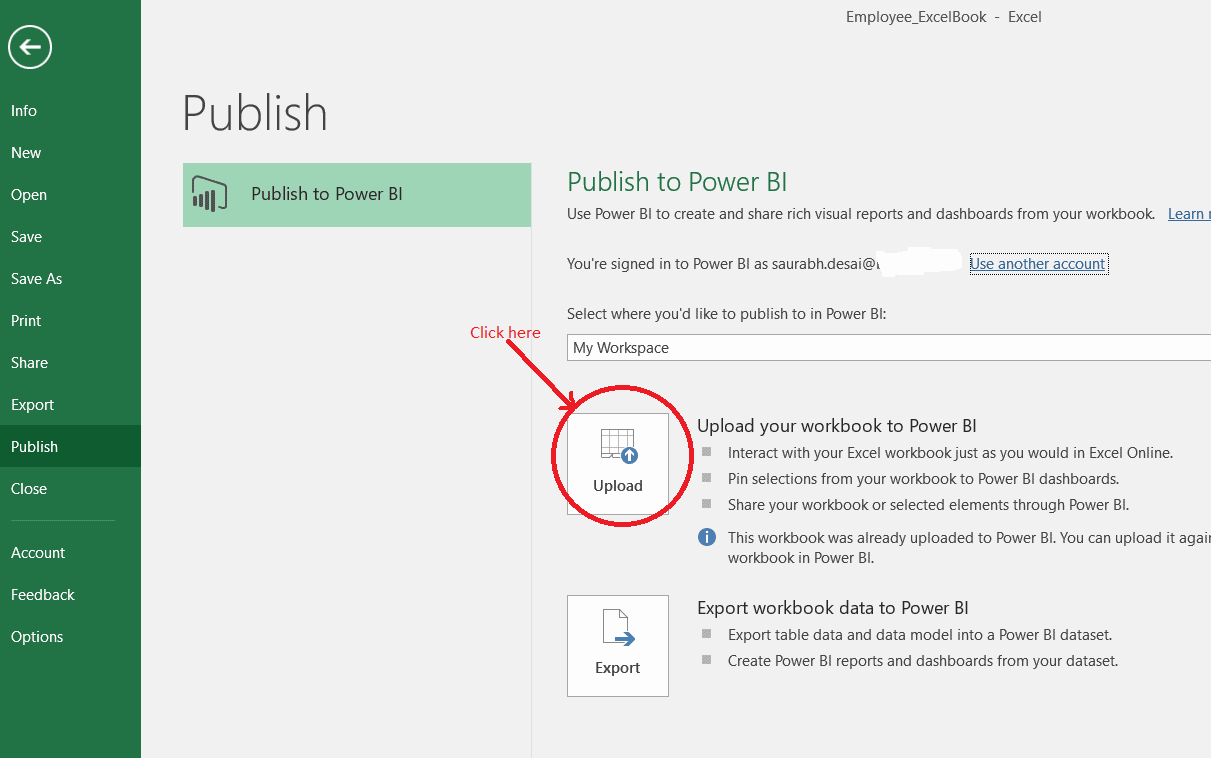
Once you sign in using your Power BI account, you can select the option ‘Upload your workbook to Power BI’. This ‘Upload your workbook to Power BI’ option is intended for publishing an Excel file in Power BI.
Once file is published, you will see the message ‘PUBLISH TO POWER BI Workbook uploaded successfully’’. Open ‘app.powerbi.com’ and sign in with your Power BI account. In ‘My Workspace’, you will see different tabs.
In Power BI, under ‘My Workspace’, there are 4 tabs.
- ‘Datasets’: When you are publishing Excel file to Power BI, if you choose ‘Export workBook data to Power BI’ option, only Excel data will publish to Power BI. Excel data will appear in ‘Datasets’ section.
- ‘Reports’: From ‘Datasets’ section, you can select any dataset to create reports and report will appear in ‘Reports’ section.
- ‘Workbooks’: When you are publishing Excel file to Power BI, if you choose ‘Upload your workbook to Power BI’ option, ‘as is’ Excel file is uploaded to Power BI app. Excel file appear in ‘Worksbooks’ section.
- ‘Dashboards’: From ‘Reports’ and ‘workbooks’ section, you can ‘pin’ any data/chart to create a dashboard.
Since we have uploaded Excel file to Power BI, click on ‘workbooks’ tab in Power BI to see your uploaded Excel file.
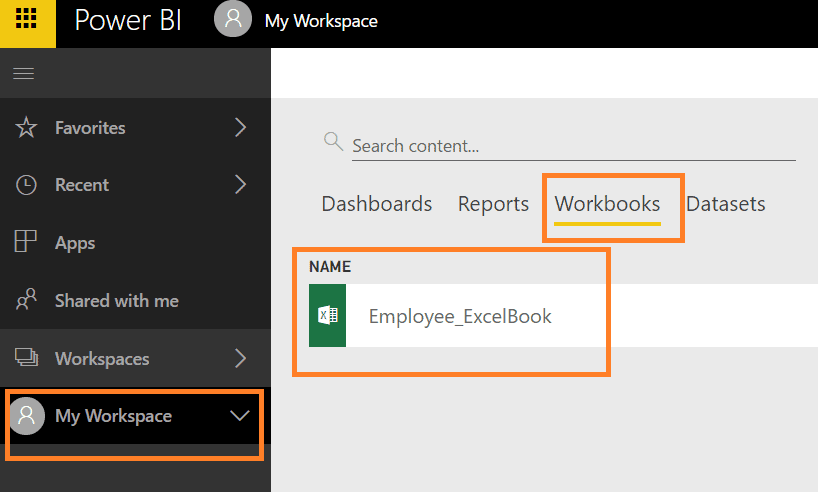
Click on ‘Employee_ExcelBook’ file to view the Excel workbook in the Power BI app. In Power BI, you can see the Excel file as-is.
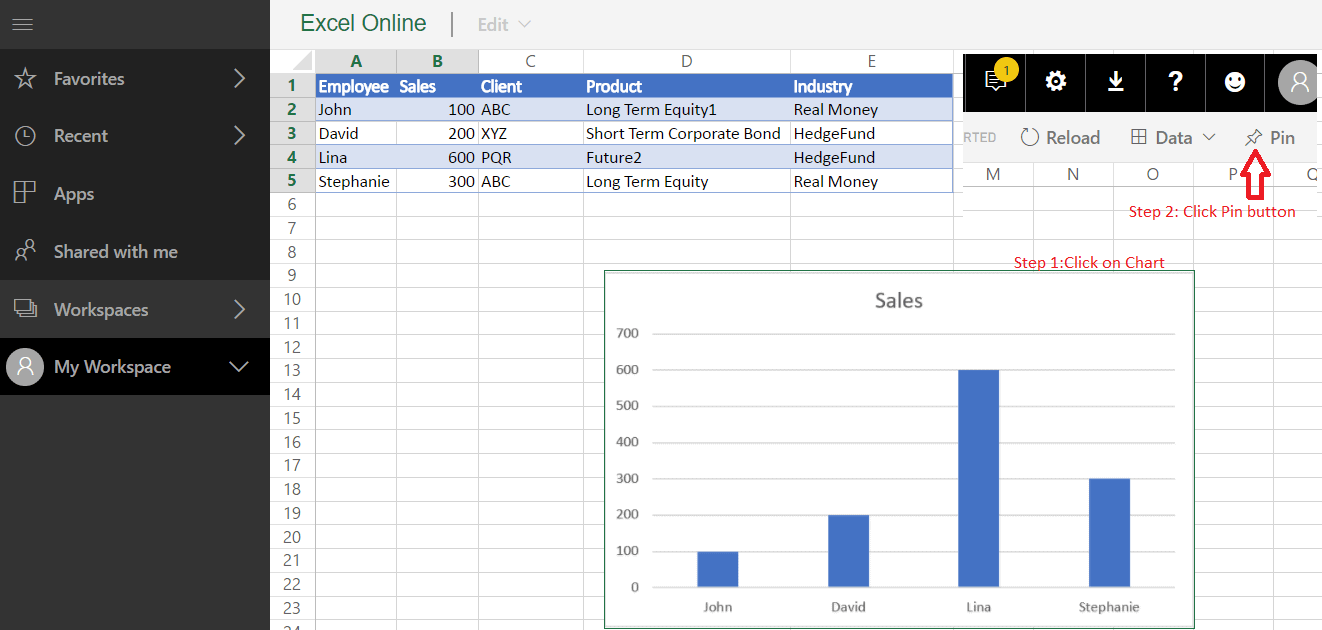
Now, we will create a dashboard from the ‘Employee_ExcelBook’ workbook. As shown below, select the Excel chart and click ‘pin’.
Once you click ‘pin’, you will see a new prompt to select dashboard. Select the ‘new dashboard‘ option, assign the name ’EmployeeDashboard’ and click ‘ok’. A new dashboard called ’EmployeeDashboard’ will appear under ‘My workspaceDashboard’
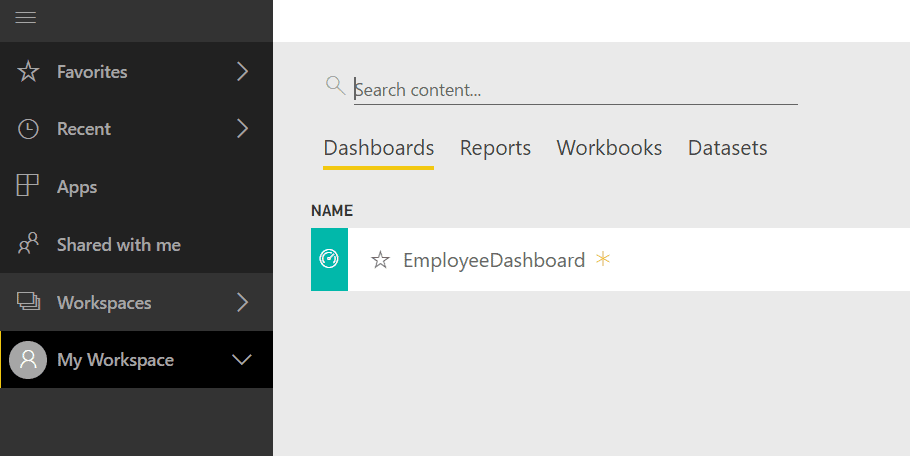
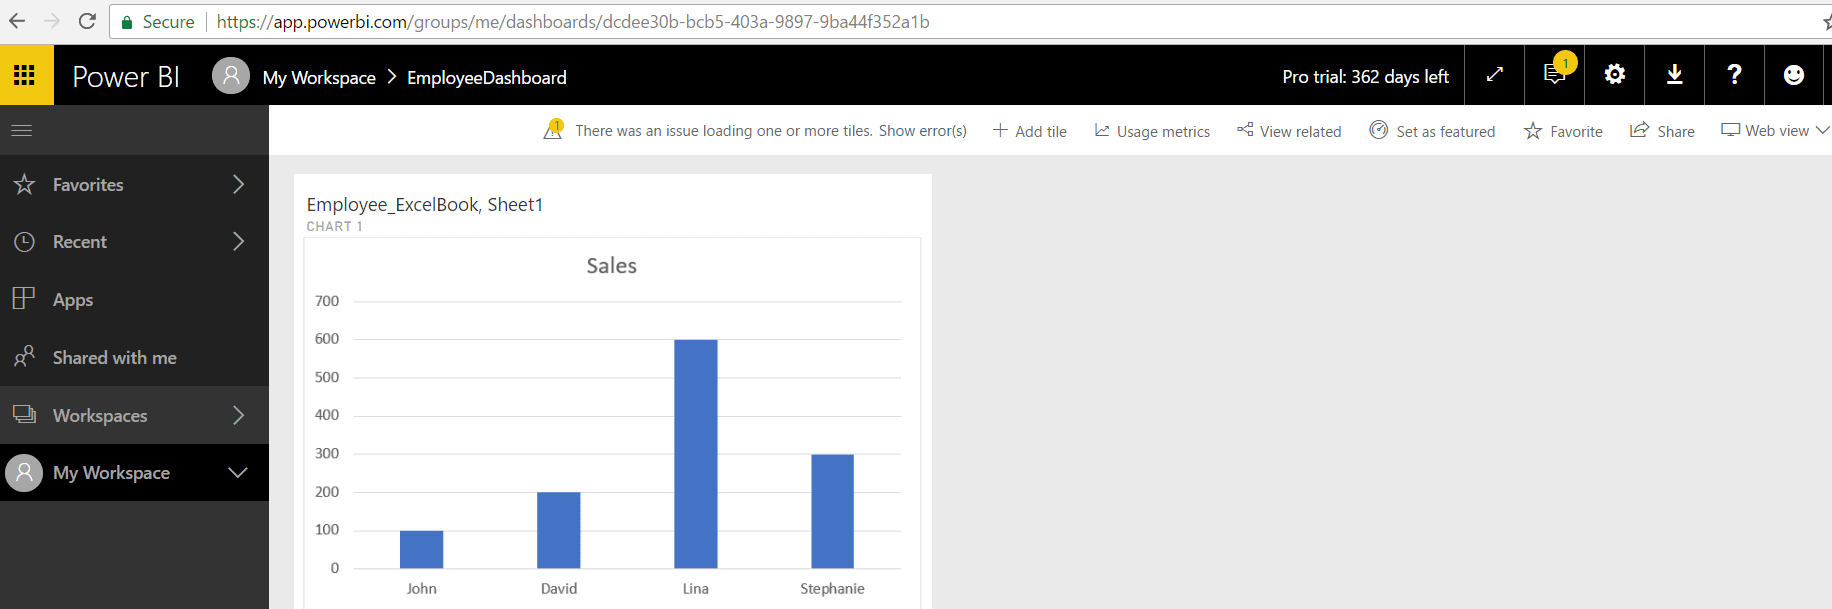
Click on ‘EmployeeDashboard’ to view the dashboard in Power BI. You can see the ‘sales by employee’ chart in dashboard.
In this step, we have ‘pinned’ a chart and creatd a Power BI dashboard. You can create a Power BI dashboard from Excel without going to Power BI. To create a Power BI dashboard from Excel, download the ‘Power BI publisher for Excel’ plugin. Once the ‘Power BI publisher for Excel’ plugin is installed, you will see the ‘Power BI’ ribbon in Excel.
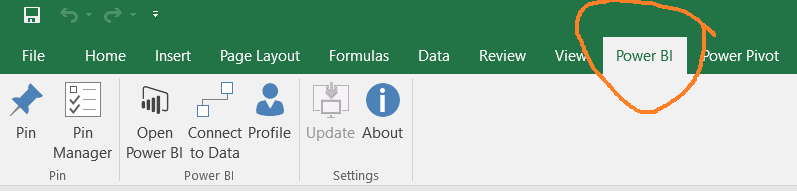
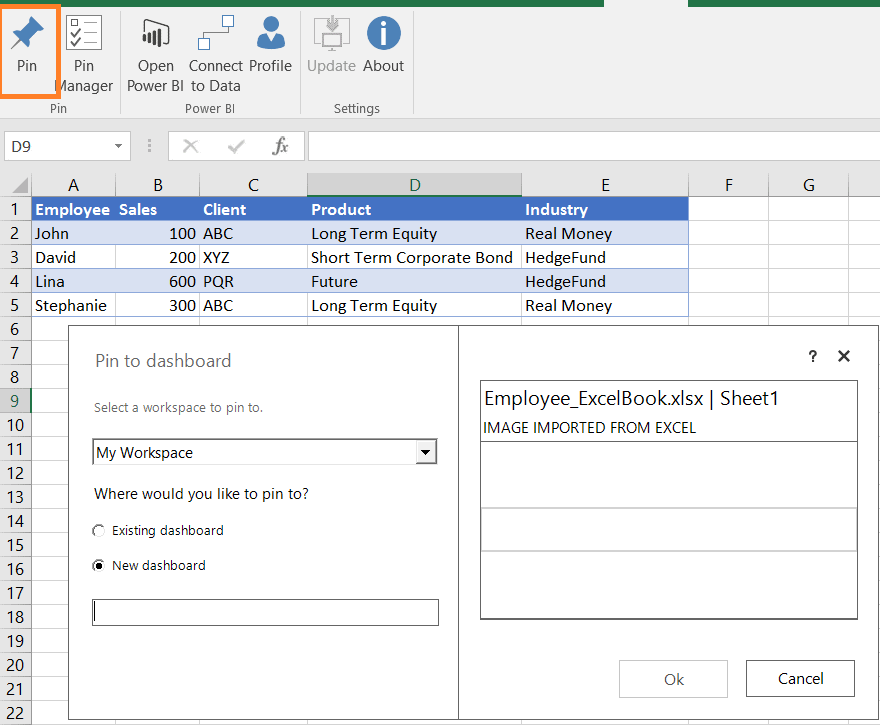
To create a Power BI dashboard, select ‘chart /data range’ and click ‘pin’. If you are already signed in using your Power BI account, you will be prompted to select a dashboard. Choose either the ‘Existing dashboard’ or ‘New dashboard’ option, assign a dashboard name and click ‘ok’. Now your Power BI dashboard is created.
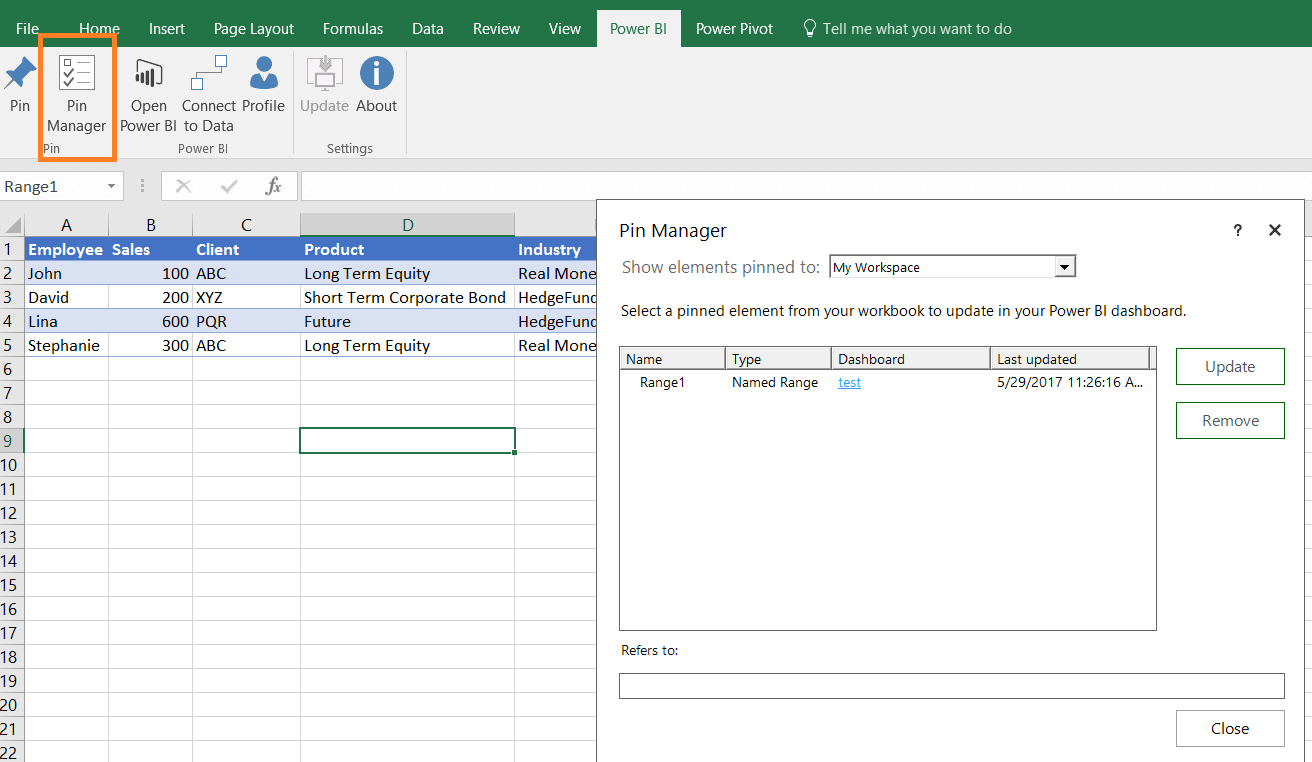
Once you ‘pin’ an element and create a Power BI dashboard, you can manage the pinned element using ‘pin manager’ in Excel. Click on ‘Pin Manager’ and you will see an update option to change the data range, and a remove option to ’remove object mapping’ between Excel and Power BI. This remove option does not delete the chart from Power BI but any further changes in the chart will no longer be reflected in Power BI. To delete a data object from the Power BI dashboard, you would need to open ‘app.powerbi.com’ and delete the chart from there.
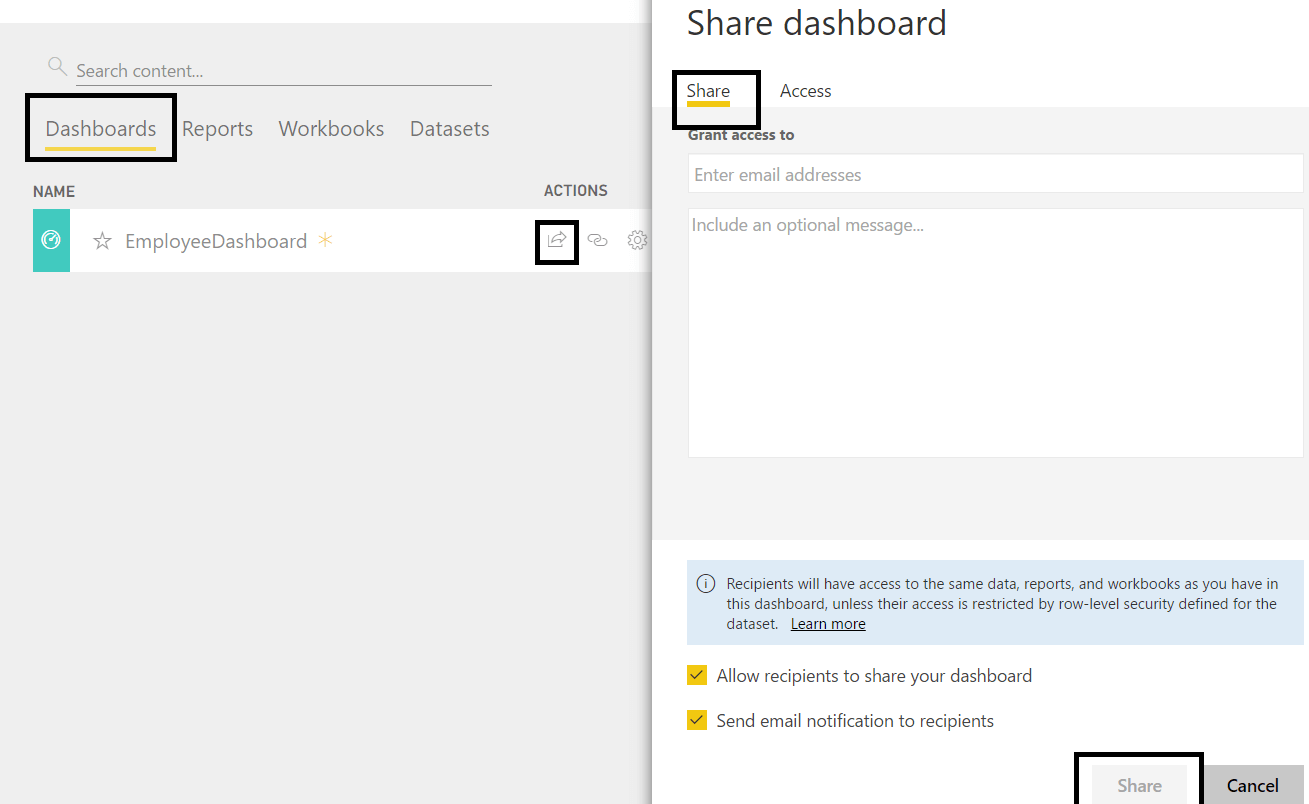
You have seen several ways to create a Power BI dashboard. Once the dashboard is created, you can share this dashboard with other users. To share the dashboard, you must go to app.powerbi.com. Open ‘app.powerbi.com’, go to ‘My WorkspaceDashboards actions’, click on ‘share’ and enter the email addresses of the people with whom you want to share the dashboard.
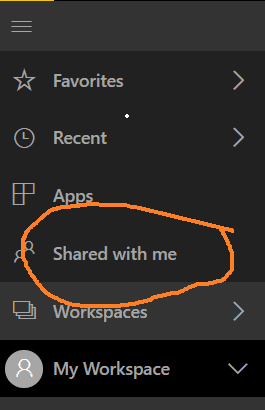
Users can access the shared dashboard by logging in to app.powerbi.com. On left-panel users can see a ‘shared with me’ option. Click on ‘shared with me’ to view the list of shared dashboards.
So far, we have published the Excel file, created a dashboard and shared this dashboard in Power BI. If you want to update published data, you can modify the Excel file locally and republish the Excel file with the same name to Power BI. Excel changes should be reflected automatically in Power BI dashboard as shown below.
In Excel, open the ‘employee_Excelbook.xlsx’ file, change the industry name ‘Long Term Equity’ to ‘Long Term Equity 1’, save and republish the Excel file to the Power BI app.
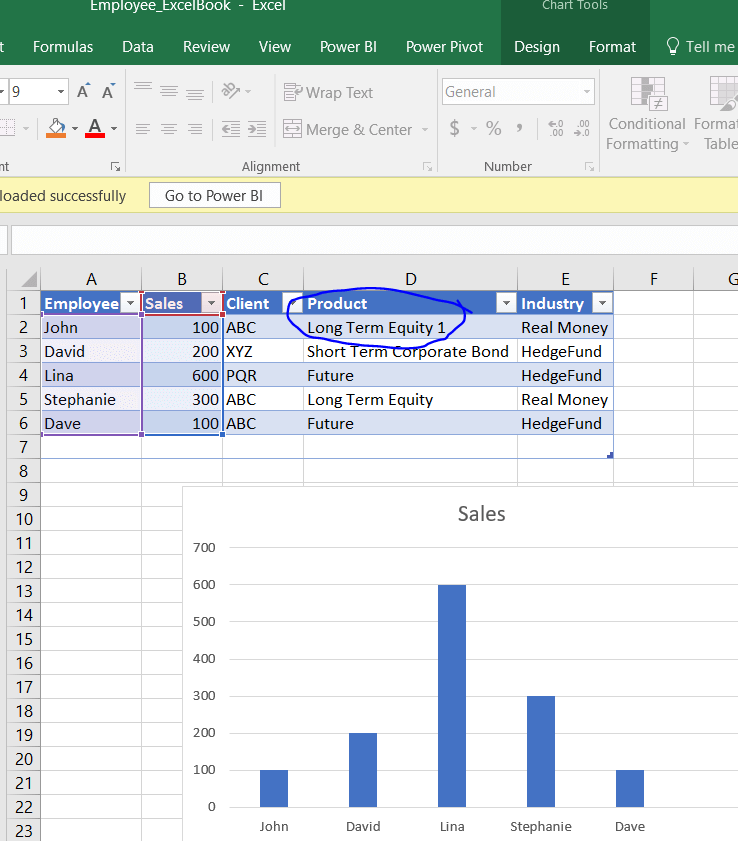
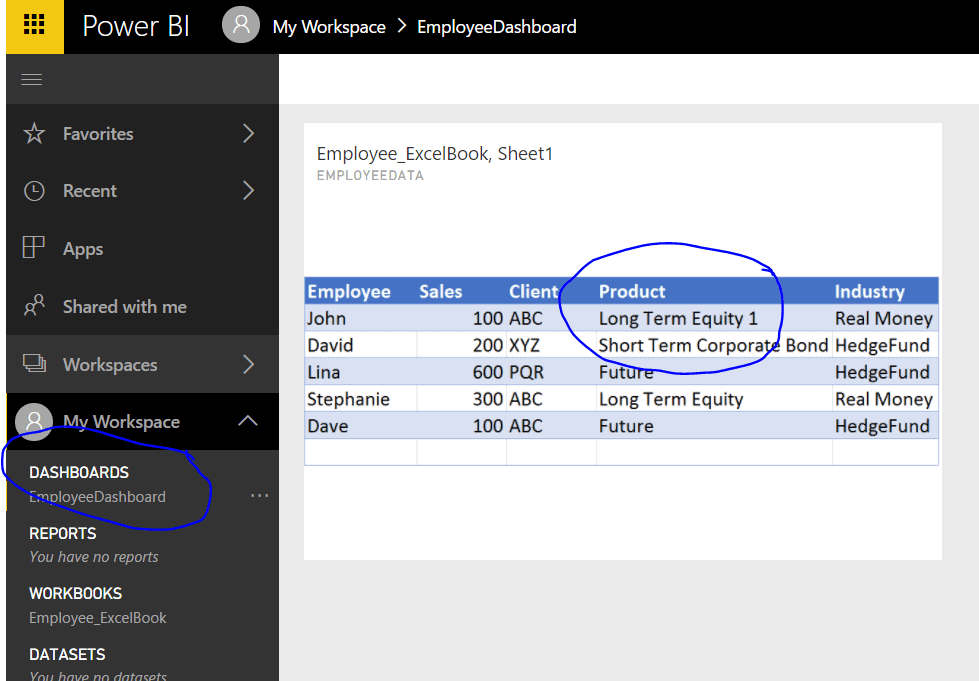
Open the Power BI app and you can then see that the ‘EmployeeDashboard’ dashboard is updated.
Here we have published ‘as is’ an Excel file to Power BI. But if you have more than one dataset in Excel and you want to create an interactive dashboard using those dataset, you will need to create a data model in Excel, publish the data model and then create a visualization in Power BI, as covered in the next section.
Create data model in Excel and visualization in Power BI
To create an interactive dashboard in Power BI using more than one dataset, first we need to create a data model in Excel. Open a new Excel file and copy the two data sets below. Save the Excel file ‘Employee_ExcelData.xlsx’
|
Employee |
Sales |
Client |
Product |
Industry |
|
John |
100 |
ABC |
Long Term Equity |
Real Money |
|
David |
200 |
XYZ |
Short Term Corporate Bond |
HedgeFund |
|
Lina |
600 |
PQR |
Future |
HedgeFund |
|
Stephanie |
300 |
ABC |
Long Term Equity |
Real Money |
|
Employee |
State |
|
John |
Hawai |
|
David |
Hawai |
|
Lina |
NY |
|
Stephanie |
NY |
Now we will convert this dataset into table format. In Excel file, select the data set, click on ‘Insert’ ’Table’. Then press ‘Ok’ to create the table.
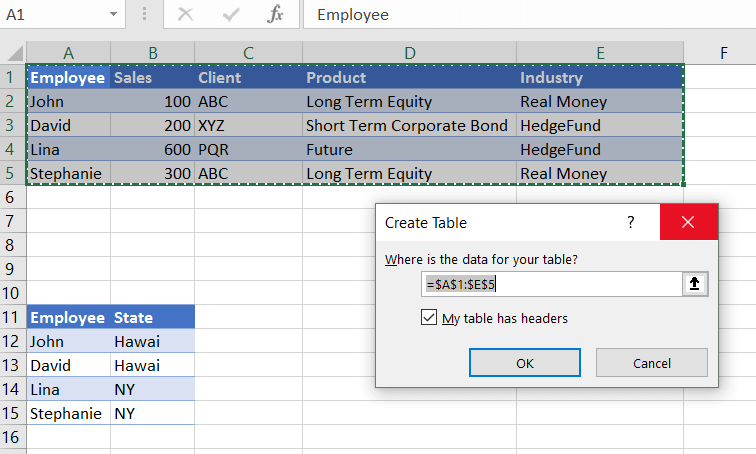
Name the table as ‘Employee’. Since we are aiming to use Excel data in Power BI, it is very important to convert data into a table. To create a dataset in Power BI, Excel data must be in tabular format.
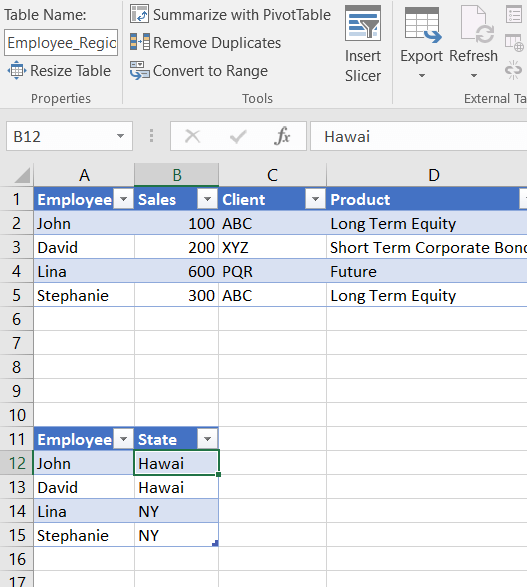
Repeat the steps to convert the ‘employee-state’ data into a table. Name the table as ‘Employee_Region’.
Before we export this Excel data to Power BI, we will create a relation between the Employee and Employee_Region table. Click ‘DataRelationships’ to open the Relationship window.
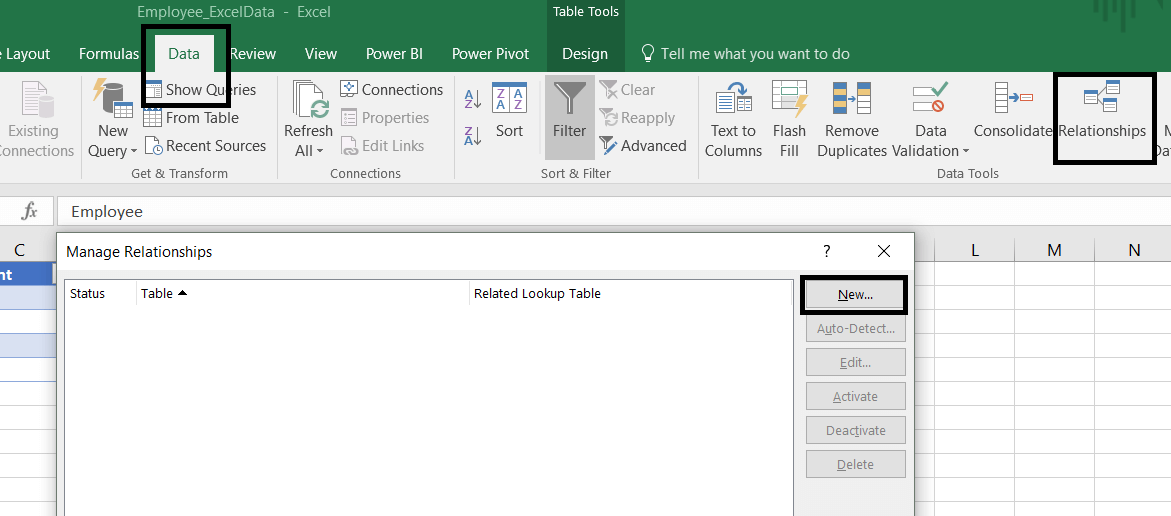
Click on the ‘New…’ button and select the Excel table names and field names to create a new relationship between the two data set.
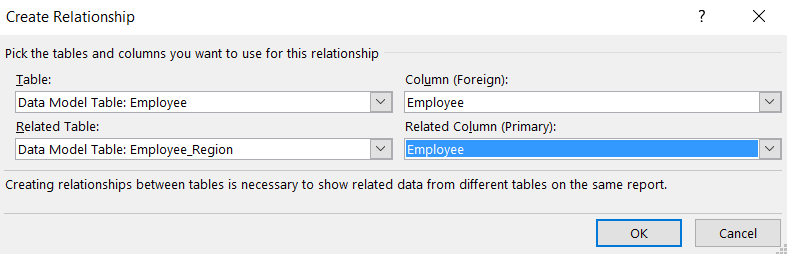
Click ‘ok’ to close the ‘manage relationship’ dialog box and save the ‘Employee_ExcelData.xlsx’ file. The Excel data model is created and is ready to publish. In Excel 2016, go to the File menu and click ‘Publish’. To export Excel data to Power BI, select an option ‘Export workbook data to Power BI’.
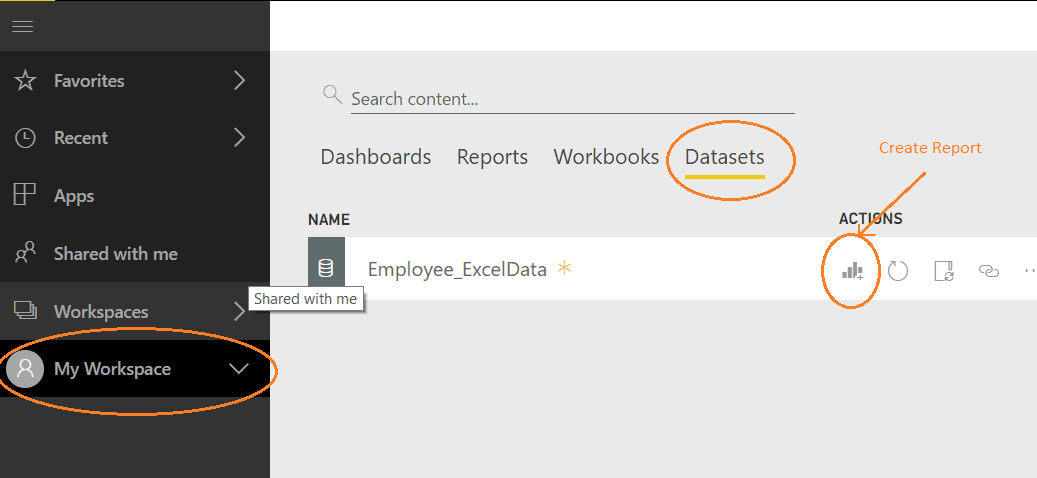
Once the data is published to Power BI, you will see a message in the Excel file ‘PUBLISH TO POWER BI Workbook exported successfully’’. Open ‘app.powerbi.com’, click on ‘My Workspace’Dataset and you will see published data set ‘Employee_ExcelData’. In the ‘Datasets’ section, you can see list of datasets sourced from various supported data sources such as SQL, Excel, SSAS cube and Oracle. If you want to view the dataset, Power BI provides the ‘Analyze in Excel’ option. Click the eclipse icon […] and select ‘Analyze in Excel’.
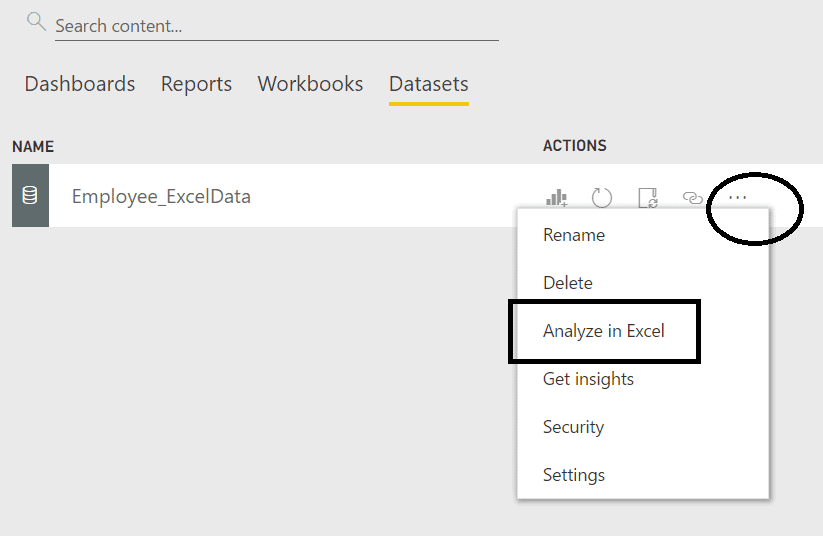
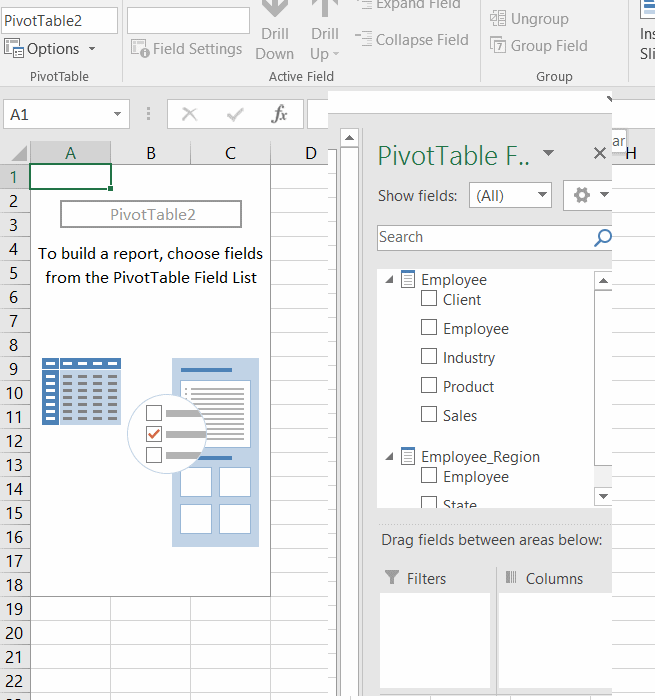
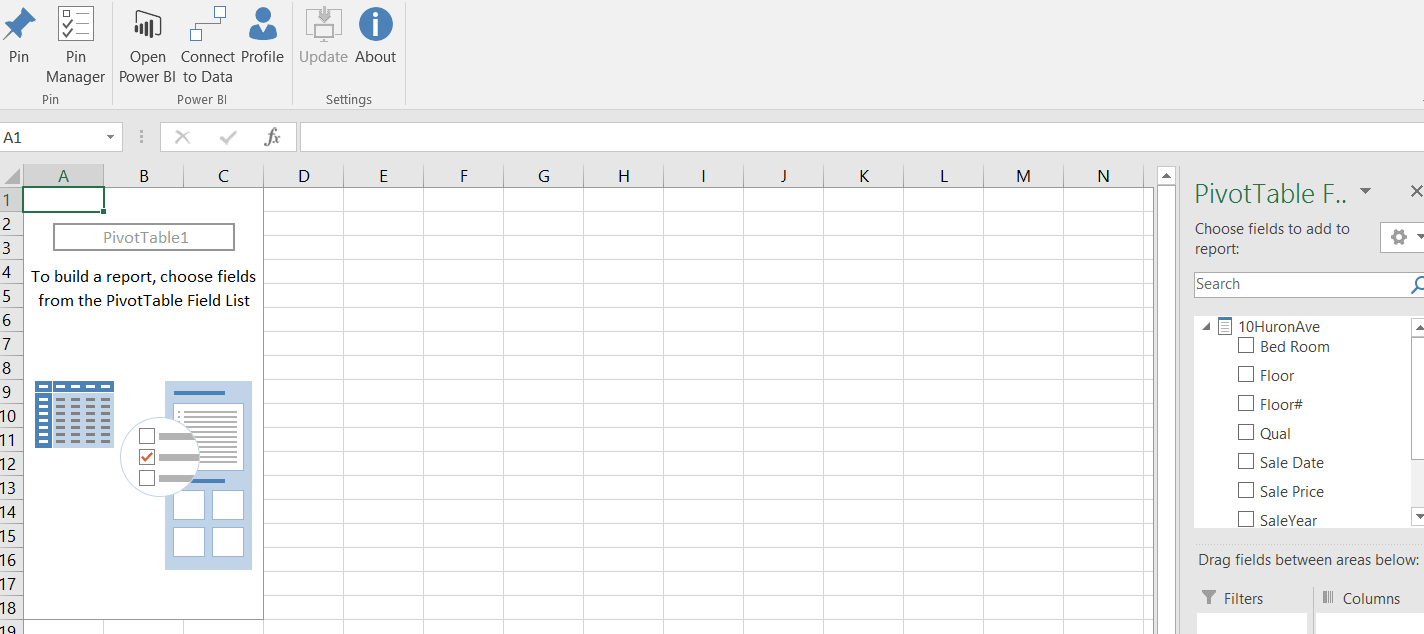
Once you click on ‘Analyze in Excel’,the Microsoft Office Data Connection file ‘.odc’ will get downloaded to your machine. Open the downloaded file in Excel and you will see the dataset fields in a pivot table. Now, select and filter the fields, you can view the data in Power Pivot Table.
The ‘Power BI publisher for Excel’ plugin is another way to analyze a Power BI dataset in Excel. First install the ‘Power BI publisher for Excel’ plugin and then click on the Power BI ribbon, there is an option ‘Connect to Data’. Using ‘Connect to Data’ option, you can connect to a Power BI dataset and analyze the data in Excel. As we have seen before, the ‘Power BI publisher for Excel’ plugin is also used to ‘pin’ a data element and create a dashboard.
From ‘My workspace’, select the datatype ‘report/dataset’. Choose the report /dataset name and hit ‘connect’.
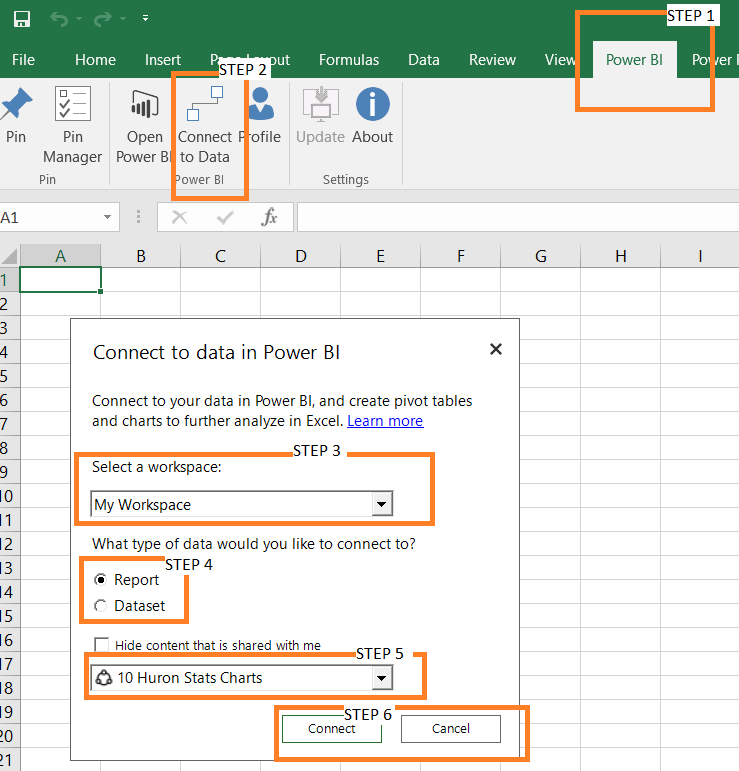
Once you hit the ‘connect’ button, you will see Power BI dataset/report in the Excel Power pivot table. Using the ‘Power BI’ ribbon, we can connect to any Power BI app report/dataset and analyze the data in Excel.
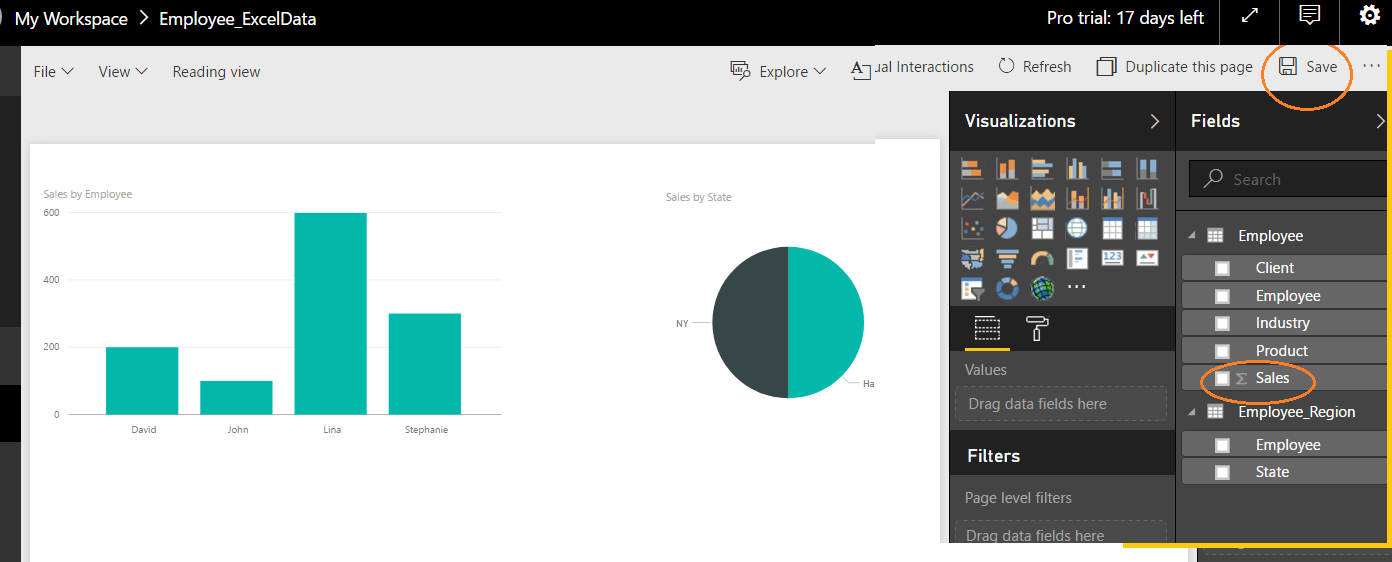
Once you view/analyze data, you can create a report in Power BI. Go to the app.powerbi.com > ’My Workspace’ > ‘dataset’ . Click on the chart icon to create a report in Power BI.
In the report section, double click on ‘pie chart’ or any other visualization. Once an empty visualization chart is in the report section, select thetable fields. In Excel, we have defined a relation between the ‘Employee’ and ‘Employee_Region’ dataset, so in a chart you can select fields from either dataset. Select the ‘sales’ field from the ‘Employee’ dataset and the ‘state’ field from the ‘Employee_Region’ dataset. The chart shows ‘sales’ number by ‘state’. Save the report ‘Employee_ExcelReport’. As you have seen before, in order to to add any chart to dashboard, select ‘chart’ and click ‘Pin’. We have also seen how to share a dashboard with different users.
Once your data is published in Power BI, you can use various Power BI features. Using Power BI, you can refresh data, view the dashboard in mobile and share reports. Power BI allows users to import data as well. In next section we will cover, how to import data from Power BI.
Import data from Power BI
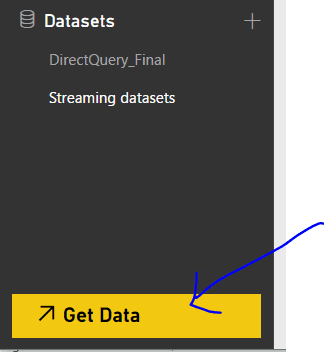
As you have seen, you can publish Excel file to Power BI. There is a way to get data from Excel to the Power BI app. Using ‘Get data’ option in Power BI, you can import an Excel work book and Excel data to Power BI. Open ‘app.powerBI.com’, in left panel you will see the ‘Get data’ option.
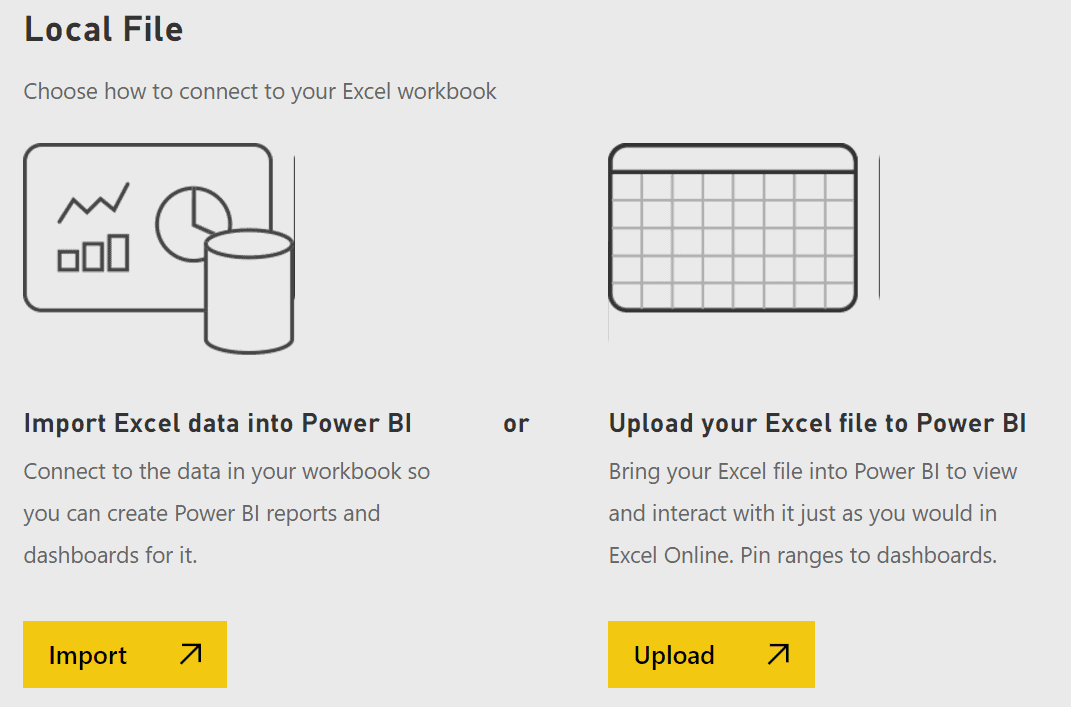
Click on ‘Get data’ and you will see several options to select data source. To import data from Excel, under ‘Files’ tile, click ‘Get’ to choose Excel file location. Now you have two options ‘Import Excel data into Power BI’ and ‘Upload your Excel file to Power BI’. If you select ‘Import Excel data into Power BI’ option, only Excel data appear in Power BI and you can create visualization in Power BI. If you select ‘Upload your Excel file to Power BI’ option, ‘as is’ Excel file will upload in Power BI app.
Once you Import data in Power BI, the data will appear under ‘My workspace’ ‘Datasets’. If you have selected the ‘Upload’ option in Power BI, the file will appear under ‘My workspace; ;WorkBooks’. As you have seen, there are many ways to connect Excel with Power BI. If you are in Power BI app, you can use a ‘Get Data’ option to get the Excel file into Power BI. If you are in Excel, you can use the ‘publish’ option to publish an Excel file to Power BI.
Conclusion
In this article, we have seen that Excel and Power BI are easily connected together . Power BI is an easy tool to work with, and no complex coding is required. Power BI is adding business intelligence capability to Excel. Power BI allows people to collaborate in using Excel and provides additional features such as visualization, sharing etc. Excel with Power BI create a robust BI solution.
This document contains proprietary information and is protected by copyright law.
Copyright © 2026 Red Gate Software Limited. All rights reserved
Load comments