A lot of the information about the way that SQL Server is working that can only be provided by Extended Events (XEvents). It is such a versatile system that it can provide a lot more than would otherwise require SQL Trace. If done well, Extended Events are so economical to use that it takes very little CPU. For many tasks, it requires less effort on the part of the user than SQL Trace.
Extended Events (XEvents) aren’t particularly easy to use, and nothing that involves having to use XML is likely to be intuitive: In fact, many DBAs compare XML unfavourably in terms of its friendliness with a cornered rat. SSMS’s user-interface for Extended Events, thankfully, removes a lot of the bite. For the beginner to XEvents with a background in SQL, it is probably best to collect a few useful ‘recipes’ and grow from that point. Templates and snippets are invaluable.
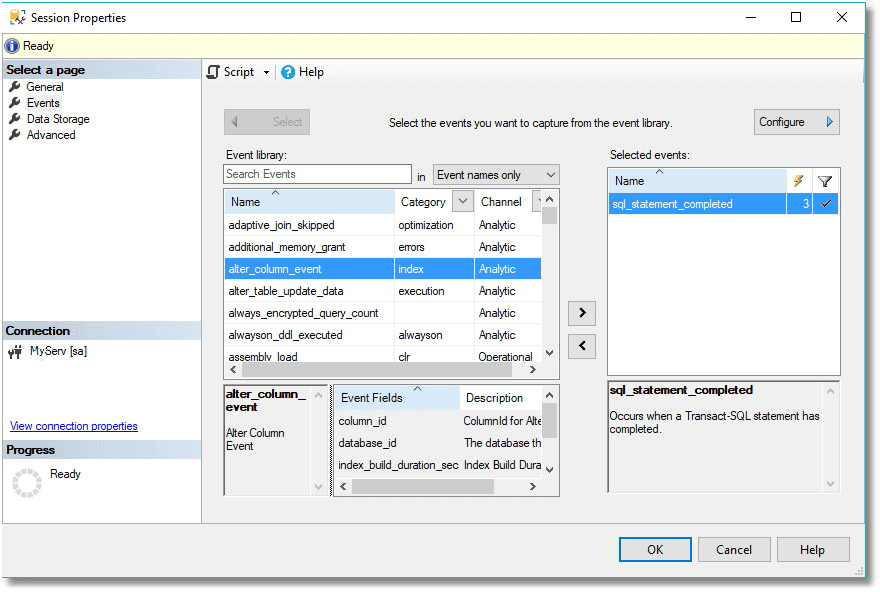
SSMS has a very good GUI that is perfectly usable to get an XEvents session up and running in order to see what is in the current queries. Its use is well covered by various articles such as Advanced Viewing of Target Data from Extended Events in SQL Server and Robert Sheldon’s Getting Started with Extended Events in SQL Server 2012. I particularly like the ‘New Session’/’session properties’ screen, which allows you to create a new session, to view and to change the properties of a session.
The reason that XEvents is more like a box of Lego bricks than like a complete model of the Starship Enterprise is that there is a huge range of requirements. It is difficult, for example, to get developers to agree on what constitutes a poor-performing query that is hogging resources or to get DBAs to come up with a consensus on the definition of a system resource contention. We want specific questions answered, and for this, XEvents is ideal because we can frame the question exactly.
The Anatomy of Extended Events
The data that is collected by Extended Events is stored in data documents; each individual session has a corresponding document. These documents are an array of events. If you specify more than one event in your session, then you will have entries for each event, which are likely to have different attributes. You might also want to add common attributes to the predicates that are special to the event.
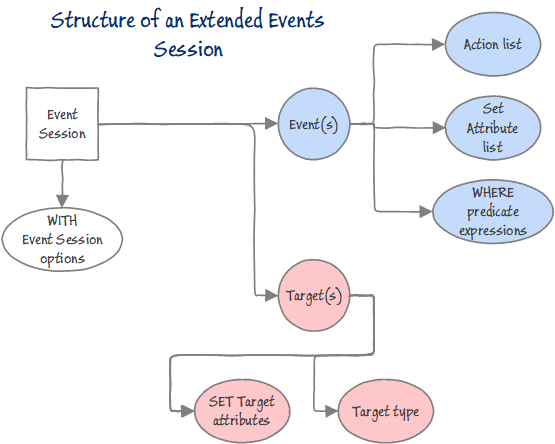
To deal with this, it makes sense to use a data document language such as XML for storing the data, because each event is likely to have its own special data schema, containing both predicates and common attributes.
Most Extended Events sessions consist of two main parts. Firstly, the session is set up and started, and secondly, the results are queried. The session creation is done in SQL, and this is easily available even if you use the GUI. As part of the setup of the session, the session needs to be defined along with the actions that are to be used, and any filtering, the target, and the settings. The target of the event is the destination for all of the information that is captured by the session and depends on what your requirements are. Targets can write to a file, store event data in a memory buffer, or aggregate the event data in a series of ‘buckets.’ Probably the simplest is the asynchronous Ring buffer which is a memory-based FIFO. More familiar to users of SQL Trace is the asynchronous Event file, which writes from memory to disk. The Histogram target increments bucket counters to count the number of times that a specified event occurs, based on an attribute of the event. Event pairing is designed for events that occur in pairs such as sql_statement_started and sql_statement_completed and is useful to detect when a specified paired event does not occur in a matched set.
The built-in sessions aren’t always of immediate use. Why not? For a start, they include a lot of different events, so they cannot be viewed as tables because each event will have different values. Also, they can have bewildering characteristics such as those occasions when data comes and goes from the ring buffer, which seems to be due to a syntax error in the NT Service/SQLTelemetry.
You can see what is currently active in the way of sessions by means of the query
|
1 2 3 4 5 |
SELECT xs.name, xst.target_name, xst.execution_count, xst.execution_duration_ms, Cast(xst.target_data AS XML) AS targetdata FROM sys.dm_xe_session_targets AS xst INNER JOIN sys.dm_xe_sessions AS xs ON xst.event_session_address = xs.address; |
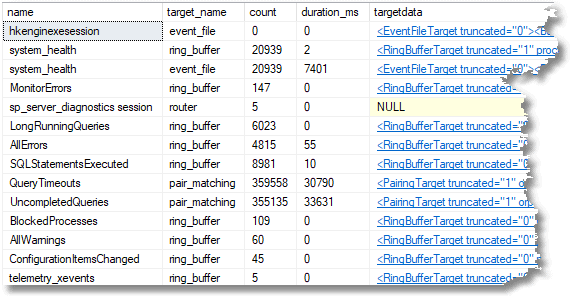
If you are using the grid for results, you can click on the targetdata column to view the XML file.
To start with, I suggest that it is worth starting simply with a session that has just a single event.
We’ll try that with sqlserver.error_reported.
Catching Those Pesky Errors
For our first Extended Events session, we will try something with just one event. This records all errors, including those from scheduled tasks and client applications. To do this, I used the SSMS Create Session wizard. Although it is those error messages with low severity numbers that are interesting, I added a filter so that we didn’t need to see anything less than severity eleven.
In order to do our best to track where the error happened, and who caused it, I’ve added some fields from the general pool of event parameters to give you more information in the ACTION clause.
|
1 2 3 4 5 6 7 8 9 10 11 12 13 14 15 16 17 18 19 20 21 22 23 24 25 26 27 28 29 |
IF EXISTS --if the session already exists, then delete it. We are assuming you've changed something ( SELECT * FROM sys.server_event_sessions WHERE server_event_sessions.name = 'AllErrors' ) DROP EVENT SESSION AllErrors ON SERVER; GO CREATE EVENT SESSION AllErrors -- the name of the session ON SERVER ADD EVENT sqlserver.error_reported --just the one event (ACTION ( sqlserver.client_app_name, sqlserver.client_connection_id, sqlserver.database_name, sqlserver.nt_username, sqlserver.sql_text, sqlserver.username --all these are useful for tracking an error ) WHERE ([severity]>(10)) -- it is boring looking at the information messages ) ADD TARGET package0.ring_buffer --we will rwrite it to a ring buffer targwet only (SET max_memory = (4096)) WITH ( MAX_MEMORY = 4096KB, EVENT_RETENTION_MODE = ALLOW_SINGLE_EVENT_LOSS, MAX_DISPATCH_LATENCY = 30 SECONDS, MAX_EVENT_SIZE = 0KB, MEMORY_PARTITION_MODE = NONE, TRACK_CAUSALITY = OFF, STARTUP_STATE = on ); GO ALTER EVENT SESSION AllErrors ON SERVER STATE = START; GO |
Now we can test it very easily. Right-click the Extended event window and hit refresh. Make sure that the AllErrors session is there and started. Then start the live data window by right-clicking the started session and choosing Watch Live Data.
|
1 2 3 4 5 6 7 8 9 |
/* We will now put some data in the buffer */ SELECT * FROM nonexistentTable GO SELECT nonexistentColumn FROM sys.tables Go SELECT * FROM sys.tables WITH resolution GO GRANT SELECT ON OBJECT::Fritchey TO Phil; Go |
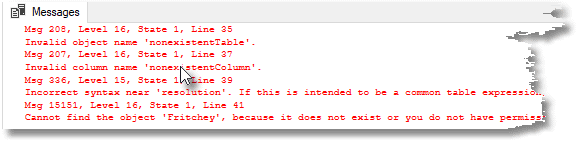
Depending on which version of SSMS you are using, you may or may not see the data show up in the Live Data pane right away. If you don’t see it, try running the batch again.
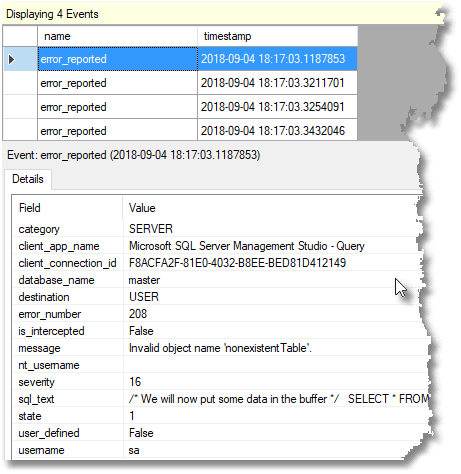
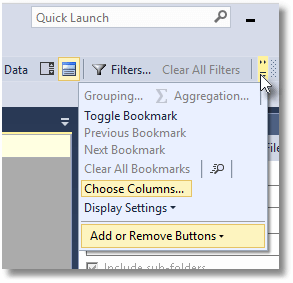
You can see that a number of event fields are shown in the details tab. You can add more columns to the trace window by clicking the Choose Columns button on the Extended Events toolbar.
With the Choose Columns screen, you can then decide which columns you see in the list.
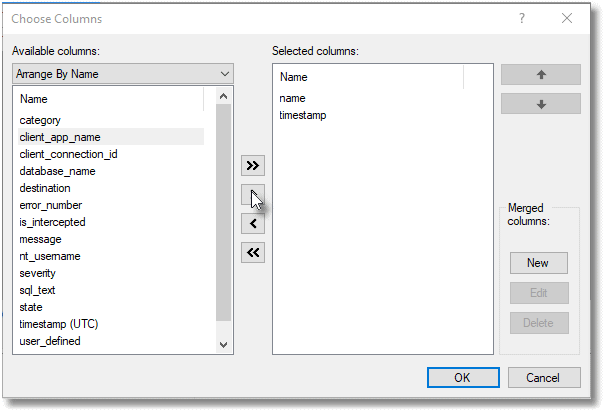
You can also right-click on the data in the list in the lower pane to add it to, or remove it from, the table in the upper pane.
You can also view the target data as an XML document. To do this, expand the session to see the targets. Right-click on the target and select View Target Data. This display is updated occasionally. If you right-click the target data and then select Refresh Interval from the context menu that appears, you can select the refresh interval from the interval list. Likewise, from this context menu, you can pause and resume the automatic refresh.
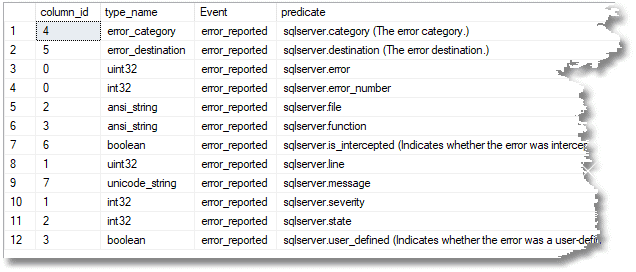
As well as using the events properties window, you can find out what is available as a built-in field and predicate source for any event via a query like this, and (hopefully when they’ve filled in the column) an explanation of what it is about. This query is set to tell you what is available for error_reported.
Predicate Source Query
|
1 2 3 4 5 6 7 8 9 10 11 12 13 14 15 |
SELECT c.column_id, c.type_name, c.object_name AS Event, p.name + '.' + c.name + Coalesce(' (' + c.description + ')', ' (' + po.description + ')', '') AS predicate FROM sys.dm_xe_object_columns AS c JOIN sys.dm_xe_objects AS o ON o.name = c.object_name JOIN sys.dm_xe_packages AS p ON p.guid = o.package_guid LEFT OUTER JOIN sys.dm_xe_objects AS po ON c.name = po.name AND po.object_type = 'pred_source' WHERE c.column_type = 'data' AND o.object_type = 'event' AND o.name = 'error_reported' AND p.name = 'sqlserver' ORDER BY predicate; |
All we need now is some SQL code so we can see the errors in a relational way and maybe do some reporting and investigating. Actually, it is strange to see the errors that crop up.
|
1 2 3 4 5 6 7 8 9 10 11 12 13 14 15 16 17 18 19 20 21 22 23 24 25 26 |
DECLARE @Target_Data XML = ( SELECT TOP 1 Cast(xet.target_data AS XML) AS targetdata FROM sys.dm_xe_session_targets AS xet INNER JOIN sys.dm_xe_sessions AS xes ON xes.address = xet.event_session_address WHERE xes.name = 'AllErrors' AND xet.target_name = 'ring_buffer' ); SELECT CONVERT(datetime2, SwitchOffset(CONVERT(datetimeoffset,xed.event_data.value('(@timestamp)[1]', 'datetime2')), DateName(TzOffset, SYSDATETIMEOFFSET()))) AS datetime_local, --xed.event_data.value('(@timestamp)[1]', 'datetime2') AS time_UTC, --xed.event_data.value('(@name)[1]', 'varchar(50)') AS event_type, --xed.event_data.value('(data[@name="category"]/text)[1]', 'varchar(255)') AS Category, xed.event_data.value('(data[@name="error_number"]/value)[1]', 'int') AS [Error_Number], xed.event_data.value('(data[@name="severity"]/value)[1]', 'int') AS Severity, xed.event_data.value('(data[@name="message"]/value)[1]', 'varchar(255)') AS [Message], xed.event_data.value('(action[@name="username"]/value)[1]', 'varchar(255)') AS UserName, xed.event_data.value('(action[@name="nt_username"]/value)[1]', 'varchar(255)') AS NT_Username, xed.event_data.value('(action[@name="sql_text"]/value)[1]', 'nvarchar(max)') AS SQL_Text, xed.event_data.value('(action[@name="database_name"]/value)[1]', 'varchar(255)') AS [Database_Name], xed.event_data.value('(action[@name="client_connection_id"]/value)[1]', 'varchar(255)') AS client_conn, xed.event_data.value('(action[@name="client_app_name"]/value)[1]', 'varchar(255)') AS client_app_name FROM @Target_Data.nodes('//RingBufferTarget/event') AS xed (event_data) |
We now have an effective solution. It is possible to create a view from the SQL if you forgo the creation of the temporary variable (it is quicker to run with the temporary variable), or you might create a stored procedure. You will probably need to add various WHERE clauses, the most obvious being how long ago you want to see errors. Here is an example that lets you see the last twenty minutes worth of errors.
|
1 2 3 4 5 6 7 8 9 10 11 |
WHERE DateDiff ( MINUTE,Convert (DATETIME2, SwitchOffset( Convert(DATETIMEOFFSET,xed.event_data.value('(@timestamp)[1]', 'datetime2') ), DateName(TzOffset, SysDateTimeOffset()) ) ), GetDate() ) < 20; |
A Performance Test Harness
Very often, we want to understand in some detail where slow SQL code happens in a particular batch or set of batches, and why. To do this, you need to have information about the duration and I/O. You also need to be able to access the execution plan for the batch. An obvious candidate event for this is the sql_statement_completed event. We are here setting up a session, starting it, running our test, and immediately stopping it again. We identify the batch we are interested in by putting a unique string at the beginning of the batch and filtering the event to happen only if the statement is part of this batch. Because we know what batch the statement belongs to, we can get the execution plan. This means that we can see what is in the execution plan to get as much detail as we need. In this example, I’m only doing one batch, but if you run several batches as part of the test, it will catch them all if the batch starts with the same unique string.
The sql_statement_completed event has some very useful fields/predicates. (These come from executing the Predicate Query I showed earlier.)
- sqlserver.cpu_time (Indicates the CPU time in microseconds that is consumed by the statement.)
- sqlserver.duration (The time in microseconds that it took to execute the statement.)
- sqlserver.last_row_count (The last row count for this statement.)
- sqlserver.line_number (The statement line number, in relation to the beginning of the batch.)
- sqlserver.logical_reads (The number of logical page reads that were issued by the statement.)
- sqlserver.offset (The statement start offset, in relation to the beginning of the batch.)
- sqlserver.offset_end (The statement end offset, in relation to the beginning of the batch. The value will be -1 for the last statement.)
- sqlserver.parameterized_plan_handle (The plan handle of the cache entry of the parameterized query plan.)
- sqlserver.physical_reads (The number of physical page reads that were issued by the statement.)
- sqlserver.row_count (The number of rows that were touched by the statement.)
- sqlserver.statement (The text of the statement that triggered the event.)
- sqlserver.writes (The number of page writes that were issued by the statement)
What we are doing here is to test whether the hints for GROUP BY are at all useful. To test it, we run the same GROUP BY query against AdventureWorks, using hints, and not using hints. We then create an index on the column being aggregated and run the queries again. We end up with a report that tells us the resources used every time, and how long the query takes. We can then drill into the detail. Note that you need to change the AdventureWorks2016 database to whatever version you have and also change the name of your test database, here artfully called YourTestDatabase.
|
1 2 3 4 5 6 7 8 9 10 11 12 13 14 15 16 17 18 19 20 21 22 23 24 25 26 27 28 29 30 31 32 33 34 35 36 37 38 39 40 41 42 43 44 45 46 47 48 49 50 51 52 53 54 55 56 57 58 59 60 61 62 63 64 65 66 67 68 69 70 71 72 73 74 75 76 77 78 79 80 81 82 83 84 85 86 87 88 89 90 91 92 93 94 95 96 97 98 99 100 101 102 103 104 105 106 107 108 109 110 111 112 113 114 115 116 117 118 119 120 |
IF EXISTS --if the session already exists, then delete it. We are assuming you've changed something ( SELECT * FROM sys.server_event_sessions WHERE server_event_sessions.name = 'SQLStatementsExecuted' ) DROP EVENT SESSION SQLStatementsExecuted ON SERVER; GO CREATE EVENT SESSION SQLStatementsExecuted --call it what you wish, of course ON SERVER ADD EVENT sqlserver.sql_statement_completed --we just have one event (ACTION (sqlserver.database_name, sqlserver.sql_text, sqlserver.plan_handle)-- and these global vars WHERE (sqlserver.like_i_sql_unicode_string(sqlserver.sql_text, N'--Test the value of GROUP BY options%')) --we just want the batch and nothing else so we put an identifying string at the start ) ADD TARGET package0.ring_buffer --we don't need a more permanent record or a bucket count WITH (STARTUP_STATE = OFF); GO --To test the session, run this: USE YourTestDatabase --Alter to whatever database you use. We used AdventureWorks data. ALTER EVENT SESSION SQLStatementsExecuted ON SERVER STATE = START; --The Batch being tested starts here ---V GO --don't change this next line without changing the WHERE clause above --Test the value of GROUP BY options DECLARE @bucket TABLE (suffix VARCHAR(10) NOT NULL, quantity INT NOT NULL); --this is purely done so we don't have the extra results --we've already checked these INSERT --1/ no options, no suitable index INTO @bucket(suffix,quantity) SELECT Coalesce(p.Suffix,'(none)') , Count(*) AS SuffixUsageCount FROM AdventureWorks2016.Person.Person AS p GROUP BY p.Suffix INSERT --2/ order group option, no index INTO @bucket(suffix,quantity) SELECT Coalesce(p.Suffix,'(none)') , Count(*) AS TheSuffixUsageCount FROM AdventureWorks2016.Person.Person AS p GROUP BY p.Suffix OPTION ( ORDER GROUP ) INSERT --3/ Hash group option, no index INTO @bucket(suffix,quantity)SELECT -- hash group no index Coalesce(p.Suffix,'(none)') , Count(*) AS TheSuffixUsageCount FROM AdventureWorks2016.Person.Person AS p GROUP BY p.Suffix OPTION ( HASH group ) CREATE INDEX DeleteMePlease -- build an index ON AdventureWorks2016.person.person (Suffix) INSERT --4/ no option, a suitable index INTO @bucket(suffix,quantity) SELECT -- re-execute the code Coalesce(p.Suffix,'(none)') , Count(*) AS TheSuffixUsageCount FROM AdventureWorks2016.Person.Person AS p GROUP BY p.Suffix INSERT --5/ order group option, suitable index INTO @bucket(suffix,quantity) SELECT -- order group with index Coalesce(p.Suffix,'(none)') , Count(*) AS TheSuffixUsageCount FROM AdventureWorks2016.Person.Person AS p GROUP BY p.Suffix OPTION ( ORDER GROUP ); INSERT --6/ hash group option, suitable index INTO @bucket(suffix,quantity) SELECT -- hash group with index Coalesce(p.Suffix,'(none)') , Count(*) AS TheSuffixUsageCount FROM AdventureWorks2016.Person.Person AS p GROUP BY p.Suffix OPTION ( HASH group ); INSERT --7/ no option, suitable index INTO @bucket(suffix,quantity) SELECT -- re-execute the code with index Coalesce(p.Suffix,'(none)') , Count(*) AS TheSuffixUsageCount FROM AdventureWorks2016.Person.Person AS p GROUP BY p.Suffix GO USE AdventureWorks2016 DROP INDEX Person.Person.DeleteMePlease USE YourTestDatabase --Alter to whatever test database you use. DECLARE @Target_Data XML = ( SELECT TOP 1 Cast(xet.target_data AS XML) AS targetdata FROM sys.dm_xe_session_targets AS xet INNER JOIN sys.dm_xe_sessions AS xes ON xes.address = xet.event_session_address WHERE xes.name = 'SQLStatementsExecuted' AND xet.target_name = 'ring_buffer' ); SELECT CONVERT(datetime2, SwitchOffset(CONVERT(datetimeoffset,the.event_data.value('(@timestamp)[1]', 'datetime2')), DateName(TzOffset, SYSDATETIMEOFFSET()))) AS datetime_local, CONVERT(DECIMAL(6,3),round(the.event_data.value('(data[@name="duration"]/value)[1]', 'bigint')/1000000.0,3,1)) AS duration, the.event_data.value('(data[@name="statement"]/value)[1]', 'nvarchar(max)') AS [statement], --the.event_data.value('(action[@name="sql_text"]/value)[1]', 'nvarchar(max)') AS sql_text, --the.event_data.value('(action[@name="database_name"]/value)[1]', 'nvarchar(80)') AS [database_name], qp.query_plan, the.event_data.value('(data[@name="cpu_time"]/value)[1]', 'bigint') AS [cpu_time(microsSecs)], the.event_data.value('(data[@name="physical_reads"]/value)[1]', 'bigint') AS physical_reads, the.event_data.value('(data[@name="logical_reads"]/value)[1]', 'bigint') AS logical_reads, the.event_data.value('(data[@name="writes"]/value)[1]', 'bigint') AS writes, the.event_data.value('(data[@name="row_count"]/value)[1]', 'bigint') AS row_count --the.event_data.value('(data[@name="last_row_count"]/value)[1]', 'int') AS last_row_count, --the.event_data.value('(data[@name="line_number"]/value)[1]', 'int') AS line_number, --the.event_data.value('(data[@name="offset"]/value)[1]', 'int') AS offset, --the.event_data.value('(data[@name="offset_end"]/value)[1]', 'int') AS offset_end, FROM @Target_Data.nodes('//RingBufferTarget/event') AS the (event_data) OUTER APPLY sys.dm_exec_query_plan( Convert(varbinary(64),--convert to valid plan handle '0x' + the.event_data.value('(action[@name="plan_handle"]/value)[1]', 'nvarchar(max)') ,1)) as qp ALTER EVENT SESSION SQLStatementsExecuted ON SERVER STATE = STOP; |
This gives a result in SSMS that I’ll show in full and then divide it in half so you can read it.
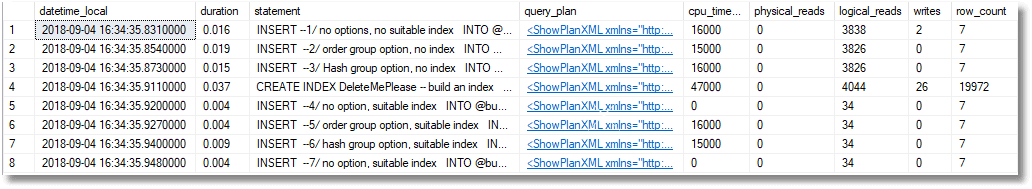
Although I’ve converted the duration from microseconds to seconds, the time is a bit misleading because it isn’t the same as the elapsed time measured from the application, and the batch duration is longer than the individual durations of the queries in the batch. However, it is proportional to the elapsed time. We can, of course, click on the query plan to see the details of execution. In this case, we have monitored only one batch, so there is only one query plan.
To get the explanations for each query visible, I put a comment into the batch as close as possible to the beginning of the query, so it showed up in the result grid.
One point that needs emphasizing is that the batch or batches that we want to be traced are marked by a string at the start of the batch. --Test the value of GROUP BY options.
|
1 2 3 |
--The Batch being tested starts here ---V GO --don't change this next line without changing the WHERE clause above --Test the value of GROUP BY options |
If you leave that out, the test won’t work.
In order to filter just those batches that we wanted to report on, we had to search the start of the batch. To make the comparison, we used the rather obscure LIKE comparison sqlserver.like_i_sql_unicode_string. You can see a list of all these predicate comparisons in the GUI, or by a query like this.
List the Predicate Options
|
1 2 3 4 5 6 7 8 |
-- list predicate comparisons SELECT p.name AS package_name, o.name AS source_name, o.object_type, o.description FROM sys.dm_xe_objects AS o JOIN sys.dm_xe_packages AS p ON o.package_guid = p.guid WHERE o.object_type LIKE 'pred_compare' ORDER BY o.object_type, source_name; |
In the first example, we did just one batch. You can turn the example into several batches all with their own execution plan simply by adding
|
1 2 |
GO --Test the value of GROUP BY options |
Here is the same test with each query that you want to measure in its own batch
|
1 2 3 4 5 6 7 8 9 10 11 12 13 14 15 16 17 18 19 20 21 22 23 24 25 26 27 28 29 30 31 32 33 34 35 36 37 38 39 40 41 42 43 44 45 46 47 48 49 50 51 52 53 54 55 56 57 58 59 60 61 62 63 64 65 66 67 68 69 70 71 |
USE YourTestDatabase --Alter to whatever database you use. We used AdventureWorks data. SET STATISTICS IO off --Test the value of using the HASH | ORDER GROUP query hints CREATE table #bucket (suffix VARCHAR(10) NOT NULL, quantity INT NOT NULL); GO --Test the value of GROUP BY options: First one is no options, no suitable index INSERT --1/ no options, no suitable index INTO #bucket(suffix,quantity) SELECT Coalesce(p.Suffix,'(none)') , Count(*) AS SuffixUsageCount FROM AdventureWorks2016.Person.Person AS p GROUP BY p.Suffix GO --Test the value of GROUP BY options: Second is order group option, no index INSERT --2/ order group option, no index INTO #bucket(suffix,quantity) SELECT Coalesce(p.Suffix,'(none)') , Count(*) AS TheSuffixUsageCount FROM AdventureWorks2016.Person.Person AS p GROUP BY p.Suffix OPTION ( ORDER GROUP ) GO --Test the value of GROUP BY options: third is Hash group option, no index INSERT --3/ Hash group option, no index INTO #bucket(suffix,quantity)SELECT -- hash group no index Coalesce(p.Suffix,'(none)') , Count(*) AS TheSuffixUsageCount FROM AdventureWorks2016.Person.Person AS p GROUP BY p.Suffix OPTION ( HASH group ) GO CREATE INDEX DeleteMePlease -- build an index ON AdventureWorks2016.person.person (Suffix) GO --Test the value of GROUP BY options: - fourth is no option, suitable index INSERT --4/ no option, suitable index INTO #bucket(suffix,quantity) SELECT -- re-execute the code Coalesce(p.Suffix,'(none)') , Count(*) AS TheSuffixUsageCount FROM AdventureWorks2016.Person.Person AS p GROUP BY p.Suffix GO --Test the value of GROUP BY options: - fifth is order group option, suitable index INSERT --5/ order group option, suitable index INTO #bucket(suffix,quantity) SELECT -- order group with index Coalesce(p.Suffix,'(none)') , Count(*) AS TheSuffixUsageCount FROM AdventureWorks2016.Person.Person AS p GROUP BY p.Suffix OPTION ( ORDER GROUP ); GO --Test the value of GROUP BY options: last is hash group option, suitable index INSERT --6/ hash group option, suitable index INTO #bucket(suffix,quantity) SELECT -- hash group with index Coalesce(p.Suffix,'(none)') , Count(*) AS TheSuffixUsageCount FROM AdventureWorks2016.Person.Person AS p GROUP BY p.Suffix OPTION ( HASH group ); GO USE AdventureWorks2016 DROP INDEX Person.Person.DeleteMePlease USE YourTestDatabase DROP TABLE #bucket |
Notice the string --Test the value of GROUP BY options at the start of each batch. It doesn’t have to be that of course as long as you use whatever string you choose in the session event filter. Notice too that we’ve replaced the table variable with a temporary table because it is visible across batches.
I’ve written an article about using this technique with SQL Prompt snippets. This gives more details of the technique.
Tracking Troublesome Statements
Using the same SQL report, you can alter this predicate to look for a comment within a SQL statement, rather than looking at the start of a batch. I use the comment --troublesome.
|
1 2 3 4 5 6 7 8 9 10 11 12 13 14 15 16 17 18 19 |
IF EXISTS --if the session already exists, then delete it. We are assuming you've changed something ( SELECT * FROM sys.server_event_sessions WHERE server_event_sessions.name = 'TroublesomeSQLStatements' ) DROP EVENT SESSION TroublesomeSQLStatements ON SERVER; GO CREATE EVENT SESSION TroublesomeSQLStatements --call it what you wish, of course ON SERVER ADD EVENT sqlserver.sql_statement_completed --we just have one event (ACTION (sqlserver.database_name, sqlserver.sql_text, sqlserver.plan_handle)-- and these global vars WHERE ([sqlserver].[like_i_sql_unicode_string]( [sqlserver].[sql_text],N'%--troublesome%')) --we just want this statement to be recorded and nothing else so we put an identifying string in the query ) ADD TARGET package0.ring_buffer --we don't need a more permanent record or a bucket count WITH (STARTUP_STATE = OFF); GO ALTER EVENT SESSION TroublesomeSQLStatements ON SERVER STATE = START; |
To get a report of the execution of any query that has the comment you specify, you need to change the query that fetches the XML of the target data so that the name of the session is altered.
|
1 2 3 4 5 6 7 8 9 |
DECLARE @Target_Data XML = ( SELECT TOP 1 Cast(xet.target_data AS XML) AS targetdata FROM sys.dm_xe_session_targets AS xet INNER JOIN sys.dm_xe_sessions AS xes ON xes.address = xet.event_session_address WHERE xes.name = 'TroublesomeSQLStatements' AND xet.target_name = 'ring_buffer' ); |
The query that then shreds the XML will work without change.
Long-running Queries
These filters on the event can become addictive. Do you fancy tracking queries that took a long time to complete? Well, all you need to do is to change the filter to…
|
1 |
WHERE duration > 5000000 -- longer than 5 seconds |
… or whatever you consider a long-running query, and you can track them too. You can see that all you need to alter is the name of the session and the query that gets the XML of the target data, just as we did with the troublesome queries. You might have your own notion of what constitutes an expensive query. There is likely to be a predicate that will suit you.
We can also change the event on the fly, while the session is running. This, obviously, could lead to all sorts of odd things happening if the session data was being consumed by other processes or other processes were stopping or starting the process. The advantage, though, is that you can create simple views to shred the XML and display the results. It also means that you don’t then suffer from session bloat either.
|
1 2 3 4 5 6 7 |
ALTER EVENT SESSION [SQLStatementsExecuted] ON SERVER DROP EVENT sqlserver.sql_statement_completed ALTER EVENT SESSION [SQLStatementsExecuted] ON SERVER ADD EVENT sqlserver.sql_statement_completed(SET collect_statement=(1) ACTION(sqlserver.database_name,sqlserver.plan_handle,sqlserver.sql_text) WHERE duration > 5000000) GO |
Queries That Haven’t Ended
Queries can fail to end as they should for a variety of reasons. It could be, for example, that they are being blocked, that they have been timed-out by the client or have exceptionally poor performance. It could just be an error. It is useful to find out what these queries are and how long they’ve hung there.
It is also a useful introduction to the pair matching target. We’ll match sql_statement_starting and sql_statement_completed. There are a number of obvious pairs that tell us about execution, such as sp_statement, sql_batch, begin_tran, commit_tran, and sql_statement.
|
1 2 3 4 5 6 7 8 9 10 11 12 13 14 15 16 17 18 19 20 21 22 23 24 25 26 27 28 29 30 31 32 33 34 35 36 37 38 |
IF EXISTS --if the session already exists, then delete it. We are assuming you've changed something ( SELECT * FROM sys.server_event_sessions WHERE server_event_sessions.name = 'UncompletedQueries' ) DROP EVENT SESSION UncompletedQueries ON SERVER; GO CREATE EVENT SESSION UncompletedQueries ON SERVER ADD EVENT sqlserver.sql_statement_completed (ACTION ( sqlserver.session_id, sqlserver.tsql_stack, sqlserver.client_app_name, sqlserver.client_connection_id, sqlserver.database_name, sqlserver.nt_username, sqlserver.sql_text, sqlserver.username --all these are useful for tracking an error ) ), ADD EVENT sqlserver.sql_statement_starting (ACTION ( sqlserver.session_id, sqlserver.tsql_stack, sqlserver.client_app_name, sqlserver.client_connection_id, sqlserver.database_name, sqlserver.nt_username, sqlserver.sql_text, sqlserver.username --all these are useful for tracking an error ) ) ADD TARGET package0.pair_matching (SET begin_event = 'sqlserver.sql_statement_starting', begin_matching_actions = 'sqlserver.session_id, sqlserver.tsql_stack', end_event = 'sqlserver.sql_statement_completed', end_matching_actions = 'sqlserver.session_id, sqlserver.tsql_stack', respond_to_memory_pressure = 0) WITH (MAX_DISPATCH_LATENCY = 5 SECONDS, TRACK_CAUSALITY = ON, STARTUP_STATE = OFF ); ALTER EVENT SESSION UncompletedQueries ON SERVER STATE = START; |
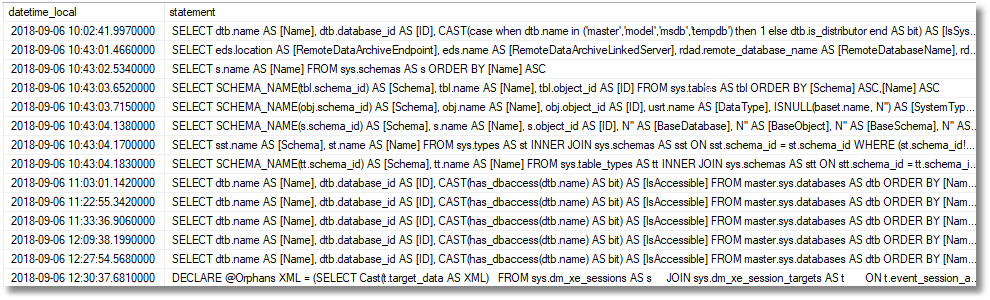
Now you can see what queries there are that are still executing or have died. Basically, all orphaned queries for which there is no matching sql_server_completed event.
|
1 2 3 4 5 6 7 8 9 10 11 12 13 14 15 16 17 18 19 20 21 22 23 24 25 26 27 28 29 30 31 |
DECLARE @target_data XML; SELECT @target_data = Cast(t.target_data AS XML) FROM sys.dm_xe_sessions AS s JOIN sys.dm_xe_session_targets AS t ON t.event_session_address = s.address WHERE s.name = 'UncompletedQueries' AND t.target_name = 'pair_matching'; -- Query the XML variable to get the Target Data SELECT CONVERT(datetime2, SwitchOffset(CONVERT(datetimeoffset,the.event_data.value('(@timestamp)[1]', 'datetime2')), DateName(TzOffset, SYSDATETIMEOFFSET()))) AS WhenStarted, DateDiff(SECOND, the.event_data.value('(@timestamp)[1]', 'datetime2'), GetUtcDate()) AS [RunTime(secs)], the.event_data.value('(action[@name="session_id"]/value)[1]', 'int') AS session_id, the.event_data.value('(@name)[1]', 'sysname') AS event_name, the.event_data.value('(data[@name="statement"]/value)[1]', 'nvarchar(max)') AS statement, the.event_data.value('(action[@name="client_app_name"]/value)[1]', 'varchar(80)') AS [App Name], the.event_data.value('(action[@name="client_connection_id"]/value)[1]', 'varchar(80)') AS connection_id, the.event_data.value('(action[@name="database_name"]/value)[1]', 'sysname') AS [Database], the.event_data.value('(action[@name="nt_username"]/value)[1]', 'sysname') AS [NT Username], the.event_data.value('(action[@name="sql_text"]/value)[1]', 'nvarchar(max)') AS [SQL Text], the.event_data.value('(action[@name="username"]/value)[1]', 'sysname') AS username, DateAdd( hh, DateDiff(hh, GetUtcDate(), CURRENT_TIMESTAMP), the.event_data.value('(@timestamp)[1]', 'datetime2') ) AS datetime_local FROM @Target_Data.nodes('//PairingTarget/event') AS the(event_data) --Excluding anything on this Session (like this query which is still running!). WHERE the.event_data.value('(action[@name="session_id"]/value)[1]', 'int') <> @@Spid ORDER BY WhenStarted; Now you can try a few long queries such as… WAITFOR Delay '00:01:00' |
… so you can see them appear and disappear.
Finding Queries That Failed to Complete Due to an Error
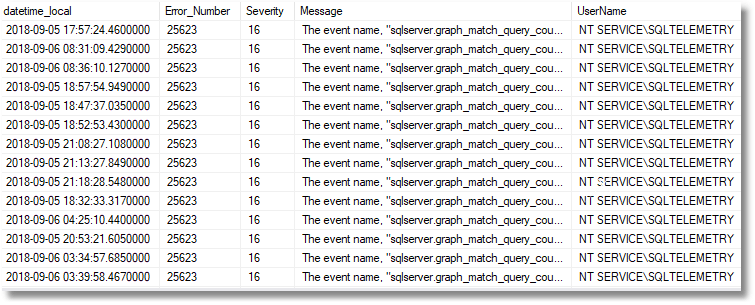
A lot of the orphaned queries from this event are simply those which have terminated with errors. If you still have your AllErrors session running at the same time as the UncompletedQueries queries session, you can relate the two with a SQL Inner join, because both of them track the client connection ID and the SQL Text.
|
1 2 3 4 5 6 7 8 9 10 11 12 13 14 15 16 17 18 19 20 21 22 23 24 25 26 27 28 29 30 31 32 33 |
--get the latest XML document for the orphans DECLARE @Orphans XML = (SELECT Cast(t.target_data AS XML) FROM sys.dm_xe_sessions AS s JOIN sys.dm_xe_session_targets AS t ON t.event_session_address = s.address WHERE s.name = 'UncompletedQueries' AND t.target_name = 'pair_matching'); --get the latest XML document for the errors DECLARE @Errors XML = (SELECT TOP 1 Cast(t.target_data AS XML) FROM sys.dm_xe_sessions AS s JOIN sys.dm_xe_session_targets AS t ON t.event_session_address = s.address WHERE s.name = 'AllErrors' AND t.target_name = 'ring_buffer' ); SELECT CONVERT(datetime2, SwitchOffset(CONVERT(datetimeoffset,Error.event_data.value('(@timestamp)[1]', 'datetime2')), DateName(TzOffset, SYSDATETIMEOFFSET()))) AS datetime_local, Error.event_data.value('(data[@name="error_number"]/value)[1]', 'int') AS [Error_Number], Error.event_data.value('(data[@name="severity"]/value)[1]', 'int') AS Severity, Error.event_data.value('(data[@name="message"]/value)[1]', 'varchar(255)') AS [Message], Error.event_data.value('(action[@name="username"]/value)[1]', 'varchar(255)') AS UserName, Error.event_data.value('(action[@name="nt_username"]/value)[1]', 'varchar(255)') AS NT_Username, Error.event_data.value('(action[@name="sql_text"]/value)[1]', 'nvarchar(max)') AS SQL_Text, Error.event_data.value('(action[@name="database_name"]/value)[1]', 'varchar(255)') AS [Database_Name], Error.event_data.value('(action[@name="client_connection_id"]/value)[1]', 'varchar(255)') AS client_conn, Error.event_data.value('(action[@name="client_app_name"]/value)[1]', 'varchar(255)') AS client_app_name FROM @Errors.nodes('//RingBufferTarget/event') AS Error(event_data) INNER JOIN @Orphans.nodes('//PairingTarget/event') AS Orphan(event_data) ON Orphan.event_data.value('(action[@name="client_connection_id"]/value)[1]', 'varchar(80)') =Error.event_data.value('(action[@name="client_connection_id"]/value)[1]', 'varchar(80)') AND Orphan.event_data.value('(action[@name="sql_text"]/value)[1]', 'nvarchar(max)') = Error.event_data.value('(action[@name="sql_text"]/value)[1]', 'nvarchar(max)') |
In this case, we can see that there is a SQL Telemetry task that is repeatedly retrying and failing to create the telemetry_XEvents task because of the event name, sqlserver.graph_match_query_count, is invalid, or the object could not be found. This now tells me why it is repeatedly vanishing.
Finding Queries That Failed to Complete but Had No Error
In fact, it is probably as interesting to see those that aren’t simple errors as well. I’ve left out most of the columns from the table to save space.
|
1 2 3 4 5 6 7 8 9 10 11 12 13 14 15 16 17 18 19 20 21 22 23 24 25 26 27 28 29 30 |
--get the latest XML document for the orphans DECLARE @Orphans XML = (SELECT Cast(t.target_data AS XML) FROM sys.dm_xe_sessions AS s JOIN sys.dm_xe_session_targets AS t ON t.event_session_address = s.address WHERE s.name = 'UncompletedQueries' AND t.target_name = 'pair_matching'); --get the latest XML document for the errors DECLARE @Errors XML = (SELECT TOP 1 Cast(t.target_data AS XML) FROM sys.dm_xe_sessions AS s JOIN sys.dm_xe_session_targets AS t ON t.event_session_address = s.address WHERE s.name = 'AllErrors' AND t.target_name = 'ring_buffer' ); --SELECT @Errors SELECT Convert(datetime2, SwitchOffset(CONVERT(datetimeoffset,Orphan.event_data.value('(@timestamp)[1]', 'datetime2')), DateName(TzOffset, SYSDATETIMEOFFSET()))) AS datetime_local, Orphan.event_data.value('(data[@name="statement"]/value)[1]', 'nvarchar(max)') AS statement FROM @Orphans.nodes('//PairingTarget/event') AS Orphan(event_data) LEFT outer JOIN @Errors.nodes('//RingBufferTarget/event') AS Error(event_data) ON Orphan.event_data.value('(action[@name="client_connection_id"]/value)[1]', 'varchar(80)') =Error.event_data.value('(action[@name="client_connection_id"]/value)[1]', 'varchar(80)') AND Orphan.event_data.value('(action[@name="sql_text"]/value)[1]', 'nvarchar(max)') = Error.event_data.value('(action[@name="sql_text"]/value)[1]', 'nvarchar(max)') WHERE Error.event_data.value('(data[@name="error_number"]/value)[1]', 'int') IS NULL ORDER BY Orphan.event_data.value('(@timestamp)[1]', 'datetime2') |
Blocking
My final example of an event isn’t that new. It simply checks for blocked and blocking processes and allows you to see each unique blocking to spot what got blocked and what did the blocking.
It is very lightly edited from the code generated by the wizard. I just selected the sqlserver.blocked_process_report and sqlserver.xml_deadlock_report
The objective is to show each blockage together with a blocked process report, together with how long the blockage has lasted.
I’ve created two blocked processes artificially by starting a query in one window
|
1 2 |
BEGIN TRANSACTION SELECT * FROM Adventureworks2016.person.person WITH (TABLOCK, XLOCK, HOLDLOCK) |
But not executing the…
|
1 |
COMMIT TRANSACTION |
Then in another browser pane, I execute…
|
1 |
SELECT * FROM Adventureworks2016.person.person |
…which is blocked by the uncommitted transaction
The events session is set up by this code
|
1 2 3 4 5 6 7 8 9 10 11 12 13 14 15 16 17 18 19 20 21 22 23 24 25 26 27 28 29 30 31 32 33 34 35 36 37 38 39 40 41 42 43 |
IF EXISTS --if the session already exists, then delete it. ( SELECT * FROM sys.server_event_sessions WHERE server_event_sessions.name = 'BlockedProcesses' ) DROP EVENT SESSION BlockedProcesses ON SERVER; GO CREATE EVENT SESSION BlockedProcesses ON SERVER ADD EVENT sqlserver.blocked_process_report (ACTION ( sqlserver.client_app_name, sqlserver.client_hostname, sqlserver.database_name, sqlserver.sql_text ) ), ADD EVENT sqlserver.xml_deadlock_report (ACTION ( sqlserver.client_app_name, sqlserver.client_hostname, sqlserver.database_name, sqlserver.sql_text ) ) ADD TARGET package0.ring_buffer (SET max_events_limit = (0), max_memory = (10240)) WITH ( MAX_MEMORY = 4096KB, EVENT_RETENTION_MODE = ALLOW_SINGLE_EVENT_LOSS, MAX_DISPATCH_LATENCY = 30 SECONDS, MAX_EVENT_SIZE = 0KB, MEMORY_PARTITION_MODE = NONE, TRACK_CAUSALITY = ON, STARTUP_STATE = ON ); GO EXEC sys.sp_configure 'show advanced options', 1; GO RECONFIGURE; GO /* Enabled the blocked process report */ EXEC sys.sp_configure 'blocked process threshold', '20'; RECONFIGURE; GO /* Start the Extended Events session */ ALTER EVENT SESSION BlockedProcesses ON SERVER STATE = START; |
And this can then be queried by code such as this
|
1 2 3 4 5 6 7 8 9 10 11 12 13 14 15 16 17 18 19 20 21 22 23 24 25 26 27 28 29 30 31 32 33 34 35 36 37 |
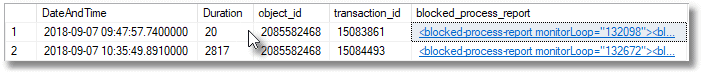
DECLARE @Target_Data XML = ( SELECT TOP 1 Cast(xet.target_data AS XML) AS targetdata FROM sys.dm_xe_session_targets AS xet INNER JOIN sys.dm_xe_sessions AS xes ON xes.address = xet.event_session_address WHERE xes.name = 'BlockedProcesses' AND xet.target_name = 'ring_buffer' ); DECLARE @reports TABLE ( DateAndTime DATETIME2, object_id INT, transaction_id INT, blocked_process_report XML ); INSERT INTO @reports (DateAndTime, object_id, transaction_id, blocked_process_report) SELECT CONVERT(datetime2, SwitchOffset(CONVERT(datetimeoffset,xed.event_data.value('(@timestamp)[1]', 'datetime2')), DateName(TzOffset, SYSDATETIMEOFFSET()))) AS datetime_local, xed.event_data.value('(data[@name="object_id"]/value)[1]', 'int') AS object_id, xed.event_data.value('(data[@name="transaction_id"]/value)[1]', 'int') AS transaction_id, xed.event_data.query('(data[@name="blocked_process"]/value/blocked-process-report)[1]') AS blocked_process_report FROM @Target_Data.nodes('//RingBufferTarget/event') AS xed(event_data); SELECT r.DateAndTime, DateDiff(SECOND, uniqueTransactions.first, uniqueTransactions.latest) AS Duration, r.object_id, r.transaction_id, r.blocked_process_report FROM @reports AS r INNER JOIN ( SELECT Max(DateAndTime) AS latest,Min(dateAndTime)AS [first], object_id, transaction_id FROM @reports GROUP BY object_id, transaction_id ) AS uniqueTransactions(latest, [first], object_id, transaction_id) ON uniqueTransactions.latest = r.DateAndTime AND uniqueTransactions.object_id = r.object_id AND uniqueTransactions.transaction_id = r.transaction_id; go |
The blocked process report, when clicked on in the results pane, gives you all the information you need about the block.
|
1 2 3 4 5 6 7 8 9 10 11 12 13 14 15 16 17 18 19 20 |
<blocked-process-report monitorLoop="132098"> <blocked-process> <process id="process1d31d207468" taskpriority="0" logused="0" waitresource="OBJECT: 6:2085582468:0 " waittime="29868" ownerId="15083861" transactionname="SELECT" lasttranstarted="2018-09-07T09:47:27.860" XDES="0x1d206071ac0" lockMode="IS" schedulerid="3" kpid="312" status="suspended" spid="54" sbid="0" ecid="0" priority="0" trancount="0" lastbatchstarted="2018-09-07T09:47:27.860" lastbatchcompleted="2018-09-07T09:47:27.857" lastattention="1900-01-01T00:00:00.857" clientapp="Microsoft SQL Server Management Studio - Query" hostname="PhilsComputer" hostpid="15904" loginname="sa" isolationlevel="read committed (2)" xactid="15083861" currentdb="1" lockTimeout="4294967295" clientoption1="671090784" clientoption2="390200"> <executionStack> <frame line="1" stmtend="90" sqlhandle="0x020000005c67aa158ea1640c6784c822b2eba355f6cd6ff70000000000000000000000000000000000000000" /> </executionStack> <inputbuf> SELECT * FROM Adventureworks2016.person.person </inputbuf> </process> </blocked-process> <blocking-process> <process status="sleeping" spid="51" sbid="0" ecid="0" priority="0" trancount="1" lastbatchstarted="2018-09-07T09:47:16.230" lastbatchcompleted="2018-09-07T09:47:19.220" lastattention="1900-01-01T00:00:00.220" clientapp="Microsoft SQL Server Management Studio - Query" hostname=" PhilsComputer" hostpid="15904" loginname="sa" isolationlevel="read committed (2)" xactid="15083830" currentdb="1" lockTimeout="4294967295" clientoption1="671090784" clientoption2="390200"> <executionStack /> <inputbuf> BEGIN TRANSACTION SELECT * FROM Adventureworks2016.person.person WITH (TABLOCK, XLOCK, HOLDLOCK) </inputbuf> </process> </blocking-process> </blocked-process-report> |
Conclusion
Extended Events can unravel and analyse complex Database development problems. The problem with many of the examples available is that they are designed for people making the transition from SQL Trace, or for people who are very familiar with the SQL Server dialect of XML. This shouldn’t put you off using XEvents. I tried to keep the event sessions relatively simple and focused on a particular purpose, and I try to reuse as much as possible from successful reports. A collection of useful XEvent session scripts should be part of the toolkit of every developer.


Load comments