Debugging in Visual Studio.NET 2005
Debugging is an important process for any level of programming to ensure programs function as expected. Most productive developer environments provide tools and utilities to assist with the debugging process. Visual Studio.NET 2005 is equipped with a number of debugger visualizers, but users can also create their own based on an individual project.
What are debugger visualizers?
Debugger visualizers are customizable visual tools that show the value of a particular object or variable during the debug process. When you hit a breakpoint in Visual Studio.NET 2005 or look through your source code, for example, you can hover the mouse over a variable or use the watch window to see the variable’s value.
In the figure below, the variable str holds the string “Hello Simple-Talk.”

Figure 1
The above debugger code display is sufficient for a simple string value. But if the string value is complex with more meaning – such as an XML fragment – or if the value is not of a string type, debugger visualizers become very useful.
Generally if while debugging you try to view the value of an XML fragment represented as a string, the developer environment will output the string representation as shown below:

Figure 2
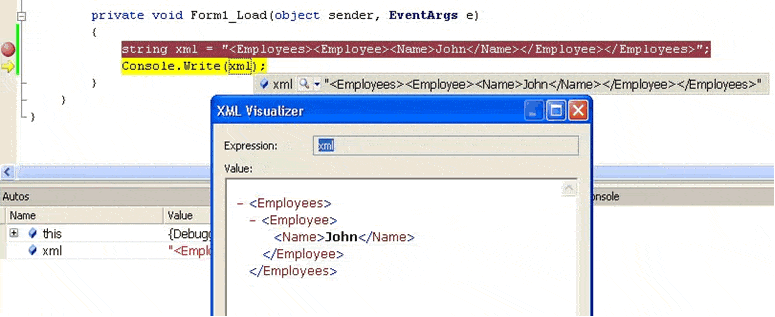
The above representation of the XML fragment as a normal string value might not be desirable, especially when debugging a very large XML fragment. A better solution would be displaying the XML fragment as nodes. This is the function of the XML debugger visualizer in Visual Studio.NET 2005. You can invoke the XML debugger visualizer by clicking on the drop-down menu item with the magnifying glass icon shown in the simple string display of the variable, then selecting the XML visualizer option.

Figure 3
The above XML debugger visualizer displays the string variable as nodes, which is easier to comprehend.
Creating a custom debugger visualizer
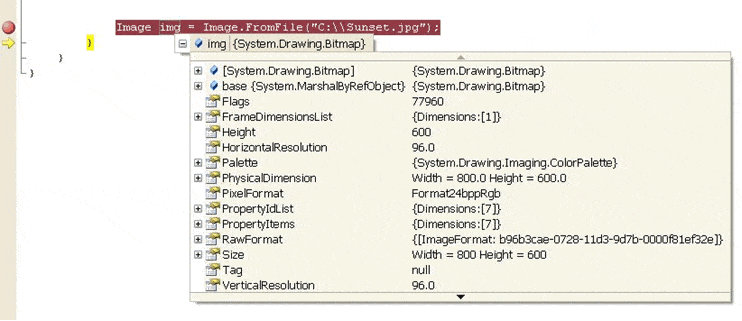
The Visual Studio.NET IDE enables you to create custom debugger visualizers. If you are debugging code and want to see the value of a variable containing an image, for example, the following string representation of the image properties will be shown:

Figure 4
Notice there is no magnifying glass icon available, indicating there are no debugger visualizers available to see an image object. You can create a simple image visualizer that will show the actual image rather than the string values of the image properties.
First, create a new class library project in Visual Studio.NET 2005 named ImageDebuggerVisualizer and rename the Class1 to ImageVisualizer. Add a new Windows form named FrmImage to the project, and add a Picture Box named PicViewer to the form. Add the following property code to FrmImage to indicate which image to display in PicViewer:
C# Code
|
1 |
public Image Picture{get { return PicViewer.Image; }set{PicViewer.Image = value;PicViewer.SizeMode = PictureBoxSizeMode.Zoom;}} |
Next modify the code of the ImageVisualizer class as follows:
C# Code
|
1 |
class ImageVisualizer : Microsoft.VisualStudio. DebuggerVisualizers.DialogDebuggerVisualizer{protected override void Show (Microsoft.VisualStudio. DebuggerVisualizers.IDialogVisualizerService windowService, Microsoft.VisualStudio.DebuggerVisualizers. IVisualizerObjectProvider objectProvider){FrmImage frm = new FrmImage();Image img = objectProvider.GetObject() as Image;frm.Picture = img;frm.ShowDialog();}} |
All debugger visualizers must inherit data from the DialogDebuggerVisualizer and override the Show method. The IVisualizerObjectProvider interface provides the GetObject method to retrieve the debugged object. In this instance we retrieve the image being debugged, and we set it to the Picture property of our form so it will be displayed in the PictureBox.
Next we need to provide details about the debugger visualizer we created in the assembly so that Visual Studio.NET 2005 IDE can identify it. Open up the AssemblyInfo.cs file and add the following code to it:
C# Code
|
1 |
[assembly: System.Diagnostics.DebuggerVisualizer(typeof(ImageDebuggerVisualizer.ImageVisualizer),Target = typeof(System.Drawing.Image),Description = "My Image Visualizer")] |
The above DebuggerVisualizer attribute specifies the type of created debugger visualizer and the type of objects – in this case Image – for which we can use it. We have also provided a description to identify our visualizer in the IDE.
The final step is deploying the newly created debugger visualizer. The image visualizer we created can be deployed either for the current logged-in user or for all users. To deploy the visualizer for the current user, copy the compiled dll into the My Documents/Visual Studio/Visualizers folder. For all users’ deployment, copy the compiled dll into the <VS.NET 2005 InstallDir>/Common7/Packages/Debugger/Visualizers folder.
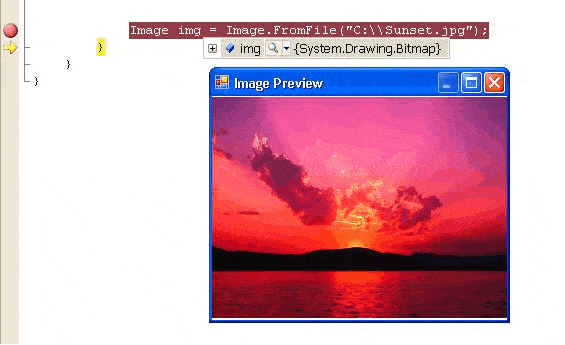
Now when you debug and come across an image variable, you will see the familiar magnifying glass icon indicating there are debugger visualizers available for the image. Click on the icon and the newly created “My Image Visualizer” appears. Clicking on the visualizer will show the image being debugged within the Windows form we created.

Figure 5
When using a debugger visualizer, the object being debugged will be serialized so it can be sent from the IDE to the debugger visualizer. Therefore the object for which you are writing the debugger visualizer should be serializable.
The ability to debug code is an important step in programming, regardless of your skills or the tools you have available. Debugger visualizers enhance the debugging process by providing ways to create your own debugger visualizers. You can create debugger visualizers to visualize anything from simple strings to complex datasets and images.


Load comments