
As application developers, we are always interested in performance. Applications today are more complex, support more users and are more essential to the daily operation of most enterprises than even a few years ago. This means that we are in a permanent state of needing better tools and better data to monitor the usage, performance and health of the applications we build. While it is still important to profile, load test and stress-test applications, we would also like to have a way to collect detailed performance data about an application while it is running in production. Why is this so? There are several good reasons.
- You gain actual data of how your application is performing in production. This data can help you to understand what features are most frequently used so you then know where to focus your future performance tuning efforts.
- You can establish a baseline of how your application performs under normal conditions. Knowing what is normal will then help you to understand when the health and performance of the application starts to trend yellow or enter red.
- When a performance problem happens, you will have the necessary detailed performance data in place to quickly diagnose it.
- You can understand usage trends that vary during the day or from day to day by instrumenting your application. The data will show if there is a certain time when usage spikes, and help you understand if you have enough capacity to handle these peak-load events.
Most applications contain very little instrumentation for usage or performance. If we are fortunate, there may be a few log statements scattered throughout the application. A better solution would be to develop a consistent approach that could be applied across the application, making sure that a baseline set of metrics is collected for each major action that the application performs. As it turns out, the design of the ASP.NET MVC framework makes this easy. This article will show how to do it.
In designing a solution, you’ll probably have these goals.
- The solution should be easy to apply across the project. If it requires a developer to do something every time that an action or controller is added, then it is doomed to failure.
- The solution should not only be easy to implement in new applications that we are creating but also easy to retrofit to existing applications.
- The code that tracks performance must be cleanly separated from the application code. It is good practice in any design to keep different concerns separated, and there is no good reason to mingle the performance tracking code with the application logic.
- Performance data should be formatted to make it easy to collect and analyze using existing toolsets. This facilitates a single view of the data across the entire technology stack and allows existing reporting and alerting tools to be used.
- Although we’d want to track data across the application, the application developer does not necessarily want to track performance in some places. So the solution should be designed to allow the developer to opt out of certain actions.
An overview of the solution is shown in the figure below.
In the ASP.NET MVC framework, custom action filters allow an application developer to intercept calls to controller actions and add pre and post processing steps to the action. In this way, action filters provide a way to implement cross cutting concerns like logging or security in a module that is defined independently of the application code. In this design, a custom action filter named MvcPerformanceAttribute is responsible for intercepting calls to controller actions and provides the entry point for where the performance of a controller action can be measured.
When an incoming request is received, the OnActionExecuting() method will create a PerformanceTracker object and attach it to request. The PerformanceTracker object is responsible for measuring how long the execution of the action takes and coordinating the update of the custom performance counters. After attaching the PerformanceTracker object to the request, the ProcessActionStart() method of the PerformanceTracker object is called to start measuring performance. After the controller action has completed, the outbound response will again pass through the MvcPerformanceAttribute, this time through the OnActionExecuted() method. This method will extract the PerformanceTracker object off of the request and call the ProcessActionComplete() method. Calling this method indicates that the performance measurement is complete and the appropriate performance counters will be updated.
Updating the custom performance counter objects is accomplished by making use of a collection of objects that derive from the PerformanceMetricBase class. These objects hold a reference to the performance counter(s) they are responsible for updating, and take care of the details of how to accomplish the update. By delegating the responsibility for the actual update of counters into a separate set of objects, the solution allows for future extensibility and keeps the process of updating the counters decoupled from the PerformanceTracker object. If a developer wishes to add an additional counter in the future, the simply write a new class that derives from PerformanceMetricBase and have it added to the collection. They do not need to edit the internals of the PerformanceTracker class.
Note: In order to better demonstrate the instrumentation framework, I’ve provided a target MVC application to which it is being applied. This can be downloaded from here, or the top of the article. The target application is the MVC Music Store developed by Jon Galloway as a tutorial on www.asp.net. The source code for this application is available on Codeplex under the Microsoft Public License (Ms-Pl). My changes are limited to converting the application to MVC 4 and integrating the instrumentation framework into it.
Credit for developing the original Music Store application belongs to Mr. Galloway and the team at www.asp.net.
Custom Performance Counters
Performance data captured by this solution will be published to a set of custom performance counters. Probably the largest advantage of doing this is that there are a number of tools available that are designed to consume performance counter data, report on it and create alerts based on it. Many operations groups will already have tooling in place to monitor performance counter data from their Windows servers or from applications such as SQL Server. Therefore, it will be very easy for these groups to now consume application-level data. This also offers the advantage of collecting data from the entire technology stack in one place. Even if your organization does not own third-party tooling, you can still use the perfmon tool built into Windows to overlay the data collected by this solution with server level data about CPU, memory and network IO.
For each application, a new multi-instance performance counter category must be created. I have provided a PowerShell script to do this which I’ll describe later. Each instance within this multi-instance category will represent an individual controller action. The instance names will be dynamically created at runtime, based on the name of the controller and the action that performance data is being tracked for. By creating instance names dynamically based on the name of the action method, no additional work is required to track the data when new controllers and actions are added to an application.
The table below lists the metrics that will be captured for each MVC action
|
Counter Name |
Description |
|
Total Calls |
The total number of times this action has been called since the ASP.NET worker process has been started |
|
Total Elapsed Time |
The total elapsed time (in milliseconds) spent in this controller action since the ASP.NET worker process started |
|
Delta Calls |
The number of times this action has been called in the last sample period. That is, if the sampling period in a tool such as perfmon is 30 seconds, this value represents that number of calls in the last 30 seconds |
|
Delta Elapsed Time |
The elapsed time (in milliseconds) spent in this action for the last sample period. That is, if the sampling period in a tool such as perfmon is 30 seconds, this value represents that number of calls in the last 30 seconds |
|
Average Time per Call |
The average amount of elapsed time taken for calls to this action in the last sample period. This value is in seconds (so 0.500 is 500 milliseconds). |
|
Calls Per Second |
The number of times that this controller action was called per second for the last reporting period |
|
Calls in Progress |
The number of requests currently executing this action. This is a point in time measurement, not an average. |
|
Last Call Elapsed Time |
The elapsed time taken by the last completed call to this action. This is a point in time measurement that represents whatever call was last completed when the counter is checked. It is not an average value. |
|
Total Exceptions Thrown |
The total number of uncaught exceptions thrown by this controller action since the ASP.NET worker process started. If the number in this counter increases, it will indicate an issue with the application’s health |
|
Delta Exceptions Thrown |
The number of uncaught exceptions thrown in the last period. Non-zero values in this counter indicate an issue with the applications health |
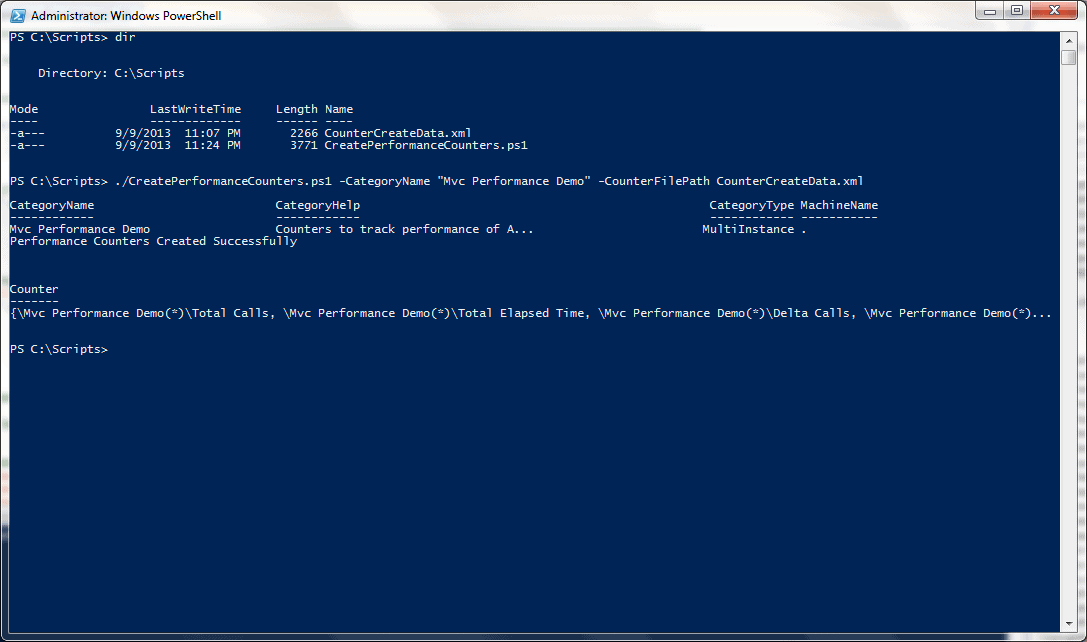
As mentioned above, the performance counter category must be created prior to running the application. You will need administrator-level permissions to create performance counters, so be sure to run the included PowerShell script, CreatePerformanceCounters.ps1 as an administrative user. The PowerShell script takes two argu ments, the name of the performance counter category and the name of an XML file that contains data about what counters to create. If additional counters are ever added to the solution, then the included XML file should be updated so that these counters are created. An example of running the script is shown below. (click on the image to see it full-size)
Creating the Custom Action Filter
The next step in the solution is the MvcPerformanceAttribute class. This class extends System.Web.Mvc. ActionFilterAttribute and overrides the OnActionExecuting() and OnActionExecuted() methods. Let’s take a look at the implementation of the OnActionExecuting() method to describe what is happening.
|
1 2 3 4 5 6 7 8 9 10 11 12 13 14 15 16 17 18 19 20 21 22 23 24 25 26 27 28 29 30 31 32 33 |
public override void OnActionExecuting(ActionExecutingContext filterContext) { // First thing is to check if performance is enabled globally. If not, return if ( ConfigInfo.Value.PerformanceEnabled == false) { return; } // Second thing, check if performance tracking has been turned off for this action // If the DoNotTrackAttribute is present, then return ActionDescriptor actionDescriptor = filterContext.ActionDescriptor; if (actionDescriptor.GetCustomAttributes(typeof(DoNotTrackPerformanceAttribute), true).Length > 0 || actionDescriptor.ControllerDescriptor.GetCustomAttributes( typeof(DoNotTrackPerformanceAttribute), true).Length > 0) { return; } // ActionInfo encapsulates all the info about the action being invoked ActionInfo info = this.CreateActionInfo(filterContext); // PerformanceTracker is the object that tracks performance and is attached to the request PerformanceTracker tracker = new PerformanceTracker(info); // Store this on the request String contextKey = this.GetUniqueContextKey(filterContext.ActionDescriptor.UniqueId); HttpContext.Current.Items.Add(contextKey, tracker); // Process the action start - this is what starts the timer and increments any // required counters before the action executes tracker.ProcessActionStart(); } |
The first responsibility of this method is to determine whether performance is being tracked on this controller action. First, it checks a Singleton class called ConfigInfo to see if performance is enabled on an application-wide basis. This call will return false if the ConfigInfo class is not able to find the name of the performance counter category in the Web.Config file or if the category name that is present has not been created on the server. In these cases, the application is not properly configured to track performance, so there is no point in continuing. In this case, this method simply returns.
While it is possible to apply the MvcPerformance attribute to individual controllers and actions, it is more likely that the filter will be registered globally in the GlobalFilterCollection, thereby applying to all actions throughout an application. A developer may want to have some actions opt out of having their performance tracked. The solution to this problem was inspired by an MSDN Blog post by Rick Anderson (Securing your ASP.NET MVC 3 application). A second Attribute class is defined, DoNotTrackPerformanceAttribute. The code above checks to see if this second attribute has been placed on either the action or the controller. If it has, then this action will be excluded from performance tracking. In this way, an application developer has very fine grain control over what methods are included and excluded for performance tracking.
If both of the checks described above pass, then performance should be tracked on this controller action. A helper method is used to create an ActionInfo object, which is an object that encapsulates all of the information about the controller action that is being called. The code then creates the PerformanceTracker object, which is the object with primary responsibility for tracking the performance of the controller action. Each request that performance is being measured for will have an associated PerformanceTracker object, and the associated PerformanceTracker object will need to be retrieved again in the OnActionExecuted() method after the controller action completes. For this reason, the PerformanceTracker object is stored in the Items dictionary of the current HttpContext object. The Items dictionary on HttpContext is designed to be used when data needs to be shared between different Http handlers and modules during a request. The key that is used is based on the full name of the attribute type and the ASP.NET generated unique id for the method. By combining these elements together, we should be safe from any key collisions with other modules that use the Items dictionary. Finally, the ProcessActionStart() method of the PerformanceTracker object is called.
The code for the ProcessActionStart() method of the PerformanceTracker is shown below.
|
1 2 3 4 5 6 7 8 9 10 11 12 13 14 15 16 17 18 19 20 21 22 23 24 25 26 27 28 29 |
internal void ProcessActionStart() { try { // Use the factory class to get all of the performance metrics that are being tracked // for MVC Actions this.performanceMetrics = PerformanceMetricFactory.GetPerformanceMetrics(actionInfo); // Iterate through each metric and call the OnActionStart() method // Start off a task to do this so it can it does not block Task t = Task.Factory.StartNew(() => { foreach (PerformanceMetricBase m in this.performanceMetrics) { m.OnActionStart(); } }); this.stopwatch = Stopwatch.StartNew(); } catch (Exception ex) { String message = String.Format("Exception {0} occurred PerformanceTracker.ProcessActionStart(). Message {1}\nStackTrace {0}", ex.GetType().FullName, ex.Message, ex.StackTrace); Trace.WriteLine(message); } } |
The first thing to note about the code is that everything is wrapped within a try-catch block. If an exception is thrown, we want the exception to be logged to the tracing framework (or another logging framework) so we can troubleshoot why we are not receiving any data. We do not want the exception to bubble up and cause an application error, making this one of the few times where it is probably the right choice to swallow an exception. The code then uses thePerformanceMetricFactory class to get a List of PerformanceMetricBase objects. Each PerformanceMetricBase object encapsulates the logic needed to update one or more performance counters. The code iterates through each one of these objects and calls its OnActionStart() method. As its name implies, OnActionStart() gives a PerformanceMetricBase object the opportunity to update any performance counters at the beginning of the controller action call, such as incrementing the counter that tracks how many calls are in progress.
Finally, a Stopwatch object from the System.Diagnostics namespace is created and started to track the amount of elapsed time it takes to execute the action method. The reference to the Stopwatch object, as well as a reference to the List of PerformanceMetricBase objects are held as member variables within the PerformanceTracker object so they are available for when the OnActionExecuted() method is invoked.
After the controller action finishes, the OnActionExecuted() method of the MvcPerformanceAttribute class will be executed. The code for this method is shown below.
|
1 2 3 4 5 6 7 8 9 10 11 12 13 14 15 16 17 18 19 20 21 22 23 |
public override void OnActionExecuted(ActionExecutedContext filterContext) { // This is the unique key the PerformanceTracker object would be stored under String contextKey = this.GetUniqueContextKey(filterContext.ActionDescriptor.UniqueId); // Check if there is an object on the request. If not, must not be tracking performance // for this action, so just go ahead and return if (HttpContext.Current.Items.Contains(contextKey) == false) { return; } // If we are here, we are tracking performance. Extract the object from the request and // call ProcessActionComplete to stop the stopwatch and update the performance metrics PerformanceTracker tracker = HttpContext.Current.Items[contextKey] as PerformanceTracker; if (tracker != null) { bool exceptionThrown = (filterContext.Exception != null); tracker.ProcessActionComplete(exceptionThrown); } } |
The first responsibility of this method is the determine if performance is being tracked on controller action. It does so by checking the Items dictionary on the HttpContext object. The presence of a PerformanceTracker object indicates performance is being tracked while the absence of the object in the dictionary indicates performance is not being tracked. If performance is being tracked, this method gets a reference to the PerformanceTracker object and calls ProcessActionComplete(). Passed to the ProcessActionComplete() method is a flag of whether an unhandled exception occurred during the processing of this controller action. This value of this flag is determined by examining the Exception property in the ActionExecutedContext object passed to this method.
The code for ProcessActionComplete() is shown below.
|
1 2 3 4 5 6 7 8 9 10 11 12 13 14 15 16 17 18 19 20 21 22 23 24 25 |
internal void ProcessActionComplete(bool unhandledExceptionFlag) { try { // Stop the stopwatch this.stopwatch.Stop(); // Iterate through each metric and call the OnActionComplete() method // Start off a task to do this so it can it does not block Task t = Task.Factory.StartNew(() => { foreach (PerformanceMetricBase m in this.performanceMetrics) { m.OnActionComplete(this.stopwatch.ElapsedTicks, unhandledExceptionFlag); } }); } catch (Exception ex) { String message = String.Format("Exception {0} occurred PerformanceTracker.ProcessActionComplete(). Message {1}\nStackTrace {0}", ex.GetType().FullName, ex.Message, ex.StackTrace); Trace.WriteLine(message); } } |
As with the ProcessActionStart() method, all of the code is wrapped within a try catch block to prevent exceptions in the performance framework from causing an error in the application. This method first calls the Stop() method on the stopwatch and then iterates through each of the PerformanceMetricBase objects, calling their OnActionComplete() method. There are two arguments passed to OnActionComplete(). One is the flag of whether or not an unhandled exception occurred while processing the controller action. The other is the number of elapsed ticks from the stopwatch object which represents the elapsed time the controller action took to be executed. This value is passed as the number of ticks because it is the number of ticks that is required by the average timer performance counter, which will give us the average time a method took to execute over a period of time. If other PerformanceMetricBase objects need this value in milliseconds, it can be easily converted to milliseconds. Finally, as shown above, the OnActionComplete() methods of the PerformanceMetricBase objects are run in a separate task in order to minimize any impact on page response time.
PerformanceMetricBase objects and the PerformanceMetricFactory
The task of updating the actual performance counters is delegated to objects that extend from the PerformanceMetricBase class. These objects serve as an intermediary between thePerformanceTracker objectand any performance counters that need to be updated. While it would be possible to write the PerformanceTracker class to directly update the necessary performance counters, factoring this code out into a separate set of objects allows the PerformanceTracker object to focus on managing the entire process of measuring performance on the controller action and leave the details of how to update the counters to the PerformanceMetricBase objects. This results in a more loosely couple design and allows for future extension. If we ever want to add additional performance metrics, this can be done by simply writing a new class that extends PerformanceMetricBase and leaves the code in PerformanceTracker undisturbed.
Each child class that extends PerformanceMetricBase is responsible for updating the values that correspond to one of custom performance counters defined in the table at the beginning of this article. As such, each of these classes will contain a member variable holding a reference to the System.Diagnostics.PerformanceCounter object(s) they are responsible for updating. Generally this is a single System. Diagnostics. Performance Counter object. However, some counters require not just the target counter to be updated, but also a base counter. Internally, the performance counter system uses both of these values to calculate the actual result. A counter that measures the average time of an operation is such an example. Therefore, the AverageCall TimeMetric class contains member variables for both the timer counter and the base counter.
The PerformanceMetricBase provides two virtual methods, OnActionStart() and OnAction Complete() where child classes are able to perform updates to performance counters. Child implementations need to override at least one or can override both of these methods. The CallsInProgressMetric is an example of a class that overrides both methods by incrementing, and then decrementing, the “Calls in Progress” counter. Updating of a performance counter is accomplished by the use of the Increment(),IncrementBy(), Decrement() methods and the RawValue property on the PerformanceCounter class. The Increment(),IncrementBy() and Decrement()methods all use an internal locking process to keep these methods safe for multithreaded and multiprocess scenarios. The RawValue property does not contain any mechanisms to ensure thread safety, so it is only appropriate to use where it is OK to only have access to the last update. An example of this is the “Last Call Elapsed Time” counter, which is intended to just overwrite whatever value was in the counter previously.
|
1 2 3 4 5 6 7 8 9 10 11 12 13 14 15 16 17 18 19 20 21 22 23 24 25 26 27 28 29 30 31 32 33 34 35 36 37 38 39 40 41 42 43 44 45 46 47 48 49 50 51 52 53 54 55 56 57 |
/// <summary> /// Performance Metric that updates the counters that track the average time a method took /// </summary> public class AverageCallTimeMetric : PerformanceMetricBase { public AverageCallTimeMetric(ActionInfo info) : base(info) { String categoryName = this.actionInfo.PerformaneCounterCategory; String instanceName = this.actionInfo.InstanceName; this.averageTimeCounter = this.InitializeCounter(categoryName, COUNTER_NAME, instanceName); this.baseCounter = this.InitializeCounter(categoryName, BASE_COUNTER_NAME, instanceName); } /// <summary> /// Constant defining the name of the average time counter /// </summary> /// <remarks> /// This is the counter name that will show up in perfmon /// </remarks> public const String COUNTER_NAME = "Average Time per Call"; /// <summary> /// Constant defining the name of the base counter to use /// </summary> public const String BASE_COUNTER_NAME = "Average Time per Call Base"; #region Member Variables private PerformanceCounter averageTimeCounter; private PerformanceCounter baseCounter; #endregion /// <summary> /// Method called by the custom action filter after the action completes /// </summary> /// <remarks> /// This method increments the Average Time per Call counter by the number of ticks /// the action took to complete and the base counter is incremented by 1 (this is /// done in the PerfCounterUtil.IncrementTimer() method). /// </remarks> /// <param id="elapsedTicks"">A long of the number of ticks it took to complete the action</param> public override void OnActionComplete(long elapsedTicks, bool exceptionThrown) { this.averageTimeCounter.IncrementBy(elapsedTicks); this.baseCounter.Increment(); } // Dispose method not shown for brevity } |
The PerformanceTracker object uses the GetPerformanceMetrics() method of the Performance Metric Factory class to get a list of the performance metric objects that will be updated for a controller action. The GetPerformanceMetrics() is passed an ActionInfo object, which it used as a key to look for the corresponding PerformanceMetricBase objects in an internal dictionary. If the ActionInfo object is found in the dictionary, then the a reference to the existing PerformanceMetricBase objects is returned. If not, PerformanceMetricFactory will create the appropriate PerformanceMetricBase objects, store a reference to the collection and return them. This means any time a particular controller action is invoked, the same set of Performance Metric Base objects are used. It also makes clear what the true role of a Performance Metric Base object is, and that is encapsulate access to a custom performance counter for a given controller action.
What About Web API?
No discussion would be complete without mentioning how the same strategy can be used to track the performance of Web API controller actions. As it turns out, the Web API actions are processed in a very similar fashion as calls to ASP.NET MVC actions. One primary difference is that custom action filters extend from the System.Web. Http.Action FilterAttribute class rather than the System.Web. Mvc.Action FilterAttribute class. As such, the OnActionExecuting() and OnActionExectured() methods are also passed slightly different objects. Therefore, the solution defines a second performance attribute, WebApi Performance Attribute that can be used to track performance of Web API actions in the same way. This attribute will pass a String to the ActionInfo class to indicate that the action being tracked is a Web API action, but otherwise it functions exactly the same way as its MVC counterpart.
The other difference is that the HttpActionContext and HttpActionExecutedContext objects passed to OnActionExecuting() and OnActionExecuted() contain a property named Request, which exposes an HttpRequestMessage object representing the request. This object exposes a dictionary through its Properties object, and in this case, it is this dictionary used to store the reference to the PerformanceTracker object during the request lifecycle.
There is one special case to be aware of when using Web API. If a controller action throws an exception of the Type HttpResponseException, then the OnActionExecuted() method of the WebApi Performance Attribute will still be executed and process as normal. However, theException property of the HttpAction Executed Context object passed to the OnActionExecuted() method will be null. Therefore, any performance-tracking that depends on a reference to the exception will not work. In this solution, that means that neither the TotalExceptions ThrownMetric or DeltaExceptionsThrownMetric will increment their respective counters in this case.
Integrating Performance Tracking Into a Web Application
One of the design criteria laid out at the beginning of this article was to design a solution which was easy to implement across an application. By using a custom action filter, we can add the filter to all actions in an application by simply adding the action to theGlobalFiltersCollection on application startup in the Global.asax file. The code below shows such an implementation where the MvcPerformance filter is added just after the HandleError attribute.
|
1 2 3 4 5 6 |
public static void RegisterGlobalFilters(GlobalFilterCollection filters) { filters.Add(new HandleErrorAttribute()); filters.Add(new MvcPerformanceAttribute()); } |
If you do not wish to apply the attribute globally, you can also decorate actions or controllers of interest with the appropriate attribute.
|
1 2 3 4 5 6 7 8 9 10 |
[MvcPerformance] public ActionResult Index() { // Get most popular albums var albums = GetTopSellingAlbums(5); return View(albums); } |
If performance is being tracked at a global level, you can use the DoNotTrackPerformanceAttribute to opt out of performance tracking by decorating the action in a similar fashion
|
1 2 3 4 5 6 7 8 |
[DoNotTrackPerformance] public ActionResult Index() { // Get most popular albums var albums = GetTopSellingAlbums(5); return View(albums); } |
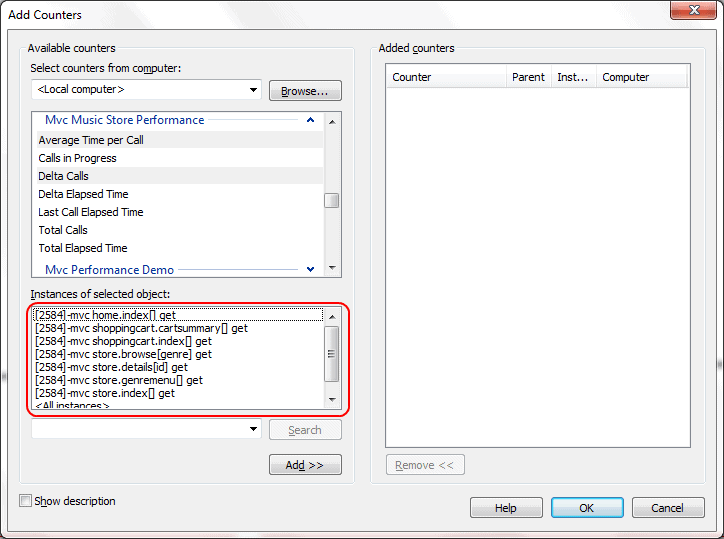
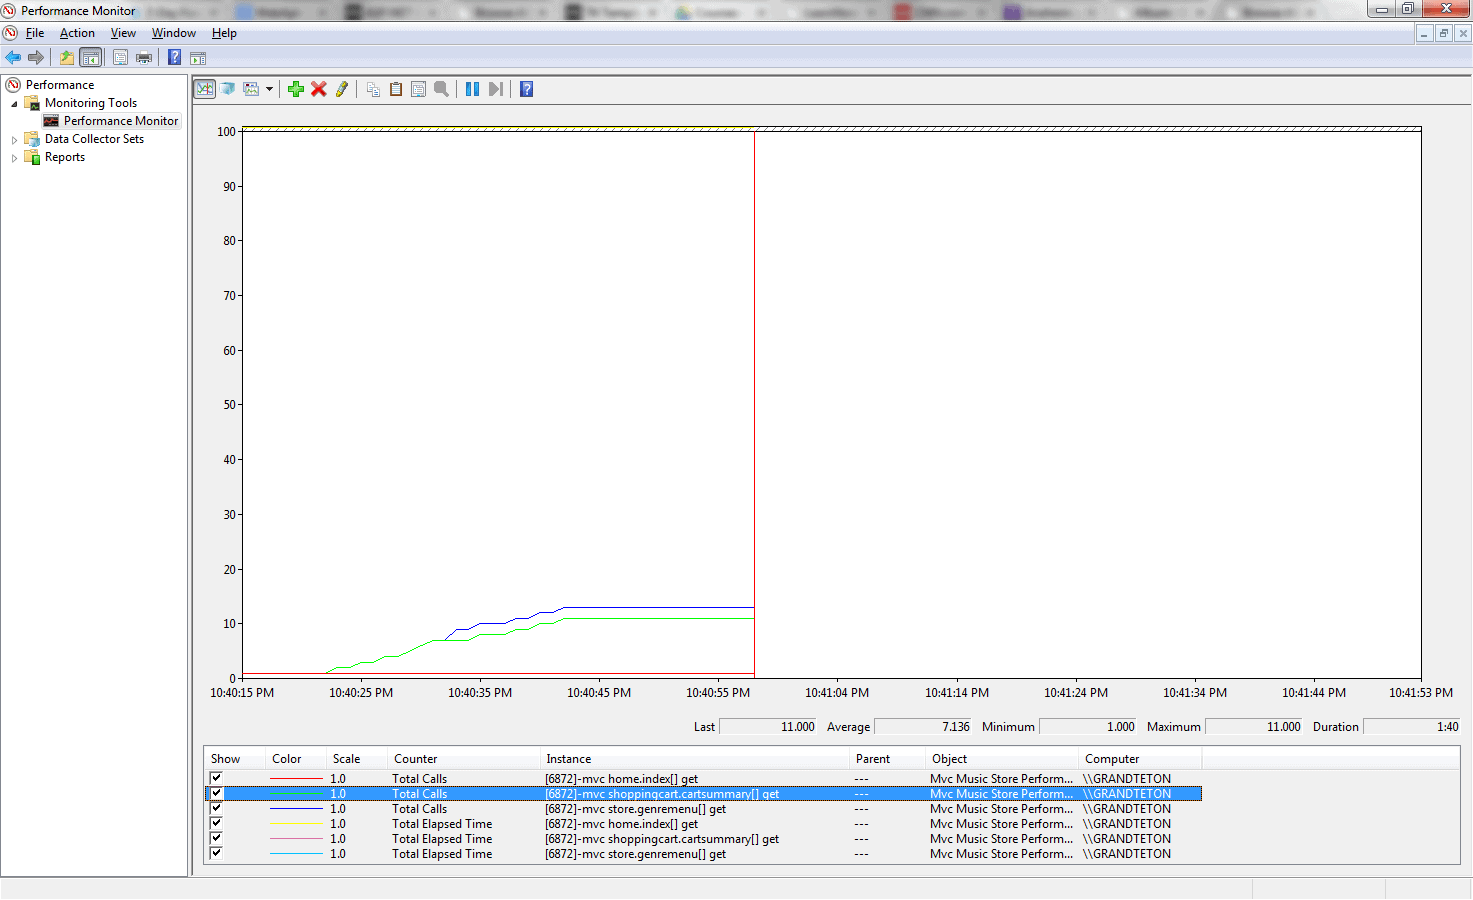
Once the application is redeployed, you can check that data is being collected by using Windows perfmon and selecting the counters of interest. (click on the image to see it full-size)
Summary
By using custom action filters and performance counters, any ASP.NET MVC or Web API application can be instrumented to track performance. The solution is easy to add to any MVC-based web application, and the code that tracks performance is cleanly separated from the application logic. By using performance counters, the data can be easily consumed by a variety of tools to support reporting and alerting needs. Because it is so simple to integrate performance-tracking into your MVC applications, you will always have data to guide your tuning efforts and diagnose performance issues as they arise.
References and Further Reading
- An Introduction to Performance Counters by Michael Groeger, http://www.codeproject.com/Articles/8590/An-Introduction-To-Performance-Counters
- Action Filtering in ASP.NET Applications, http://msdn.microsoft.com/en-us/library/dd410209(v=vs.100).aspx
- MVC Music Store Tutorial by Jon Galloway, http://www.asp.net/mvc/tutorials/mvc-music-store
- MVC Music Store Code Download, http://mvcmusicstore.codeplex.com/
- Securing Your MVC3 Application by Rick Anderson, http://blogs.msdn.com/b/rickandy/archive/2011/05/02/securing-your-asp-net-mvc-3-application.aspx
Load comments