
Have you ever had one of your users ask you to slow your website down? Has someone ever complained to you that they didn’t have a long enough wait before a web page in your application loaded? No, it is very unlikely. Whether your users are internal or external to your organization, they expect the web sites that they use to perform well.
This infographic at Kiss Metrics reports that 47% of e-commerce site users expect a page to load within 2 seconds, and the slower the page loads, the more likely that the customer will abandon the site altogether. It is not just the website performance of e-commerce sites that matters: Often, nowadays, your website is the first impression that customers, partners or potential employees get of your company. Whenever we use a web site, we form perceptions of the company that the website belongs to. These perceptions are based on a broad range of characteristics such as the aesthetics of the site and how easily we are able to navigate the site to find the information or perform the transaction we need to; however the performance of the site matters as well. Imagine that you visit a website and you have to wait ten seconds for each page on the site to load. Regardless of the quality of the product or service that company is offering, your perception of that product and the company won’t be helped by the slow load times you have to endure on their web site.
These challenges are not just limited to e-commerce sites or sites on the public internet. Most enterprise applications today are built as web applications. A one second delay may not seem like very much, but these seconds add up for the hundreds of users who may be accessing your web application throughout the day as part of their work. These delays affect how fast your users can perform tasks and serve your customers. Slow, inefficient web pages ultimately show up as lost productivity for your users.
Components of Website Performance
You can divide web performance into two main areas; backend performance and frontend performance.
Backend Performance
When you navigate to a web page, the browser sends a request to a web server for that page. When the web server receives that request, it most often times needs to dynamically construct at least some of the content on that page. The time within which the server can create this content and return it to the browser is a measure of the backend performance of the page. The efficiency of your database queries, the time it takes to complete any web service calls and the performance of your C# or VB.NET code (if you are using ASP.NET) all contribute to this backend performance.
Frontend Performance
The second area of performance deals with what must happen within the browser in order to render a web page for the user. Not only must the HTML of the page be downloaded, but the browser must also download all of the other assets needed by the page, including CSS, JavaScript and images used on the page. Finally, the browser must then take all of this information and layout the page for the user. This is the front-end performance of the page.
We will use the example of loading the homepage for simple-talk.com to demonstrate the difference between the frontend and backend performance of a web page.
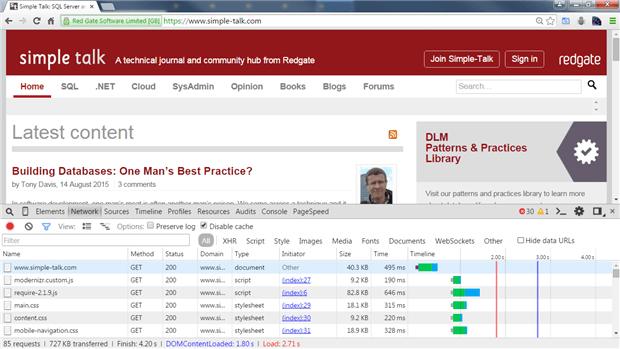
We see that it took a total of 495 milliseconds to download the HTML for the homepage of simple-talk.com. If we click on the first row in the table (the one labeled www.simple-talk.com) and move over to the timing tab, we can see a breakdown of the timing for this resource.
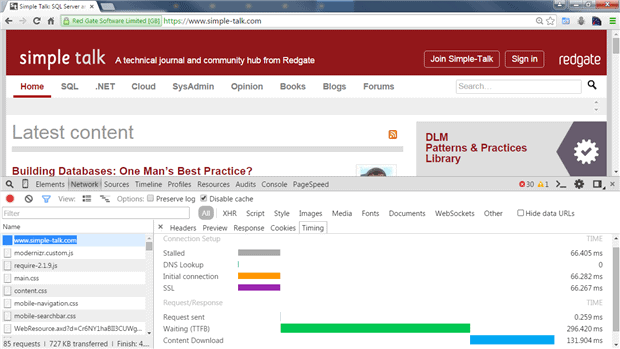
We want to pay particular attention to the value labeled “Waiting (TTFB)”. This figure includes the amount of time it took to process the request on the web server as well as the amount of time it took for the HTTP request to travel over the network. In this instance, this value is 296 ms, so we know that our web server was relatively fast in handling our request.
By capturing a video of the website as it loaded, I was able to measure the time it took from when I entered the URL into my browser until the point in time where the browser started rendering the page to the screen and also until the page was visually complete for “above the fold” content. After 1.97 seconds, the browser started rendering the page to the screen and at the 2.4 second mark, I had a visually complete page on my screen.

We need to understand the difference between the two metrics, one that told us how long it took for the initial HTML page to load (495 ms) and the other that told us how long before the page was visually complete and ready for the user to interact with it (2.4 seconds), as it is this difference that represents the frontend performance of the web page. Many articles on Simple Talk over the years have focused on the backend (server and database) components of performance. We can see from this example that the frontend aspects are also important, and can often account for a much larger portion of the time that the user spends waiting for the web page to be rendered. So let’s understand what is happening during this time interval between the point when the HTML for our page has been downloaded and when the page has been rendered to the user.
The majority of this time is needed for the browser to download all of the other assets needed for our page. This includes all of the CSS, JavaScript, fonts and images that are used by the page. With the advent of highly interactive web applications, we are downloading more of these types of files than ever, especially JavaScript files. And it simply takes time for the browser to download these additional assets needed by a web page.
The browser also spends time laying out and rendering the page to the user. Web layout is a dynamic process that depends on other factors such as the screen resolution of the user viewing the page. Upon downloading and parsing all of the HTML and CSS for your page, the browser has to go through this layout process and calculate the size and position of all of the elements within the page so that the page can be rendered. As such, the order in which we load certain resources turns out to be very important so these calculations can start as soon as possible.
As I will soon explain, the homepage for Simple-Talk.com can be improved. However, a web page that renders to the user in 2.4 seconds is actually fairly reasonable. It is quite typical to find web pages that take several seconds for the browser to download the required assets and layout the page, with the result that the user sees an empty or incomplete page for an extended period of time. The data from Kiss Metrics should be enough to convince you that we can, and must, minimize the amount of time that the user has to wait to view our pages. To do this effectively, we need to understand the factors that contribute to the frontend performance of our web pages and learn how to identify and correct frontend performance issues when they appear.
What Drives Frontend Performance?
We’ve touched on a couple of the factors that determine how quickly a web page can be rendered to a user, but let’s take a few minutes to understand these more in depth.
Page Size
First and foremost, the total size of a web page and all of its assets determines how quickly your page can be downloaded and rendered to a user. For any website on the public internet we must assume that the user is connecting over what is, relatively speaking, a slow network connection. Broadband connections vary widely depending on where you are, but still only average 5 Mbps worldwide. (https://www.akamai.com/us/en/about/news/press/2015-press/akamai-first-quarter-2015-state-of-the-internet-report.jsp). Connection speeds from mobile networks are even slower, often around 4 Mbps or less; and these numbers generally represent best case scenarios, not when the network is congested during peak usage in the evening due to all of your neighbors streaming their favorite shows from Netflix.
Connections Speeds Around The World
How fast is the average Internet connection speed in the country you live in? The Akami State of the Internet Report provides the answers.
When a user visits our site for the very first time, they have to download each and every file that makes up the page in order to render the page to the browser: Every byte of JavaScript, CSS and images on your page has to travel down this network connection. From a development perspective, we have to understand that the amount of network bandwidth between the browser and web server is our most limited resource, so we need to do everything we can to reduce the number of bytes that need to be sent to the browser for our page. This means that we need to make sure that HTTP compression is enabled and properly configured for our web server, that we are instructing the browser to cache static files and that we have properly scaled and optimized our images so they are as small as possible. Lightening up our web page will help it load faster for our users.
If you are developing line-of-business applications in a corporate environment, you may be tempted into thinking that all of your user’s have fast network connections, so the size of your pages is not the most important factor. However, you may have some branch offices with slower network connections. Furthermore, today we are seeing more and more remote workers than ever before, and these workers are probably connected over a VPN connection using a standard broadband Internet connection. So for your page to remain fast for these users, the overall page size remains an important consideration.
Number of Network Requests
We also need to be concerned about the total number of requests that the browser must make to the server in order to render a page. Just as you would expect, the more requests a browser must make, the longer a web page takes to load and render to the user.
Every request sent from the browser to the web server will experience network latency. Simply put, it takes time for a network packet to travel from its source to its destination. The further geographically you are from the web server, the longer it takes each of your HTTP requests to travel over the network to the server. In addition, mobile networks tend to incur higher amounts of network latency than a traditional broadband connection. The latency that occurs on each request acts like a small delay. For pages that have to make hundreds of requests for all of the assets necessary to render the page, all of these small delays can add up to a noticeable one.
By using techniques such as bundling of CSS and JavaScript resources and CSS sprites to combine images, we can combine multiple files into a single file, reducing the overall number of files the browser has to download. Reducing the number of downloads reduces the total amount of network latency experienced by the page. By making fewer requests that are somewhat larger in size, we can improve how quickly our web pages load.
Ordering of Components within your web page
The order in which your CSS and JavaScript resources appear in your web page matter when it comes to how fast the browser can render your pages. We want all of our CSS resources to appear in the document head and all of our JavaScript to be located at the end of the document, right before the closing body tag. Why this is?
Before the browser can lay out your webpage, it needs to have finished loading all of the CSS for the page. Therefore, we want to make sure that our all of our CSS resources are located in the document head so they will load early on in our page load lifecycle. Once the browser has all the HTML parsed and all of the CSS loaded, it can lay out the page and start to render something to the screen. And once again, we want this to occur as soon as possible to give some visual cues to the user that something is indeed happening on our website.
JavaScript on the other hand should always come at the end of the document, right before the closing body tag. Numerous examples show script tags being placed in the document head, but this is the incorrect approach from a performance perspective. One characteristic that all browsers share is that they will not render any DOM element located below a <script> tag until the contents of that script tag has been loaded and parsed. So by having JavaScript elements in the document head, you are actually introducing a blocking operation into the page rendering process. In all cases, it will take some time to download and parse JavaScript, so placing JavaScript anywhere other than the end of the document introduces some delay to the user. And if for any reason your JavaScript takes a long time to download, perhaps due to a slow network connection, your user could be staring at a blank browser window for what seems like an age.
Analyzing Your Pages
Fortunately today, we have free tools that can allow us to quickly analyze a web page for performance best practices and give us a report card on the items that need to be fixed. The first of these tools is Google PageSpeed Insights (https://developers.google.com/speed/pagespeed/insights/). PageSpeed Insights can analyze any site that is publicly accessible on the Internet. A sample output from the analysis is shown below.
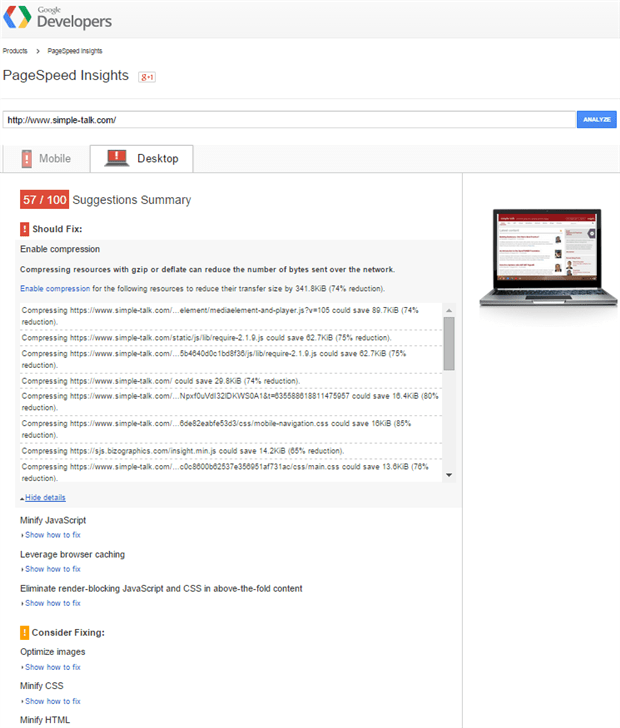
As you can see, each recommendation is marked as having a high, medium or low impact of the performance of the page. Clicking into each recommendation also provides you with additional details about why PageSpeed Insights is giving you that recommendation.
A similar tool is YSlow (http://yslow.org/) which was originally developed by the Yahoo! Exceptional Performance Team. YSlow contains a more extensive set of rules than PageSpeed Insights and is available as a browser extension for Chrome, Firefox, Safari and Opera. Since YSlow runs in your browser, it can also be used to analyze pages located behind your firewall.
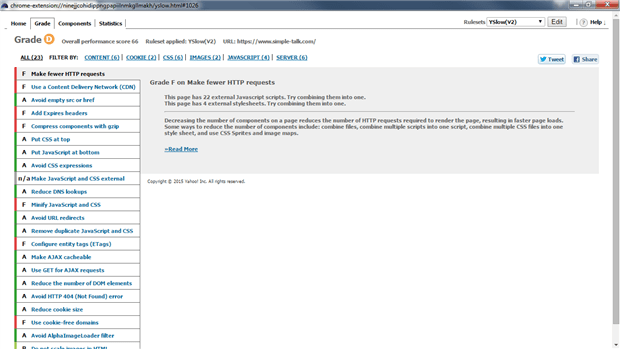
Which tool you end up using is a matter of personal preference, but what is important is to know of the existence of these tools and use them to analyze the pages on your website on a regular basis. While it is possible to produce a checklist of performance best practices, these tools have already done that for you, and they tell you exactly what areas to focus on in order to improve the performance of your pages. They also each give you an overall page score, which serves as an overall barometer for the efficiency of your page and that you can track to make sure you don’t see a significant degradation when changes are made to your site.
Optimizing Your Pages
After analyzing your pages, you may want to learn about the recommendations that are being made and their impact on performance. Both PageSpeed Insights and YSlow offer very good documentation which explains why a recommendation was made and how it impacts page performance.
- https://developers.google.com/speed/docs/insights/rules
- https://developer.yahoo.com/performance/rules.html
Some of the most common recommendations and how to address them are listed below:
Enable Compression – By compressing the data sent over the network, you can greatly reduce the amount of network bandwidth your page uses. In IIS, compression of static content (HTML, CSS, JavaScript) is enabled by default but to compress dynamic content like JSON or XML, you must install the dynamic compression module in IIS
Cache Static Resources – Resources like images, CSS and JavaScript change relatively infrequently, so you can save significant bandwidth by instructing the browser to cache these resources. You can add a snippet similar to the following to a web.config file.
|
1 2 3 4 5 |
<system.webServer> <staticContent> <clientCache cacheControlMode="UseMaxAge" cacheControlMaxAge="90.00:00:00" /> </staticContent> </system.webServer> |
This will instruct IIS to cache all static files in this directory and all subdirectories for the time specified, in this case 90 days. By having separate web.config files for each directory, you can effectively define different caching policies for each directory tree.
Bundle and Minify CSS and JavaScript – Minification is the process of stripping out all the extra whitespace and comments from a CSS or JavaScript file so that the smallest possible syntactically correct file is sent to the browser. Bundling is the process of combing multiple files together so the browser only has to make one request for a bundle of files instead of several requests for individual files. ASP.NET 4.5 has bundling and minification built in. If you are on an older version of ASP.NET, a library called Cassette provides much the same functionality. What is even better about these libraries is that they will automatically add the appropriate headers to your bundles so the browser will cache these resources and will also add a SHA1 hash to the URL for the bundle, so should you ever update your CSS or JavaScript, the browser will know to fetch the new version.
Optimize Images – Images are often the largest assets on a web page. First, make sure the dimensions of the image you send to the browser is no larger than the size the image will display on your page. If an image has a size of 300×300 pixels on your page, send an image of 300×300 pixels. A larger image will take more bandwidth to send and just be scaled to the smaller size in the browser anyway.
Second, use tools like PNG Crush or Kraken.io to apply lossless compression to your images and reduce their file size. For JPEG images, a slight change in the quality setting can dramatically decrease the file size with only slight visual differences.
Place All CSS Files and <style> Tags in the Document Head – Before the browser can layout the page, it must download all of the CSS files for the page. Therefore, we want to load our CSS as early as possible, so CSS should be in the document head.
Put JavaScript at the Bottom of the Page – a browser will not render any DOM element below a <script> tag until the script referenced in the tag has been downloaded and parsed. Therefore, we want to move all of our JavaScript to the end of the document just before the closing <body> tag so that our page can render as soon as possible and is not delayed waiting for a JavaScript file to be loaded.
Summary
To create web sites that are quick and responsive, we must consider both frontend and backend performance issues. For frontend performance issues, tools like PageSpeed Insights and YSlow can quickly help us how well our pages follow known best practices for performance. Further, these tools tell us exactly where our greatest opportunities for improvement are, all in the matter of a few seconds. Given the how easy these tools are to use, there is really no reason not to make regular use of these tools to make sure that the pages in your website load as quickly as possible for your users.
This document contains proprietary information and is protected by copyright law.
Copyright © 2026 Red Gate Software Limited. All rights reserved
Load comments