
.NET’s garbage collector has been sold to us as the end of explicit memory management, and of memory leaks, in Windows applications: the idea is that, with a garbage collector running in the background, developers no longer need to worry about the need to manage the life-cycle of the objects they create – the garbage collector will take care of them once the application has finished with them.
The reality is more complicated than this, however. The garbage collector certainly solves the most common leaks in unmanaged programs – those caused by developers forgetting to release memory when they have finished with it. It also solves the related problem of memory being released too soon, but the way in which this is solved can lead to memory leaks when the garbage collector has a different opinion to the developer about whether or not an object is still ‘live’ and able to be used. Before fixing these problems, you need some understanding of how the collector works.
How the Garbage Collector works
How, then, does the garbage collector achieve its magic? The basic idea is pretty simple: it examines how objects are laid out in memory and identifies all those objects that can be ‘reached’ by the running program by following some series of references.
When a garbage collection starts, it looks at a set of references called the ‘GC roots’. These are memory locations that are designated to be always reachable for some reason, and which contain references to objects created by the program. It marks these objects as ‘live’ and then looks at any objects that they reference; it marks these as being ‘live’ too. It continues in this manner, iterating through all of the objects it knows are ‘live’. It marks anything that they reference as also being used until it can find no further objects.
An object is identified, by the Garbage Collector, as referencing another object if it, or one of its superclasses, has a field that contains the other object.
Once all of these live objects are known, any remaining objects can be discarded and the space re-used for new objects. .NET compacts memory so that there are no gaps (effectively squashing the discarded objects out of existence) – this means that free memory is always located at the end of a heap and makes allocating new objects very fast.
GC roots are not objects in themselves but are instead references to objects. Any object referenced by a GC root will automatically survive the next garbage collection. There are four main kinds of root in .NET:
A local variable in a method that is currently running is considered to be a GC root. The objects referenced by these variables can always be accessed immediately by the method they are declared in, and so they must be kept around. The lifetime of these roots can depend on the way the program was built. In debug builds, a local variable lasts for as long as the method is on the stack. In release builds, the JIT is able to look at the program structure to work out the last point within the execution that a variable can be used by the method and will discard it when it is no longer required. This strategy isn’t always used and can be turned off, for example, by running the program in a debugger.
Static variables are also always considered GC roots. The objects they reference can be accessed at any time by the class that declared them (or the rest of the program if they are public), so .NET will always keep them around. Variables declared as ‘thread static’ will only last for as long as that thread is running.
If a managed object is passed to an unmanaged COM+ library through interop, then it will also become a GC root with a reference count. This is because COM+ doesn’t do garbage collection: It uses, instead, a reference counting system; once the COM+ library finishes with the object by setting the reference count to 0 it ceases to be a GC root and can be collected again.
If an object has a finalizer, it is not immediately removed when the garbage collector decides it is no longer ‘live’. Instead, it becomes a special kind of root until .NET has called the finalizer method. This means that these objects usually require more than one garbage collection to be removed from memory, as they will survive the first time they are found to be unused.
The Object Graph
Taken as a whole, memory in .NET forms a complicated, knotted graph of references and cross-references. This can make it difficult to determine the amount of memory used by a particular object. For instance, the memory used by a List<X> object is quite small, as the List<X> class only has a few fields. However, one of these is the array of objects in the list: this can be quite large if the list has many entries. This is almost always exclusively ‘owned’ by the list, so the relationship is fairly simple: The total size of the list is the size of the small initial object and the large array it references. The objects in the array could be another matter entirely, though: it’s possible that there could be some other path through memory through which they could be reached. In this case, it doesn’t make sense to count them as part of the ‘size’ of the list as they would remain even if the list ceased to exist, but neither does it make sense to count them via the alternative path – they’d remain if that was removed as well.
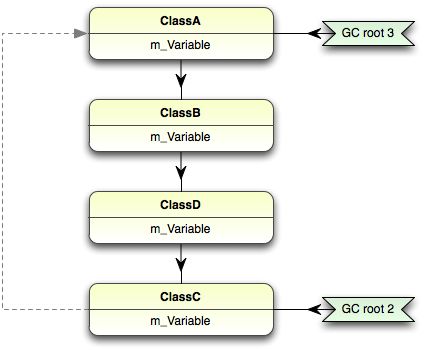
Things become even more confusing when circular references come into play.
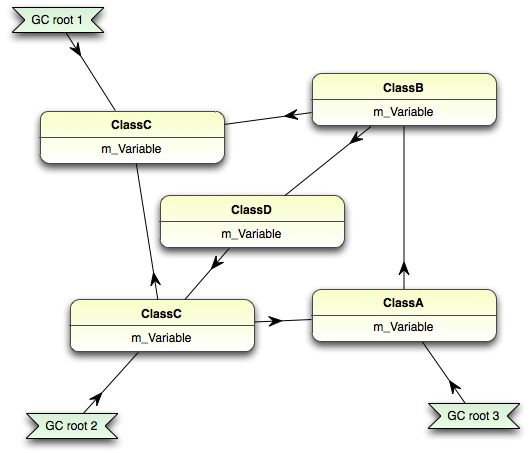
When developing code, it’s more usual to think of memory as being organized into a more easily understood structure: a tree starting at individual roots:
Thinking in this way does, indeed, make it easier (or indeed possible) to think about how objects are laid out in memory. This is also how data is represented when writing the program or using a debugger, but this makes it easy to forget that an object can be attached to more than one root. This is usually where memory leaks in .NET come from: the developer forgets, or doesn’t ever realize, that an object is anchored to more than one root. Consider the case shown here: setting GC root 2 to null will not actually allow the garbage collector to remove any objects, which can be seen from looking at the complete graph but not from the tree.
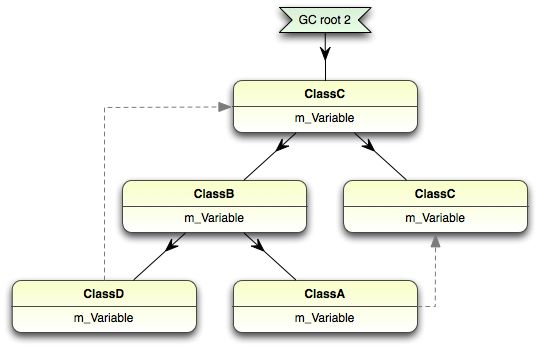
A memory profiler makes it possible to view the graph from another perspective, as a tree rooted at an individual object and following the references backwards to put the GC roots at the leaves. For the ClassC object referenced by root 2, we can follow the references backwards to get the following graph:
Thinking in this way reveals that the ClassC object has two ultimate ‘owners’, both of which must relinquish it before the garbage collector can remove it. Any of the links between GC root 3 and the object can be broken in order to remove it once GC root 2 has been set to null.
This situation can arise easily in practical .NET applications. The most common one is that a data object becomes referenced by an element in the user interface, but isn’t removed when the data has been finished with. This situation isn’t quite a leak: the memory will be reclaimed when the UI control is updated with new data, but can mean that the application uses much more memory than would be expected. Event handlers are another common cause: it’s easy to forget that an object will last at least as long as the objects which it receives events from, which is forever in the case of some global event handlers such as those in the Application class.
Real applications, especially those with user interface components, have much more complicated graphs than this. Even something as simple as a label in a dialog box can be referenced from a huge number of different places…
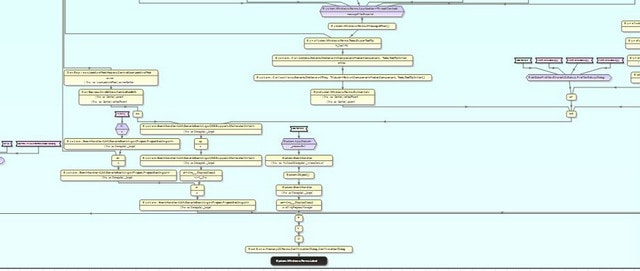
It’s easy to see how the occasional object can become lost in this maze.
Limits of the Garbage Collector
Unused objects that are still referenced
The biggest limitation of the garbage collector in .NET is a subtle one: while it is sold as being able to detect and remove unused objects, it actually finds unreferenced objects. This is an important distinction: an object might never be referred to by a program ever again; but, while there is some path from it leading to an object that might still be used, it will never be released from memory. This leads to memory leaks; in .NET these occur when an object that will not be used again remains referenced.
The source of these leaks can be hard to detect, though the symptoms of rising memory usage are obvious. It’s necessary to determine which unused objects are remaining in memory, and then trace the references to find out why they are not being collected. A memory profiler is essential for this task: By comparing memory states while a leak is occurring, it is possible to find the troublesome unused objects, but no debugger can trace object references backwards.
The garbage collector is designed to deal with resources that are plentiful – that is, where it doesn’t matter when the object is released. On modern systems, memory falls into that category (it doesn’t matter when it’s reclaimed, just so long as it’s done in time to prevent a new allocation failing). There are still resources that don’t fall into this category: file handles need to be closed quickly to avoid causing sharing conflicts between applications, for example. These resources cannot be completely managed by the garbage collector, and so .NET provides the Dispose() method along with the using() construct for objects that manage these resources. In these cases the scarce resources used by the object are released quickly by the implementation of the Dispose method, but the much less critical memory is released later by the garbage collector.
Dispose means nothing special to .NET, so disposed objects must still be de-referenced. This makes objects that have been disposed but have not been reclaimed good candidates for the source of a memory leak.
Fragmentation of the Heap
A less widely known limitation in .NET is that of the large object heap. Objects that become part of this heap are never moved by the runtime, and this can lead to a program running out of memory prematurely. When some objects live longer than others, this causes the heap to form holes where objects used to be – this is known as fragmentation. The problem occurs when the program asks for a large block of memory but the heap has become so fragmented that there is no single region of memory big enough to accommodate it. A memory profiler can estimate the largest object that can be allocated by a program: if this is declining then this is likely to be the cause. An OutOfMemoryException caused by fragmentation will typically happen when the program apparently has a lot of free memory – on a 32-bit system, processes should be able to use at least 1.5Gb, but failures due to fragmentation will often start to occur before it is using that much memory.
Another symptom of fragmentation is that .NET will often have to keep the memory used by the empty holes allocated to the application. This causes it to apparently use much more memory than it needs when viewed in Task Manager. This effect is usually relatively harmless: Windows is quite good at realising that the memory occupied by the holes is not being used and will page it out, and if the fragmentation is not worsening then the program won’t run out of memory. It doesn’t look good to the user, though, who will probably think that the application is wasteful and ‘bloated’. This is often what is happening when a profiler shows that the objects allocated by a program are only using a small amount of memory but Task Manager shows that the process is occupying a large amount of space.
Performance of the Garbage Collector
In terms of performance, the most important characteristic of a garbage collected system is that the garbage collector can start executing at any time. This makes them unsuited for situations where timing is critical, as the timing of any operation can be thrown off by the operation of the collector.
The .NET collector has two main modes of operation: concurrent and synchronous (sometimes known as workstation and server). Concurrent garbage collection is used in desktop applications and synchronous is used in server applications such as ASP.NET by default.
In concurrent mode, .NET will try to avoid stopping the running program while a collection is in progress. This means that the total amount that the application can get done in a given period of time is less but the application won’t pause. It’s good for interactive applications where it’s important to give the impression to the user that the application is responding immediately.
In synchronous mode, .NET will suspend the running application while the garbage collector is running. This is actually more efficient overall than concurrent mode – garbage collection takes the same amount of time, but it doesn’t have to contend with the program continuing to run – but means that there can be noticeable pauses when a full collection has to be done.
The type of garbage collector can be set in the configuration file for the application if the default isn’t suitable. Picking the synchronous collector can be useful when it’s more important that an application has a high throughput instead of appearing responsive.
In large applications, the number of objects that the garbage collector needs to deal with can become very large, which means it can take a very long time to visit and rearrange all of them. To deal with this, .NET uses a ‘generational’ garbage collector, which tries to give priority to a smaller set of objects. The idea is that objects created recently are more likely to be released quickly, so a generational garbage collector prioritises them when trying to free up memory, so .NET first looks at the objects that have been allocated since the last garbage collection and only starts to consider older objects if it can’t free up enough space this way.
This system works best if .NET can choose the time of collection itself, and will be disrupted if GC.Collect() is called, as this will often cause new objects to become old prematurely, which increases the likelihood of another expensive full collection in the near future.
Classes with finalizers can also disrupt the smooth operation of the garbage collector. Objects of these classes can’t be removed immediately: they instead go to the finalizer queue and are removed from memory once the finalizer has been run. This means that any object they reference (and any object referenced by those, and so on) has to be kept in memory at least until this time as well and will require two garbage collections before the memory becomes available again. If the graph contains many objects with finalizers, this can mean that the garbage collector requires many passes to completely release all of the unreferenced objects.
There is a simple way to avoid this problem: implement IDisposable on the finalizable classes, move the actions necessary to finalize the object into the Dispose() method and call GC.SuppressFinalize() at the end. The finalizer can then be modified to call the Dispose() method instead. GC.SuppressFinalize() tells the garbage collector that the object no longer needs to be finalized and can be garbage collected immediately, which can result in memory being reclaimed much more quickly.
Conclusion
It becomes easier to understand memory and performance problems in an application if you take time to understand how the garbage collector works. It reveals that, while .NET makes the burden of memory management lighter, it does not completely eliminate the need to track and manage resources. It is, however, easier to use a memory profiler to diagnose and fix problems in .NET. Taking account of the way .NET manages memory early in development can help reduce problems, but even then such problems can still arise because of the complexity of the framework or third-party libraries.
This document contains proprietary information and is protected by copyright law.
Copyright © 2026 Red Gate Software Limited. All rights reserved
Load comments