
When Visual Studio isn’t available – on a production server, analyzing a crash dump, or debugging a process remotely – you can use Microsoft’s free debugging tools: WinDbg (graphical debugger), CDB (command-line debugger), and SOS.dll (a .NET-specific extension that understands managed code). These tools let you attach to running processes, set breakpoints on module loads, inspect the managed heap, view CLR call stacks, and analyze exceptions. This guide walks through the debugging landscape from MSIL compilation to machine code, then demonstrates a practical debugging session using CDB and SOS to diagnose a caught exception.
Introduction
There will come a time that any developer will need to debug an application and will not have access to Visual Studio or, in some cases, even the source code. When debugging a problem on a production web or application server, for example, I really do not want to have to install Visual Studio and copy across all my source code; it just isn’t practical, or sometimes even allowed. It is at times like this that we need another tool, a tool for debugging windows applications, and it just so happens that Microsoft provides a range of such debuggers, which are ideally suited to this type of situation. In this article I am going to explain what debuggers are available, and how you can use them to simplify the process of debugging a .NET application in situations where Visual Studio isn’t either practical or available.
In this article I am going to explain what debuggers are available, and how to debug a simple, fairly common example. I hope this will show how it is possible to debug your code in a simple straightforward way.
Why bother?
On the whole, if you are working at your developer machine and are able to reproduce the reported issue, then it is easiest to do your debugging in Visual Studio. However, as I hinted in the introduction, there are many reasons why you cannot always use Visual Studio, and why you should learn and understand the alternatives:
- Visual Studio Crashes – while not a common occurrence, every developer knows that VS sometimes crashes, and often when you need it most. WinDBG / cdb do occasionally crash but rarely and if they do have issues it is pretty simple to download an older or newer version that should be fine..
- Speed – if you are in a hurry and you just want to see something quickly, then starting up cdb takes a fraction of the time it takes to start Visual Studio, and has a significantly smaller footprint.
- Control – the debugging tools provide a wide range of commands and options that allow fine-grained control of the debugging process. For example, you can set a break point on a particular module being loaded, or make changes to the application’s data and code (i.e. you can apply a one- time only patch to your application at run time!).
- Free – the debuggers and SOS are free, you can download them from the Microsoft site and they are updated fairly regularly. As such they make very useful alternatives when Visual Studio is unavailable.
- Crash Dumps – it is simple to create and to view crash dumps, so you can get a dump from a customer or only interrupt service on your live applications briefly while you take a snapshot of it for subsequent debugging. You can debug dumps taken from any of the common tools like DrWatson, ADPlus and Debug Diag .
- SOS includes various helper functions – these allow you to debug .NET deadlocks and list all the objects in memory whilst being able to find what created them to track down memory leaks.
- Remote debugging is significantly simpler – just install on the server and client the remote.exe that comes with the tools and you are ready.
- X64 support – there are no problems debugging X64 applications using the debugging tools, whereas there are issues using Visual Studio to do this.
Meet the debuggers
There are two types of debuggers: kernel and user-mode. Kernel debuggers are used to debug drivers and the Windows kernel. User-Mode debuggers are used for applications and services. We are interested in user-Mode debuggers of which there are two in the Windows debugging toolkit: WinDbg, which is GUI based (with a circa 1990’s interface) and cdb, which is a command line tool.
Both of these debuggers provide a wrapper around dbgEng.dll, which actually does the debugging. The commands and responses are the same from all debuggers so just choose which tool you like and stick to that. I prefer cdb because I like the fact that it only gives you a prompt back when it is ready to accept input. WinDbg, on the other hand, offers such things as stack and variable windows and lets you happily type away before it is ready. The debuggers are assembly debuggers. They let you control the process you are investigating, set break points, and view threads and variables in assembly code. This means that you need to debug and understand machine code, calling conventions, stacks, heaps and memory and so on. The debuggers provide the symbols from your source code in the assembly language, which allow you to get line locations and view different structures and classes but it is still fairly complicated. Even when you have symbols, you have to ensure they are compiled with the executable otherwise they will not match and will give you strange results.
Luckily this nightmare can be averted to an extent because some nice people in Microsoft decided to help the developer community and ship a helper DLL with the .NET framework, sos.dll. It is amazing how appropriate that name really is. This DLL can be loaded by any of the debuggers mentioned above, and understands how the CLR works. All .NET programs provide a wealth of information at run time which we can take advantage of, at least compared with native applications, so .NET debugging really is very simple.
Taking the time now to understand a few simple procedures really will pay dividends and, if you are anything like me, you will think that debugging without VS really is pretty cool and helps you gain a thorough understanding of how the .NET framework actually works.
The Debugging Landscape
Before we delve into how to actually debug code, it is important to understand what happens when you run a .NET application:
- .NETcode is written in a number of languages: C#, VB.NET or any other CLI-compliant language.
- This code is compiled into a common MSIL format
- At runtime, or if NGEN’d, MSIL is compiled to binary instructions for the CPU architecture that it is running on (JITed) , and then executed
By way of an example, let’s take a look at some C# code that performs some looping and then outputs some text, and see how the code looks as it is transformed into MSIL then into machine code. I have highlighted the areas which match in each format.
- C# Code
1234567static void DoSomething(){for (int i = 0; i < 10; i++){Console.WriteLine(String.Format("Number: {0}", i));}}
- MSIL Version:
12345678910111213141516171819202122232425262728293031.method private hidebysig static void DoSomething() cil managed{// Code size 43 (0x2b).maxstack 2.locals init ([0] int32 i,[1] bool CS$4$0000)IL_0000: nopIL_0001: ldc.i4.0IL_0002: stloc.0IL_0003: br.s IL_0021IL_0005: nopIL_0006: ldstr "Number: {0}"IL_000b: ldloc.0IL_000c: box [mscorlib]System.Int32IL_0011: call string [mscorlib]System.String::Format(string,object)IL_0016: call void [mscorlib]System.Console::WriteLine(string)IL_001b: nopIL_001c: nopIL_001d: ldloc.0IL_001e: ldc.i4.1IL_001f: addIL_0020: stloc.0IL_0021: ldloc.0IL_0022: ldc.i4.s 10IL_0024: cltIL_0026: stloc.1IL_0027: ldloc.1IL_0028: brtrue.s IL_0005IL_002a: ret} // end of method Program::DoSomething
- Bytes that the CPU understands, i.e. machine code:
155 8b ec 83 ec 18 83 3d 14 2e 92 00 00 74 05 e8 c5 a3 f4 76 33 d2 89 55-fc c7 45 f8 00 00 00 00 90 33 d2 89 55 fc 90 eb 41 90 b9 38 2b 33 79 e8 40 1f 79 fd 89 45 f4 8b 05 30 20 fb 01 89 45 ec 8b 45 f4 8b 55 fc 89 50 04 8b 45 f4 89 45 e8 8b 4d ec 8b 55 e8 e8 ee 72 13 76 89 45 f0 8b 4d f0 e8 cb 36 61 76 90 90 ff 45 fc 83 7d fc 0a 0f 9c c0 0f b6 c0 89 45 f8 83-7d f8 00 75 ac 90 8b e5 5d c3
The debuggers decode the bytes and display the assembly, as shown below. This is a little cryptic at first, but is still much more readable than the machine code you see in step 3. You’ll notice that the second column shows the bytes as listed above, 55 8b ec…
|
1 2 3 4 5 6 7 8 9 10 11 12 13 14 15 16 17 18 19 20 21 22 23 24 25 26 27 28 29 30 31 32 33 34 35 36 37 38 39 40 41 42 43 44 |
031800a8 55 push ebp 031800a9 8bec mov ebp,esp 031800ab 83ec18 sub esp,18h 031800ae 833d142e920000 cmp dword ptr ds:[922E14h],0 031800b5 7405 je 031800bc 031800b7 e8c5a3f476 call mscorwks!JIT_DbgIsJustMyCode (7a0ca481) 031800bc 33d2 xor edx,edx 031800be 8955fc mov dword ptr [ebp-4],edx 031800c1 c745f800000000 mov dword ptr [ebp-8],0 031800c8 90 nop 031800c9 33d2 xor edx,edx 031800cb 8955fc mov dword ptr [ebp-4],edx 031800ce 90 nop 031800cf eb41 jmp 03180112 031800d1 90 nop 031800d2 b9382b3379 mov ecx,offset mscorlib_ni+0x272b38 (79332b38) (MT: System.Int32) 031800d7 e8401f79fd call 0091201c (JitHelp: CORINFO_HELP_NEWSFAST) 031800dc 8945f4 mov dword ptr [ebp-0Ch],eax 031800df 8b053020fb01 mov eax,dword ptr ds:[1FB2030h] ("Number: {0}") 031800e5 8945ec mov dword ptr [ebp-14h],eax 031800e8 8b45f4 mov eax,dword ptr [ebp-0Ch] 031800eb 8b55fc mov edx,dword ptr [ebp-4] 031800ee 895004 mov dword ptr [eax+4],edx 031800f1 8b45f4 mov eax,dword ptr [ebp-0Ch] 031800f4 8945e8 mov dword ptr [ebp-18h],eax 031800f7 8b4dec mov ecx,dword ptr [ebp-14h] 031800fa 8b55e8 mov edx,dword ptr [ebp-18h] 031800fd e8ee721376 call mscorlib_ni+0x1f73f0 (792b73f0) (System.String.Format(System.String, System.Object), mdToken: 060001bd) 03180102 8945f0 mov dword ptr [ebp-10h],eax 03180105 8b4df0 mov ecx,dword ptr [ebp-10h] 03180108 e8cb366176 call mscorlib_ni+0x6d37d8 (797937d8) (System.Console.WriteLine(System.String), mdToken: 060007c8) 0318010d 90 nop 0318010e 90 nop 0318010f ff45fc inc dword ptr [ebp-4] 03180112 837dfc0a cmp dword ptr [ebp-4],0Ah 03180116 0f9cc0 setl al 03180119 0fb6c0 movzx eax,al 0318011c 8945f8 mov dword ptr [ebp-8],eax 0318011f 837df800 cmp dword ptr [ebp-8],0 03180123 75ac jne 031800d1 <?XML:NAMESPACE PREFIX = SKYPE /> 03180125 90 nop 03180126 8be5 mov esp,ebp 03180128 5d pop ebp 03180129 c3 ret |
When debugging without Visual Studio, the important thing to realize is that the code you are looking at is no longer in the CLI language in which it was written. It has been optimized, pruned and changed into something that the CPU can understand. Although this sounds a little scary, believe me when I say that debugging at this level, using SOS, is easy and fun.
Read also:
Sandcastle documentation for .NET projects
SQL Server deadlock debugging
Let’s do some debugging
In order to debug code at this level, it helps to know the basics of assembly language. While you are starting out, you can get by without it, but the more you learn about assembly language, process architecture, and the CLR, the faster and easier you will find debugging.
I have written a test console application with some examples to work through. We will be using the first test, which causes an exception to be thrown that is caught by an empty catch block. When you were to start the example1.exe application, and press 1 followed by enter, you would see the menu being re-printed and it will look like nothing has really happened but , in fact, an exception is being thrown, caught and swallowed. The code that is doing the swallowing looks like this:
|
1 2 3 4 5 6 7 8 9 10 |
try { AppSettingsReader asr = new AppSettingsReader(); string date = asr.GetValue("DateFormat", typeof (string)).ToString(); RunCommand(date); }catch(Exception) { //HA HA HA No one can hear you scream in here!!!!!! } |
When faced with this situation, we need to attach a debugger. If you haven’t already got the debuggers, then please go ahead and download the debugging tools for windows. I always install mine to c:\debuggers for ease of use, but install them wherever you like.
I also create a batch file, doDebug.cmd, to set my symbol path and add cdb to the path variable so I don’t have to type in c:\debuggers every time:
|
1 |
SET _NT_SYMBOL_PATH=srv*c:\debuggers\symbols*http://msdl.microsoft.com/download/symbols; SET PATH=%PATH%;c:\debuggers |
Creating this file, and changing c:\debuggers to whatever your debugger path is, will save you work.
Read also: PowerShell automation for debugging workflows
Stacks and Exceptions
So let’s start the example1.exe application. If you are running the Visual Studio solution, make sure you start the application by choosing “Start without debugging” or, alternatively, double clicking the example1.exe. if you choose option 1 when it is running, the menu will be shown again and it will look like nothing has happened.
From a command prompt, run the doDebug.cmd file to set your environment variables and then type “cdb -pn example1.exe“. This will start cdb and instructs it to attach to a process called example1.exe. Another common way to start cdb is to issue the command “cdb -p 1234“, which attaches to the pid 1234. You can attach to any process or service running on the server; if a process is in task manager then it is fair game, but you will need to be an admin or have debugger user privileges:
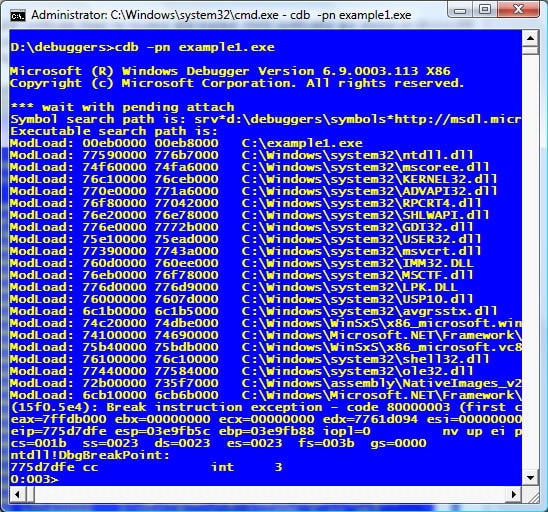
This starts cdb, stops the example1.exe application from running, and awaits your command. Type g and then enter, in order to run the process being debugged. Now, choose option 1 again in the example program and, within cdb, you should see the message:
|
1 |
"(b18.7a4): CLR exception - code e0434f4d (first chance)" |
This means that there was a first chance CLR exception. When debugging, the debugger encounters exceptions before the application hits them. If the debugger allows the application to proceed, and the latter correctly handles the exception, then the application will continue to run normally. If the application does not handle the exception, the debugger sees it a second time, at which point it is termed a ‘second chance’ exception, and the application will crash (if allowed to proceed). In our example, we have a try … catch block that quietly handles the exception and reports nothing to the front end.
Let’s now break into the debugger. Set the focus on cbd and do ctrl+c to bring up the command prompt. We want to get the debugger to break when it gets a first chance exception, specifically a CLR exception, so type “sxe e0434f4d". The sxe command (be careful when reading this command out loud!) instructs the debugger to stop execution on encountering an exception ,and the code that follows it is the one from the output above. Press g and enter to run the debugger and then choose number 1 again in the example app.
Now the debugger should break at the point of the exception, so here we go with some real debugging. The sos.dll is our saviour in these situations, but first need to load it up, so type “.loadby SOS mscorwks” (note the full stop before loadby).
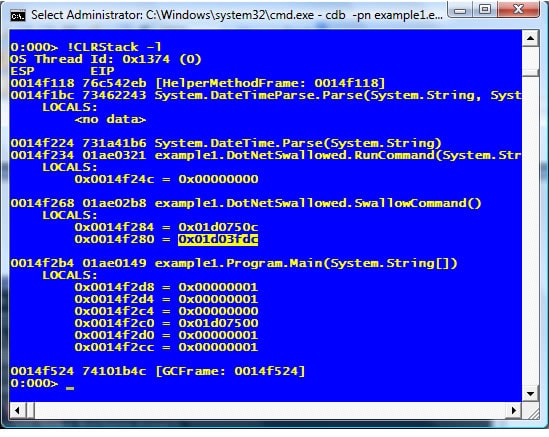
This should give no errors and return you to the prompt. Let’s now take a look at the managed stack trace, If you enter "!CLRStack” (it is case sensitive), you should see something like this:
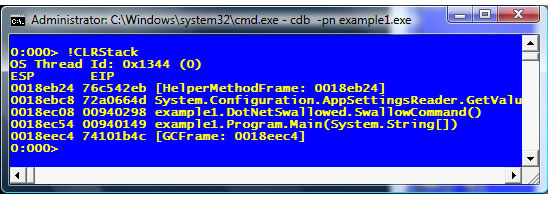
The memory addresses will probably be different but the stack trace should be the same. This tells us where the exception occurred. Excellent! Now we need to see the exception. There are a number of ways to find the exception: Because we instructed the debugger to cease running the application when an exception is thrown, we can use the command “!pe” to print the most recent exception on the current thread. If you go ahead and run “!pe” you should see:
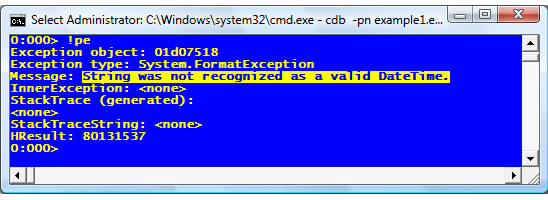
This shows that we are getting an invalid DateTime format and, together with the !CLRStack output, we know that we are in “DateTime.Parse” , so the root cause of the problem is beginning to get a little clearer. Let’s do another stack trace, but this time we will add "-p“, i.e. “!CLRStack -p“, which shows the parameters passed in:
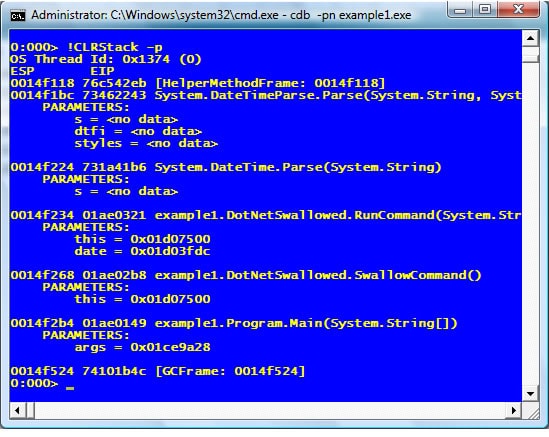
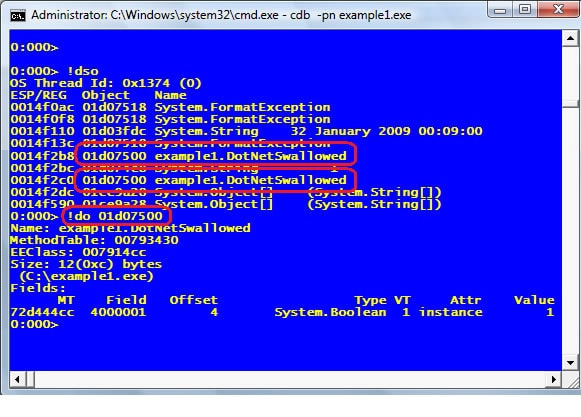
Unfortunately, sometimes, we don’t get as much help as we would like, and in this case we don’t see the value of the parameters. However, there is a more scatter-gun approach to finding parameters and it is to use “!DumpStackObjects” (!dso for short), which will walk the stack and dump any objects it finds:
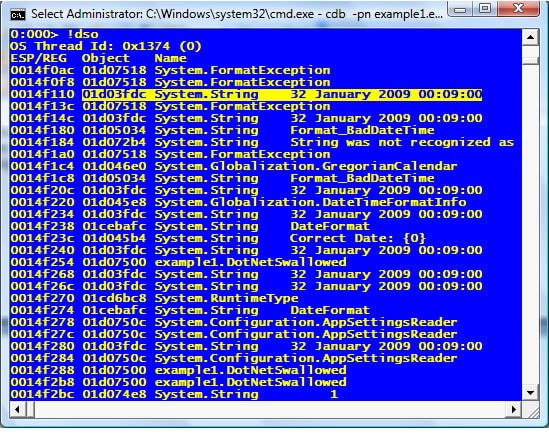
You will see, at the top of the screen, that we get the Exception object and then a String, which looks like it contains an invalid date format, “32 January 2009“. Bingo! If we now execute “!CLRStack -l“, the debugger will list the memory addresses of all the variables. We can look through these to find which method has a local variable which points to our string. We do this by reading the stack output for the memory address of the bad string, “0x01d03fdc“, which is in the second column of the "!dso” output. Here we can see that it is a local variable in example1.DotNetSwallowed.SwallowCommand().
Armed with knowledge of where the string is being set, and what is passed through to RunCommand and DateTime.Parse, you can work out why the date is in the incorrect format by delving into the source code. If you do not have access to the source code, you can use .NET Reflector where, even if the code is obfuscated, you still have the correct class and method names, so it should be fairly straight forward.
Viewing Objects
Using this simple method, we have learnt how to break on an exception, examine the CLR stack and list all the objects on the stack. There is one more major, common task that we haven’t looked at, and that is examining specific objects. In .NET, there are two kinds of variables, reference types and value types. Viewing reference types is simple; all you need to do is use the command "!DumpObject", or “!do” for short.
When we call "!do“, we need to pass an address of an object. If you take the address from the last step, in my case “0x01d03fdc“, and pass that in, then you can see the underlying object structure:
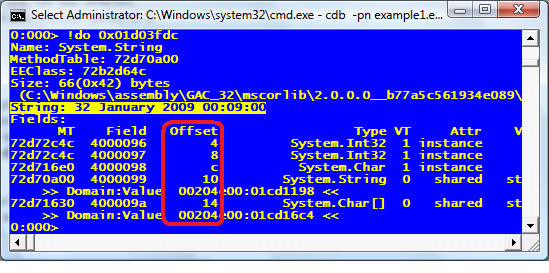
This shows the text in the System.String object, and I have also highlighted the Offset column, because as good as sos.dll is, it isn’t magic. It retrieves the type of the object by looking up the “Method Table”, which basically describes how the type is laid out in memory. The method table address is stored in the first 4 bytes of the object.
We are now going to examine how “!do” works, so if instead of using “!do address", enter "dc address“. Note that there is no exclamation or full stop; dc is a native debugger command to dump the memory, showing dwords (or Int32’s):
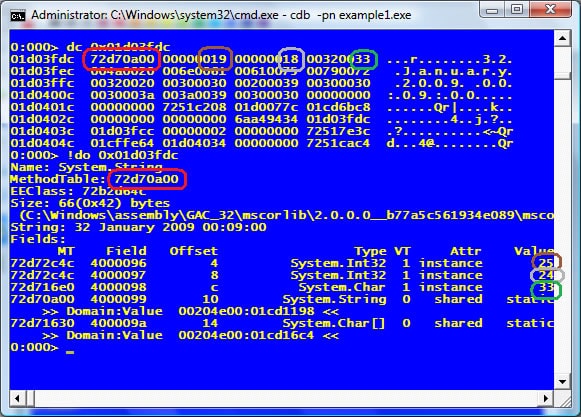
The green highlighted text is the Method Table, which should have been listed when you executed “!do". The numbers displayed are in hex so 19 translates to 25, 18 to 24 and so on. So, if you knew you wanted to dump out a string, but didn’t want to use SOS (crazy fool), then because the offset to the first character (m_fisrtChar) is +0xC (or 12 bytes to you and me) you could do: du memoryAddress+0xC (du is a different format of d, which dumps unicode strings):
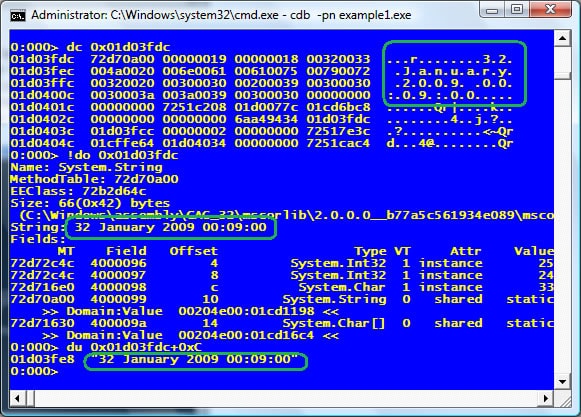
You can see the string and we didn’t even have to use SOS. SOS can help us decode structures, but it’s important to remember that which we can still do it manually if we have to.
Hopefully this shows how sos.dll decodes specific reference types.
Now, I mentioned that there were also value types. These are not passed by reference, probably for performance reasons, and so the method table isn’t passed around with the variable. Therefore, we need to tell SOS what the type is. If you don’t know what the type is, then I am afraid you are out of luck and stuck with using “dc address“, which will give you the actual bytes and a string representation.
If you use !dso to get the memory address of the “example1.DotNetSwallowed” object and then do “!do address” you get:
It has one variable _initialized, and the offset is 4, so try doing “!do address+0x4” and you should get this error:
Note: this object has an invalid CLASS field
Invalid object
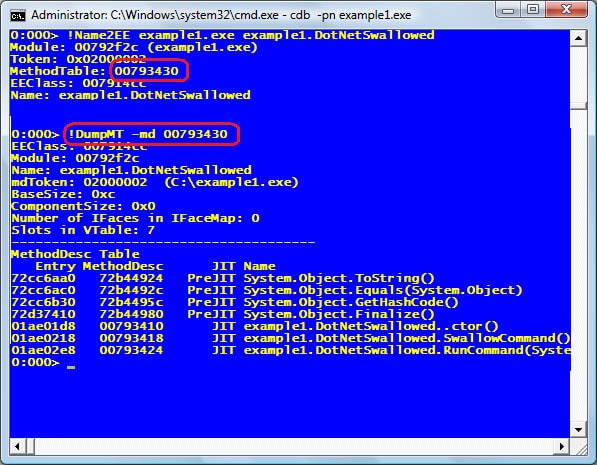
This means that it doesn’t have a method table. We could use the details from when the DotNetSwallowed was dumped out and SOS did the work for us, but let’s do this ourselves to show how it works. What we do know is that it is a “System.Boolean” so to look up the method table we use one of my favourite SOS commands “!Name2EE” (or Name 2 Ed Elliott as I like to call it):
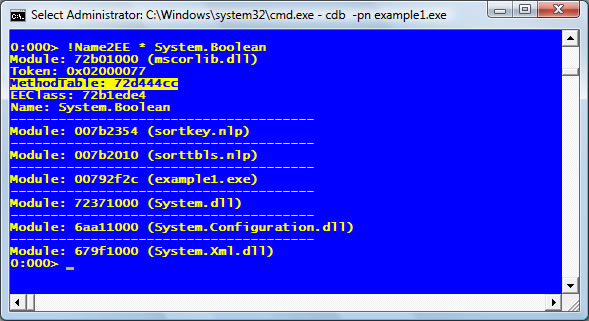
This goes through all modules looking for the type. If you know which module it is in, you can use that instead of *. When you have the method table you can then use “!DumpVC” to dump out the value type:
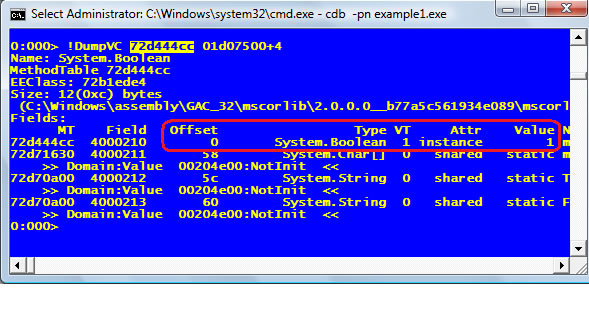
This shows the value of the value type, in this case 1, which is true.
Breakpoints
The ability to set breakpoints is a basic debugging requirement. cdb is capable of setting them and so is sos.dll, but the actual breakpoints are set using the native address not the MSIL address. To set a breakpoint we can use the “!bpmd” command, which takes either a module and method name or a “Method Description”.
A method description is used by a range of SOS commands so it is useful to talk about them at this point. There are a number of ways to get the method description; the first is to use “Name2EE” to get the method table, and then get a list of the method descriptions associated with that type. For example, if you go back to cdb and do: “!Name2EE * example1.DotNetSwallowed“, it will show the method table’s address. instead, do “!DumpMT -md“, which dumps out the method table and also lists the method descriptions:
This shows the methods on the type, and whether they have yet been compiled into binary (Jit or PreJit). Let’s go ahead and dump out one of the method descriptions. We’ll use the SwallowCommand md and do “!DumpMD address“:
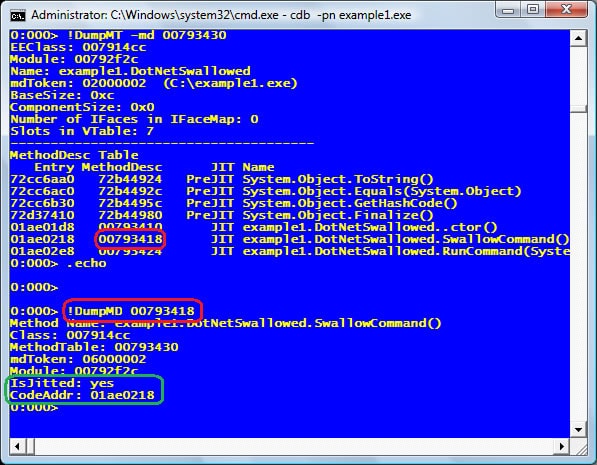
If the code has been JIT’d then, under CodeAddr, we get the address of the binary bytes, and we can use the native cdb command to set the breakpoint using “bp”. For example, in this case we could use “bp 01ae0218”. If it hasn’t been JIT’d,or if you want to use SOS, execute “!bpmd -md methodDesc“, using the method description highlighted in green. It should show that it is setting the breakpoint. To verify that it has set one, use the cdb command “bl” to list all of the break points.
With the breakpoint set, press “g” and then, in the example application, choose option 1. This time, you will see that the debugger breaks before the exception, with the message “Breakpoint 0 hit”. Do a “!CLRStack” to confirm where you are and to get a list of variables. The easiest thing to do is “!dso” so you can see all the objects on the stack including the “this pointer”, which will be in the stack as the name of the class itself, so you can then dump that out to see what state it is in.
To remove the breakpoint, just do “bc X” where x is the breakpoint number. You can also do “bd” which disables it until you call “be“.
Viewing IL code
If we have a method description, we can easily view the MSIL using the command “!DumpIL methodDescriptionAddress“
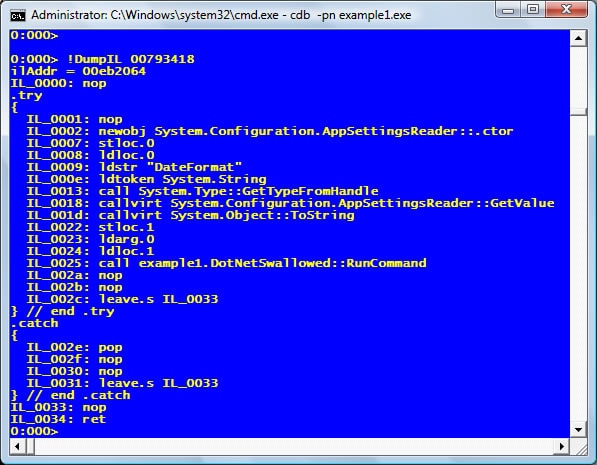
The codes you see, such as ldloc.1, is documented on MSDN (Link: http://msdn.microsoft.com/en-us/library/system.reflection.emit.opcodes_fields.aspx), under “OpCodes Fields“
Painless Debugging
So there you have it! Using a few simple commands, we have been able to find out why a program is doing nothing. By examining the exception that is being swallowed we could see that it was an invalid date format. We could then take this information to find out where the string is coming from and fix it.
To summarise the process here are the steps again:
- Attach the debugger – cdb -pn example1.exe
- Tell the debugger to break on CLR exceptions – sxe e0434f4d
- Have a look at the exception – !pe
- Look for objects on the stack which might explain it – !dso
- Look at a specific reference type – !do address
- Find a method table for a value type – !Name2EE * System.Boolean
- Show the value of that type and variable – !DumpVC methodTable address
- Find a method description using a method table – !DumpMT -md methodTable
- Set a break point – !bpmd -md methodDescription
- Have a look at the MSIL – !DumpIL methodDescription
I have shown a few of the native debugger and SOS commands and how they can be used to understand and examine the failing process. This may seem a little overwhelming at first but it is straight forward and well documented.
sos.dll in Visual Studio
It is important to remember that SOS is not part of the debugging tools; it is part of the .NET framework and now even ships with each version. Although not as elegant and as easy to use as in cdb, the helper can be loaded in Visual Studio by using the immediate window and typing “.load C:\Windows\Microsoft.NET\Framework\v2.0.50727\sos.dll” (change the path to the version of the framework that you are using).
SOS has a number of exciting features and I would encourage anyone to look further into debugging using sos.dll as it will come in handy at some point. If you are interested in learning more ,then these functions are a good place to start:
- “!DumpHeap -stat” – List all objects in memory and show how many of and how much memory each type is using so you can track down memory leaks.
- “!GCRoot [address]” – Find where a specific object is referenced so you can track down memory leaks easily
- “!SyncBlk” – Show where threads are waiting on locks to diagnose deadlocks.
- “!Help [command]” a very handy reference and examples on how to use each function that comes with the tools.
- “!Help faq” Have a look, it is one of the most useful help commands I have ever seen from Microsoft.
Further Reading
- The help file that comes with the debuggers is an invaluable source of information, there are many different debugger commands and ways to use them that there is usually at least a couple of ways to do everything.
- Msdn
sos.dlldocumentation (Link: SOS Debugging Extension (sos.dll)) - Tess Ferrandez is a Microsoft Escalation engineer who regulary blogs about using the debugging tools and
sos.dll(Link: http://blogs.msdn.com/tess/) - John Robbins is the master of debugging and he has a number of books on the subject as well as a blog (https://www.wintellect.com/author/jrobbins/)
- (Link: http://www.microsoft.com/mspress/books/5822.aspx)
- Although more for the kernel / driver developers the sysinternals series gives a very good reference for process architecture (Link: http://technet.microsoft.com/en-us/sysinternals/bb963901.aspx)
FAQs: .NET debugging? Don't give me none of your VS
1. How do you debug a .NET application without Visual Studio?
Install the Windows Debugging Tools (free from Microsoft), which include WinDbg (GUI) and CDB (command-line). Attach to a running process with “cdb -pn yourapp.exe”, load the SOS.dll extension with “.loadby sos clr”, and use SOS commands like !clrstack (managed call stack), !dumpheap (heap objects), and !pe (print exception) to inspect the managed runtime. These tools work on production servers where Visual Studio isn’t installed.
2. What is SOS.dll and how do you use it for .NET debugging?
SOS.dll (Son of Strike) is a debugging extension that ships with the .NET Framework and understands managed code concepts like objects, threads, and the garbage collector. Load it in WinDbg or CDB with “.loadby sos clr” after attaching to a .NET process. Key commands include !threads (list managed threads), !clrstack (show managed call stack), !dumpobj (inspect an object), and !gcroot (find what’s keeping an object alive for memory leak investigation).
3. How do you analyze a .NET crash dump?
Create a crash dump with Task Manager (right-click process → Create dump file) or programmatically with MiniDumpWriteDump. Open the dump in WinDbg with File → Open Crash Dump, load SOS.dll, then use !pe to see the exception that caused the crash, !clrstack to see what code was running, and !dumpheap -stat to check for memory issues. Crash dumps let you debug post-mortem without reproducing the issue.
This document contains proprietary information and is protected by copyright law.
Copyright © 2026 Red Gate Software Limited. All rights reserved
Load comments