
Introduction
We will be looking into the world of managed memory In this article. It is a world in that part of the CLR where the garbage collector is king. We will consider what a memory leak is, how the garbage collector works and why it cannot always free memory; we will then, finally and most excitingly, reveal how to examine both memory and specific objects using Son of Strike (SOS).
What is a memory leak?
At its most basic, a memory leak happens when memory has been allocated and, for whatever reason, that memory is not freed when the application has finished using it. In a .Net language, you allocate memory by creating an object and you free the memory by allowing the reference to that object to go out of scope. Simply put:
|
1 2 3 4 5 6 7 8 9 10 |
void MethodName() { Object o = new Object(); //Create a new Object and store a reference to it as o DoSomethingWith(o); //Use the new Object by passing the reference to o o = null; //Lose the reference to the new Object, it is now eligible for freeing } //o is now out of scope so can be freed |
When “o” goes out of scope, the garbage collector can examine the object to see if it has any references; if nothing is referencing the object, it can be freed. If the “DoSomethingWith” method caused a reference to be kept to “o” then, when the garbage collector checked to see if it was being used, there would still be a reference and so it would not be able to free the memory.
I have mentioned the word ‘reference’ a few times; When you call new, you don’t actually get the object returned, but a reference to the new object which is created in the heap space.
This can be quite a dry subject, so just for fun let’s take a look at the MSIL for this:
|
1 2 3 4 5 6 7 8 9 10 11 12 13 14 15 16 |
.method private hidebysig instance void MethodName() cil managed { // Code size 18 (0x12) .maxstack 2 .locals init ([0] object o) IL_0000: nop IL_0001: newobj instance void [mscorlib]System.Object::.ctor() IL_0006: stloc.0 IL_0007: ldarg.0 IL_0008: ldloc.0 IL_0009: call instance void leak.SampleClass::DoSomethingWith(object) IL_000e: nop IL_000f: ldnull IL_0010: stloc.0 IL_0011: ret } // end of method SampleClass::MethodName |
We can see here that IL_0001 Calls the “newobj” command and, according to MSDN (MSDN .NET OpCodes – Newobj Field), this creates a new object and puts a reference onto the “evaluation stack”. Then the next command IL_006 stloc.0 takes the value on the top of the “evaluation stack” and stores it in the local variable list. We see that we don’t actually get the object but just a reference to it; in other words the memory address that the object is sitting in.
As I mentioned previously, as long as DoSomethingWith does not store a reference to the object, when it gets to the end of this method and goes out of scope, the reference will be lost and the garbage collector can free the memory. In this case, therefore, there is no memory leak.
How do I know if I have a memory leak?
If you have a true memory leak then you may eventually start getting OutOfMemory (OOM) exceptions after a while, if the problem is severe enough. If you want to be pro-active you can monitor the application using the Performance Monitor PerfMon, rather than wait for OOMs . If you monitor the “Process” and “Private Bytes” counters for your specific process, you will see the increase in the amount of memory used and how it happens. Typically you should also look at the “.Net CLR Memory\# Bytes In All Heaps” for your process, which should increase in-line with private bytes if you have a standard memory leak.
When you are monitoring your application, you might come across a memory hog which uses a lot of memory but does free it when it is finished. The method of troubleshooting these hogs is exactly the same as finding memory leaks, you just need to do the analysis when the objects are live and before the garbage collector does its thing and removes the evidence.
What does it matter if an application has a problem with memory?
The quick answer is that your application will run more slowly. The longer answer is this: Ideally there should be enough available every time your application tries to allocate memory. If there isn’t, then either you will get an OOM exception which is often critical or, in the best case, the garbage collector needs to go to work to move other objects around. This will use up precious processing power and also delay your request.
Isn’t it impossible to get memory leaks in .net?
It is true that the whole point of the garbage collector is that it is there to stop you having to worry about allocating and freeing memory. This was a real bugbear in languages such as C and C++, but a garbage collector can only work with what you give it. If you keep a reference to an object that you don’t need, you are stopping the GC from freeing it. Although the GC keeps a reference to the object, so it can never be lost or re-allocated, it is not possible to free it as long as the application keeps its own reference.
SOS Commands
Examining the objects in memory is simple with SOS. Apart from the command to actually examine individual objects “!DumpObject“, there are only two commands you ever have to use, “!GCRoot” which shows what is holding a reference to an object and “!DumpHeap” which shows what is currently in memory.
When you have an application that is either leaking or is a memory hog and you want to make it better, you have to know two things:
- What objects are using the memory
- What creates and keeps a reference to those objects
Once you know these two things, you can use your ninja coding skills to change the way the memory is used, perhaps by removing them from a list once they are no longer needed or freeing them in a parent objects destructor or Dispose method.
DumpHeap
This command has two parameters which we will cover here “-stat” and “-type” (or “-mt“). The first key to finding out what objects are hanging around is to open a debugger, load up Son of Strike (SOS) and run “!DumpHeap –stat. (If this is completely foreign to you, and you are unsure how to get to this point, then take a look at .NET Debugging: Don’t give me none of your VS). The command finds all the objects, groups them by type and the orders them by how much memory the cumulative total of all objects of that grouped type. I have included a sample application in the .ZIP file attached to this article (See the speech-bubble at the head of the article). Feel free to follow along using it. The first example is of a method that creates a List and assigns a list of ArraySegments to it, it is a typical memory hog in that, when the method finishes, the memory will be available to be freed.
The output to the command “!DumpHeap –stat” looks like:
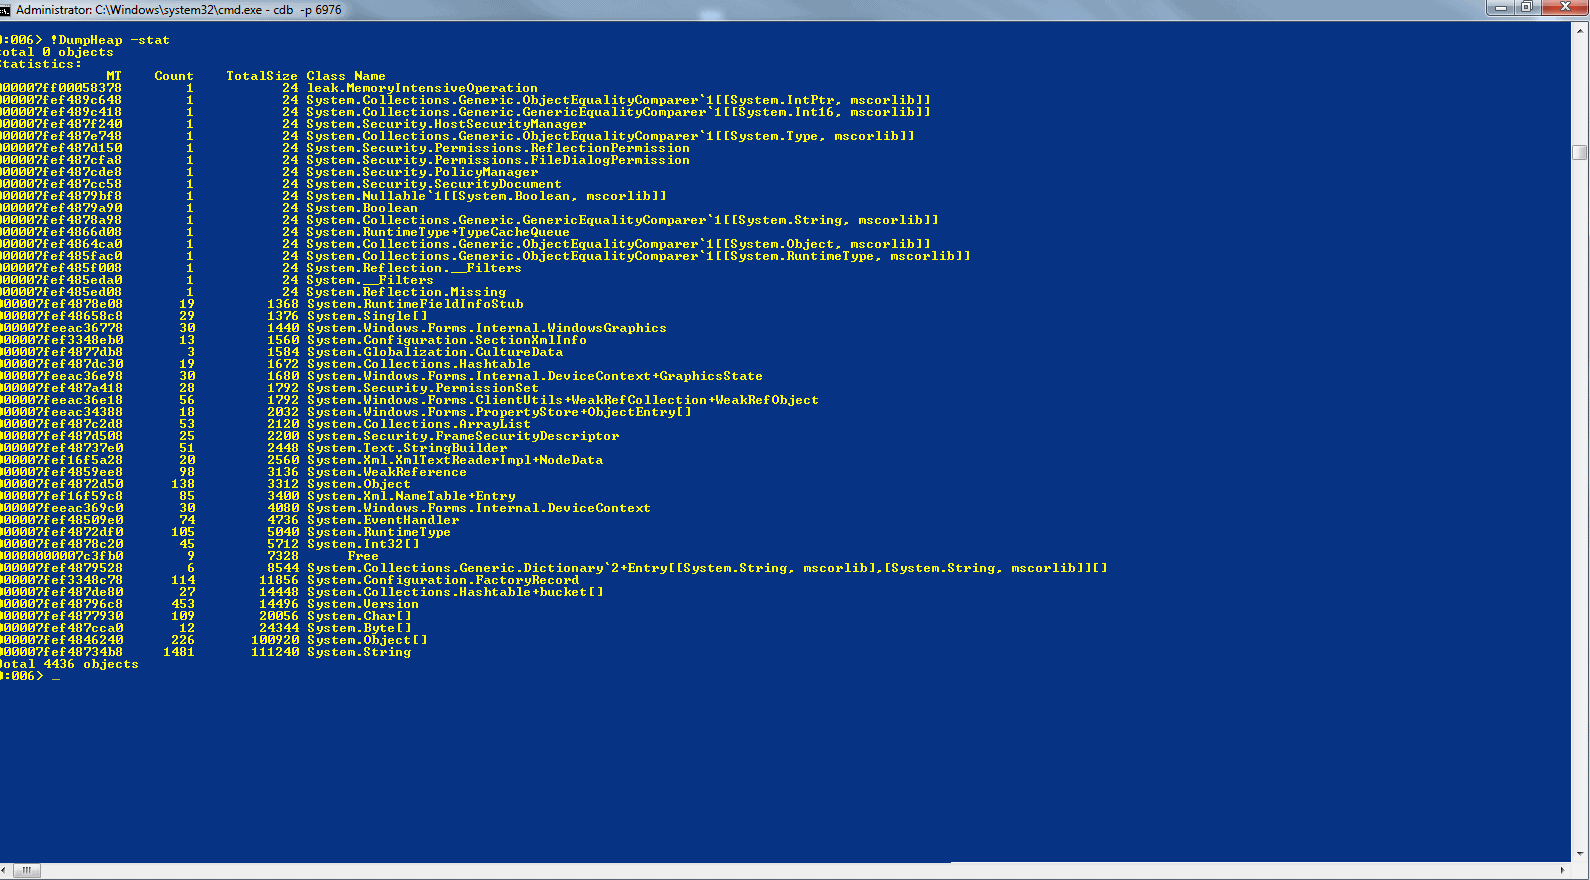
You can click on any of the screenshots in this article to see them full-size. I should point out that the screenshots are taken from an x64 machine on the CLR 4 CTP, so some things might look slightly different. The actual process and commands are the same. Certainly, where I have highlighted areas on the screenshots, these are the same as in previous versions of the .net framework. The main difference you will see if you are on an x86 machine is that the size of pointer values are 8 bytes and sometimes separated with a “`” whereas the values on the x86 machines are 4 bytes.
The first column shows the MethodTable of the object type, the second is the count of objects, the third shows how much memory all the objects of that particular type are using, the last column is the type name. To find what it is that is using the most memory, scroll to the bottom of the list and take a look at the objects near the bottom. If you run the sample app, attach using CDB and then press the first button “Memory Intensive Operation” and wait for the dialog to display, before you click “ok” run the DumpHeap –stat command and at the bottom of the output you get:
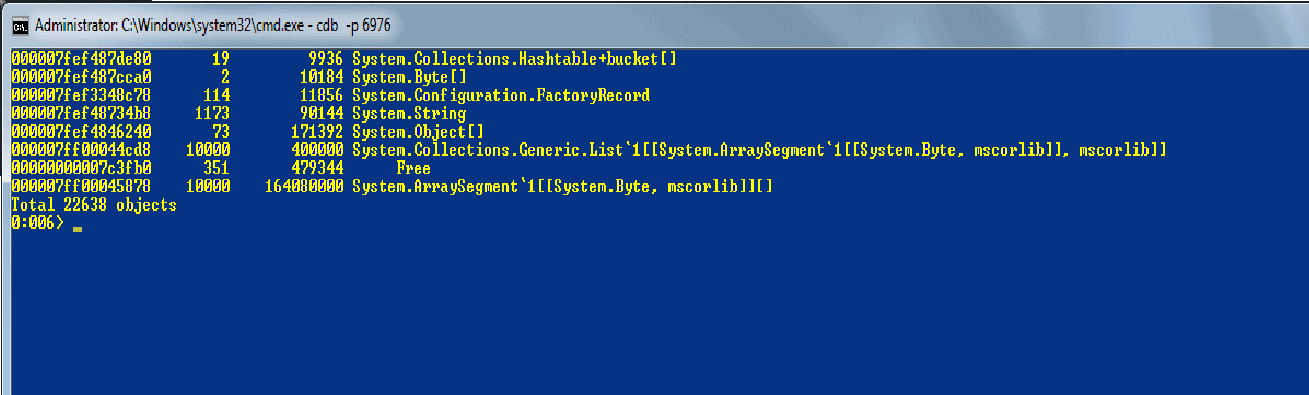
We see here that there are 10,000 objects of type “System.ArraySegment`1[[System.Byte, mscorlib]][]” which are using up 164,080,000 bytes of memory. If we want to have a look at those 10,000 objects we can use either –type or –mt. The type takes the type name and –mt takes the method table (first column), so if we do “!DumpHeap –mt 000007ff00045878” (The method table to use might be different on your system so be sure to copy the value that is in your output). Normally you could use –type but because of the [‘s and ]’s in the type name it will fail.
If you let the output finish, which will take some time, you see a list of the 10,000 objects, the first column is the address of the specific object, the second is the method table and the third tells you the size of that specific object.
If you take one of the objects at random and do “!do address” (address is from the first column) you will see what the object looks like:
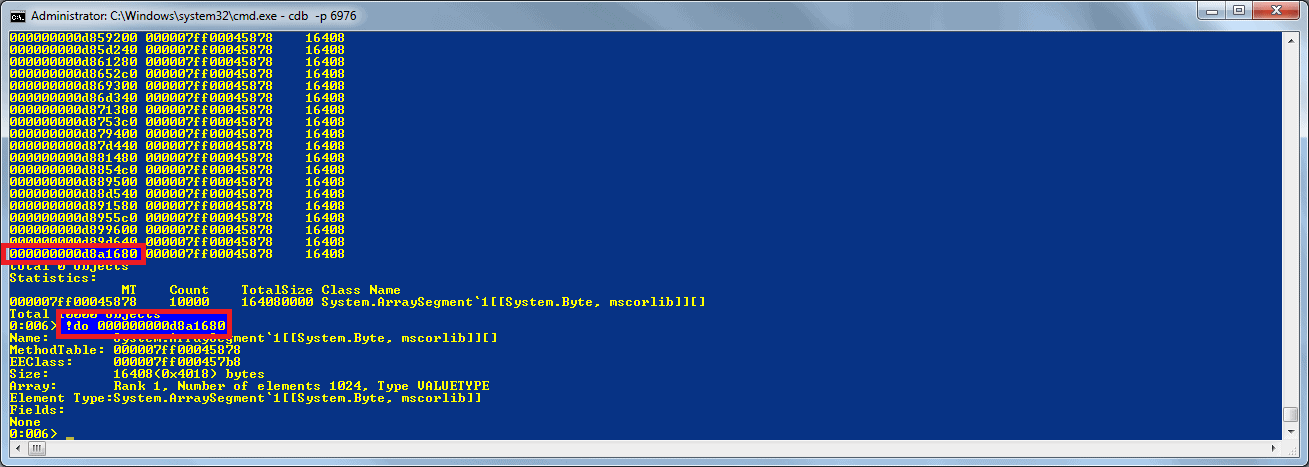
So we now know the type of the specific object. In some cases this would be enough, but let us assume it isn’t and move onto the “GCRoot” command. This shows how other objects are referencing an object and stopping it from being freed.
GCRoot
If you take the address that we passed to “!do” and try “!GCRoot address“, it will list all the objects that have a reference to your specific object. GCRoot searches for references, in both the stack and the heap, if a reference is on the stack then it is very likely to be garbage collected at some point so is normally fine, but if we look at the output anyway, we can see that on thread id 10 there are a number of roots, the first one shows that a list (1.1) has a reference to an object array (1.2) which references another list (1.3) which references our object (1.4).
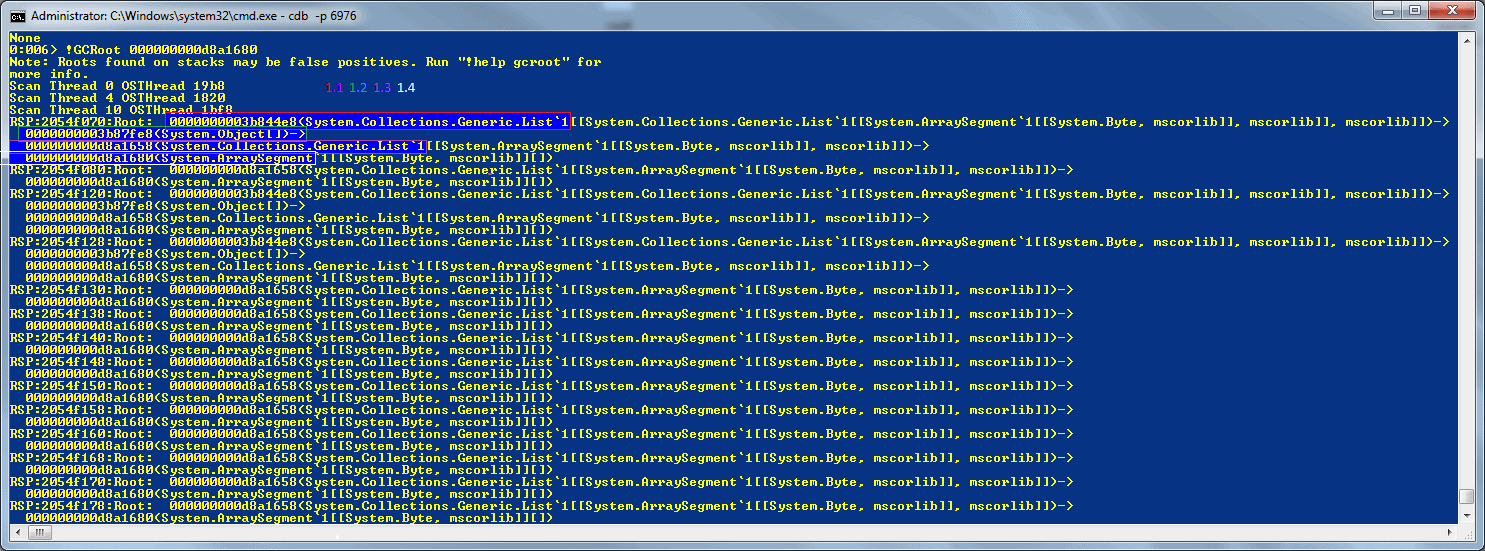
In this example the root reference is “0000000003b844e8” – you can have a look at this by doing “!do 0000000003b844e8”. (Remember to use the address that is displayed on your machine instead of this particular address).
Because the reference is on the stack we can find out where it was created. To do this we
- change the current thread to thread id 10 (or whatever thread id is in your output) by doing “~10s“.
- do “!CLRStack -a” (-a shows all variables and parameters),
- look at all the values and search for the first instance of the object we already found to be the root:
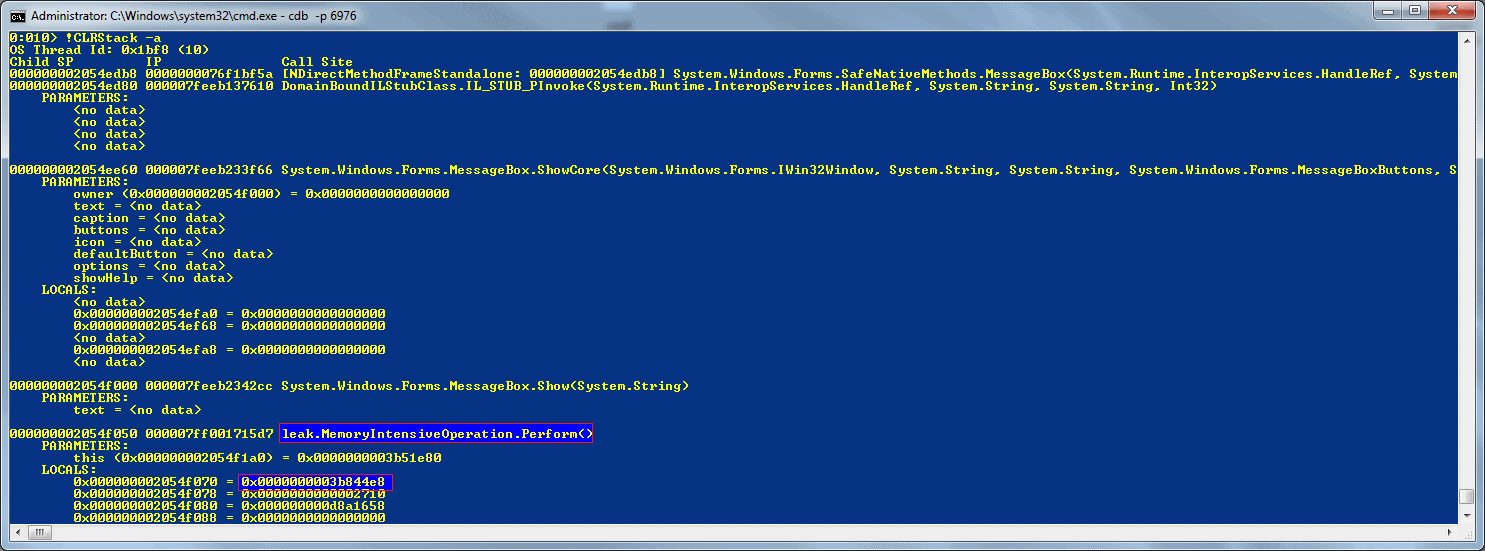
This shows that if we have a look at the leak.MemoryIntensiveOperation.Perform method we can see why we have a reference to the object.
If we take a look at a second example, this time instead of just being a memory hog, we have a situation where a method has directly asked the garbage collector to keep a reference to an object by doing a “GCHandle.Alloc(o, GCHandleType.Pinned);” which creates a handle to the memory and stops it from being freed.
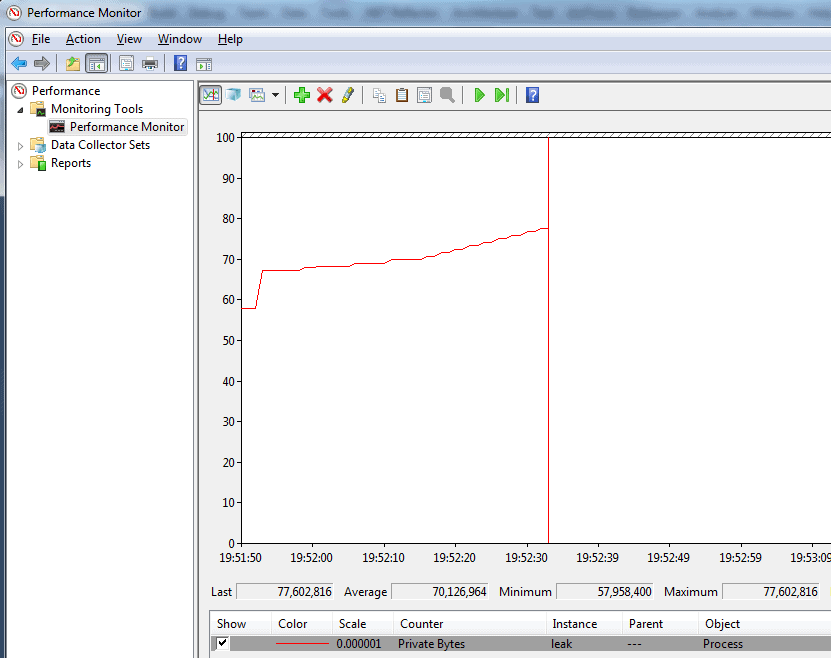
If you run the sample app under cdb and press the second button “GC Alloc” a few times, this perfmon shows how the private bytes increases every time I push the button and is typical in a memory leaking app, the memory constantly increases whenever a specific action occurs:
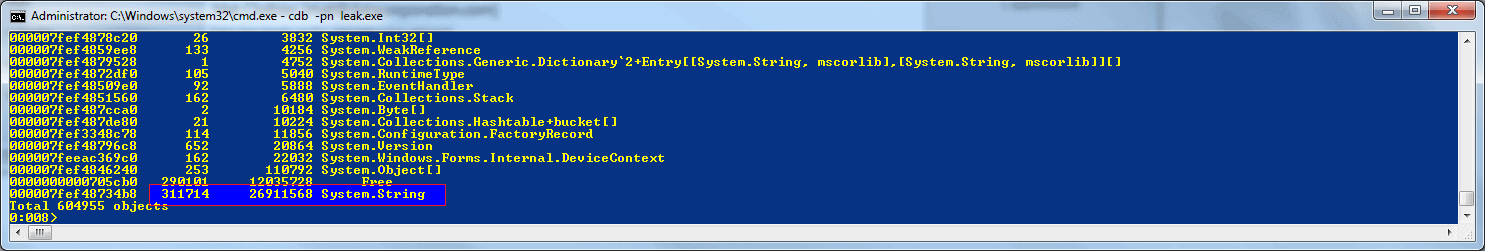
After pressing the button a few times and seeing the memory increasing, attach using cdb, load up Son of Strike (SOS) and do “!DumpHeap –stat“. We see that, at the bottom, the type that is using most memory is System.String. Because I pushed the button a few times and because there are other uses of System.String, there are 311714 objects: Some might well be valid and some are our leaked objects:
We could go through each object and dump them out individually to see what they contain, but there are so many, to go through all of them would be a “right royal pain”. Instead we can use some of the debugger’s inbuilt commands to process each object.
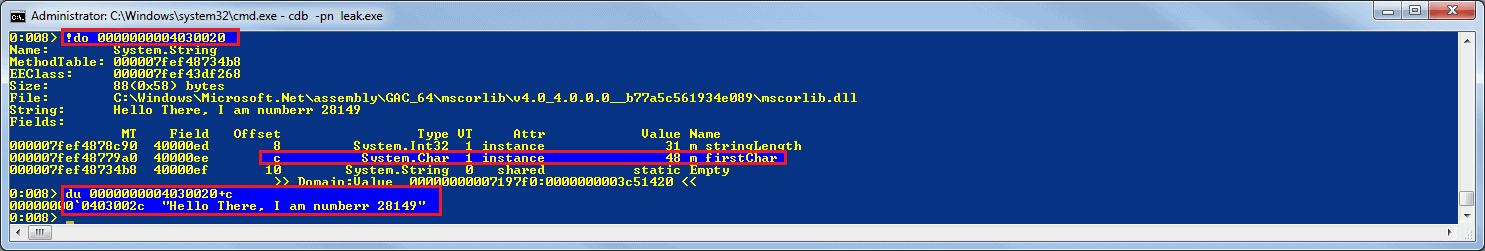
If we take a look at one of the strings by doing “!do address“, we can see that at offset 0xC there is a value called m_firstChar. If we do “du address+c” instead of using !do to dump the object, it will take the unicode string at 0xC bytes after the start of the object and display it:
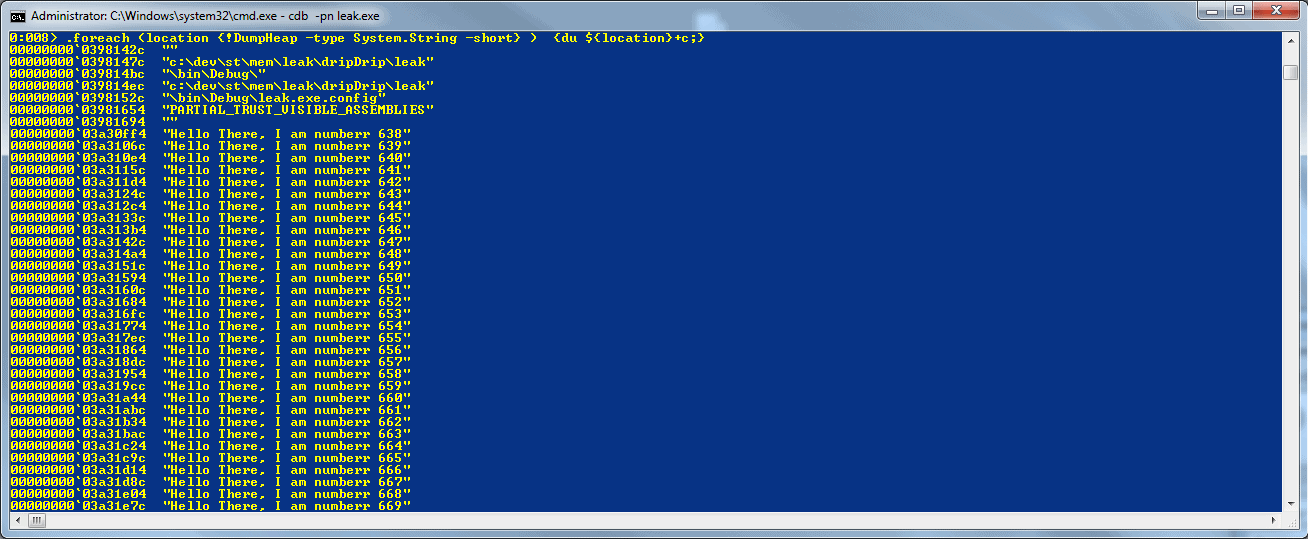
Now that we know that the actual string is 12 (0xC) bytes from the location we get from !DumpHeap, we can use the debugger’s own foreach iterator to do something interesting with the string. So if you run the following command:
|
1 |
<span lang="EN-GB"><strong>.foreach (location {!DumpHeap -type System.String -short} ) {du ${location}+c;}</strong></span> |
This runs the command “!DumpHeap -type System.String –short” and for each value that is returned, runs “du location+c” which outputs the string without the extra clr object gumpf, so if you run this you will see the address of the string followed by the actual unicode string. The strings show a load of values that are normal in a process, and then a whole load of strings such as “Hello There, I am numberr x”:
If you look at the total output most of the strings are the same so it shows that the object using up most of our memory is a string, but a slightly different one each time. In this specific case I would search the source for “Hello There, I am” and see where it is built and that should help us track down what the cause of the leak is. As an alternative, let’s take the foreach operator and apply the GCRoot command to it.
The GCRoot is a slow command: If we run it against all the strings in the process, including the ones we are not interested in, it would take an unreasonable amount of time to complete; so again we can use the debugger’s in built commands to help. There are two ways to combine commands to make something more useful, the first is the way we saw above and that is to type everything onto one line, which is fine for a simple bit of automation but we will need to do something a litte more complex, what we are going to do here is:
- Get a list of all the System.String objects
- For Each String:
- If it matches the wildcard “*Hello*” run !GCRoot against it
- If it doesn’t match then ignore it
If we use a single line for this then it would become difficult to read and also difficult to write so instead we can use a debugger script, if you copy this into a text document and save it somewhere on your machine with your debugger tools:
|
1 2 3 4 5 6 7 8 9 |
.foreach (location {!DumpHeap -type System.String -short} ){ .block{ as /mu ${/v:string} ${location}+c .block{ .catch{ .if( $spat( " ${string} ", "*Hello*")){.echo ${string}; !GCRoot -nostacks ${location};} } } ad ${/v:string}; } } |
(The script is also attached to the article in the zip file. It is called ForEachStringDumpMatchingGCRoot.txt)
We can then run this from inside the debugger by doing:
“$><C:\PathToScript\ ForEachStringDumpMatchingGCRoot.txt”
You should see something like this:
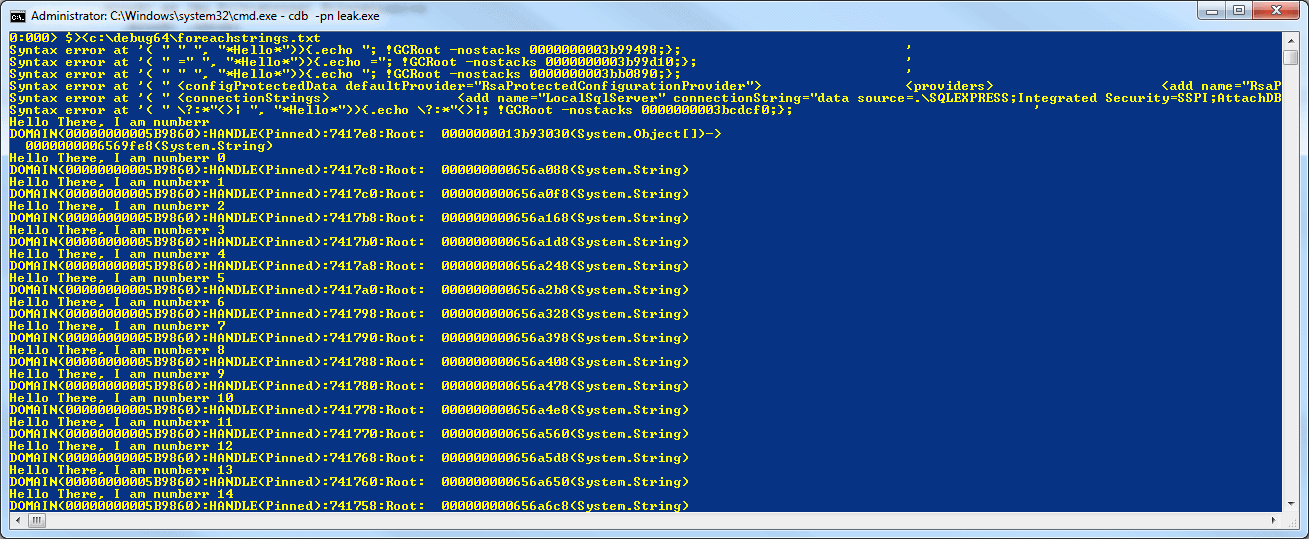
At the top we see a number of syntax errors, these are because there is no way to quote the strings we are checking and they happen to break the script by including a quote, we get around this by ignoring errors using the .catch block and we see the output from any which fail so we can check those manually if we wanted.
The script is fairly simple, it runs a foreach over the output from “DumpHeap –type System.String“, then stores the Unicode string that is at the location+c in an alias called ${string}. It then uses the .if command to check whether the string matches the pattern “*Hello*”. If you don’t want to do a pattern match then you can use $scmp for case sensitive or $scmpi for case-insensitive comparisons.
If a match is found, then it dumps the string and then calls GCRoot. The csharp code that created the objects looks like:
|
1 |
GCHandle.Alloc(stringNumeroUno, GCHandleType.Pinned); |
Because the handle isn’t saved, there is a reference to the handle but the handle isn’t rooted anywhere so the output of GCRoot is fairly useless:
|
1 |
<span lang="EN-GB" style="color: black;">DOMAIN(00000000005B9860):HANDLE(Pinned):7417c8:Root: 000000000656a088(System.String)</span> |
All this tells us that in the domain 00000000005B9860 there is a pinned handle to our string (000000000656a088). Normally at this point we would be a little stuck, if the object was created using the new operator we could set a breakpoint on the constructor and wait for the objects to be created: However, if we take a look at the MSIL for this particular problem we can see why this wouldn’t work here:
|
1 2 3 4 5 6 7 8 9 10 11 12 13 14 15 16 17 18 19 20 21 22 23 24 25 26 27 28 29 30 31 32 33 34 35 36 37 38 39 40 41 42 43 |
.method public hidebysig newslot virtual final instance void Perform() cil managed { // Code size 61 (0x3d) .maxstack 2 .locals init ([0] int32 i, [1] string stringNumeroUno, [2] bool CS$4$0000) IL_0000: nop IL_0001: ldc.i4.0 IL_0002: stloc.0 IL_0003: br.s IL_0025 IL_0005: nop IL_0006: ldstr "Hello There, I am numberr " IL_000b: ldloca.s i IL_000d: call instance string [mscorlib]System.Int32::ToString() IL_0012: call string [mscorlib]System.String::Concat(string, string)g) IL_0017: stloc.1 IL_0018: ldloc.1 IL_0019: ldc.i4.3 IL_001a: call valuetype [mscorlib]System.Runtime.InteropServices.GCHandle [mscorlib]System.Runtime.InteropServices.GCHandle::Alloc(object, valuetype [mscorlib]System.Runtime.InteropServices.GCHandleType) IL_001f: pop IL_0020: nop IL_0021: ldloc.0 IL_0022: ldc.i4.1 IL_0023: add IL_0024: stloc.0 IL_0025: ldloc.0 IL_0026: ldc.i4 0x186a0 IL_002b: clt IL_002d: stloc.2 IL_002e: ldloc.2 IL_002f: brtrue.s IL_0005 IL_0031: ldstr "Complete" IL_0036: call valuetype [System.Windows.Forms] System.Windows.Forms.DialogResult [System.Windows.Forms] System.Windows.Forms.MessageBox::Show(string) IL_003b: pop IL_003c: ret } // end of method GCAllocd::Perform |
Line IL_006 shows that ldstr is used instead of newobj nope and then having the constructor called. So to track down where the location that the strings are being created we must take what we know:
- There are a whole load of strings starting “Hello There,…”
- Each string has a number after it#
- The references are rooted and pinned.
We can be certain that GCHandle.Alloc is being called somewhere, otherwise we would have an actual reference to the object. We also know that, because the string is modified from a standard string to include a number, that String.Concat is most likely being called: it will still call String.Concat even if a string is concatenated using “+”. Although we can assume that a number is converted to a string, this could be done through Int32.ToString, Int64.ToString or any of the number types, so you might potentially have to set quite a few breakpoints.
From our three options, we will try setting a breakpoint on String.Concat. To set the breakpoint we need to find the String object’s method table so we can get the method description which will give use the address of Concat to set the breakpoint so:
!Name2EE * System.String
This should show the Name System.String and the MethodTable, on my machine it is “000007fef52d34b8”
!DumpMT –md 000007fef52d34b8
This should list all the methods, find concat and from the MethodDescription take the value, on my system it is “000007fef4de9250”
!bpmd -md 000007fef4de9250
Now what this does is to set a breakpoint on each of the different flavours of Concat, if you use .NET Reflector against System.String you will see 11 different Concats, we get a breakpoint for each.
If you ..
- do “g“, this will restart the application and when you press “GC Alloc” it should hit a breakpoint in the debugger
- do “!CLRStack” and you will see the stack trace that caused the string to be pinned.
Normally you won’t have a handy button that you can press in order to see what the cause is, so you might have to wait a little while until it breaks into the debugger.
Once you know from where the objects are being created, you can see why they are being allocated and where they are being pinned. The reason why they are pinned depends on the original programmer, but at least you can see where your memory is going and can take action to free it as appropriate.
There is a debate as to whether our next example really is a memory leak, I think that it doesn’t really matter what you call it: If an object subscribes to an event and that stops the garbage collector from freeing the memory when it is finished with it, then your process will not run efficiently and could run out of memory whether or not it is a genuine leak.
In this example, a static class has an event that objects subscribe to. These objects go out of scope so the memory they use should be freed. However, because the static class has a reference to each object via an EventHandler, the objects hang around.
If you run the sample app and
- press the “Delegate Leak” button a few times
- break into it with the debugger
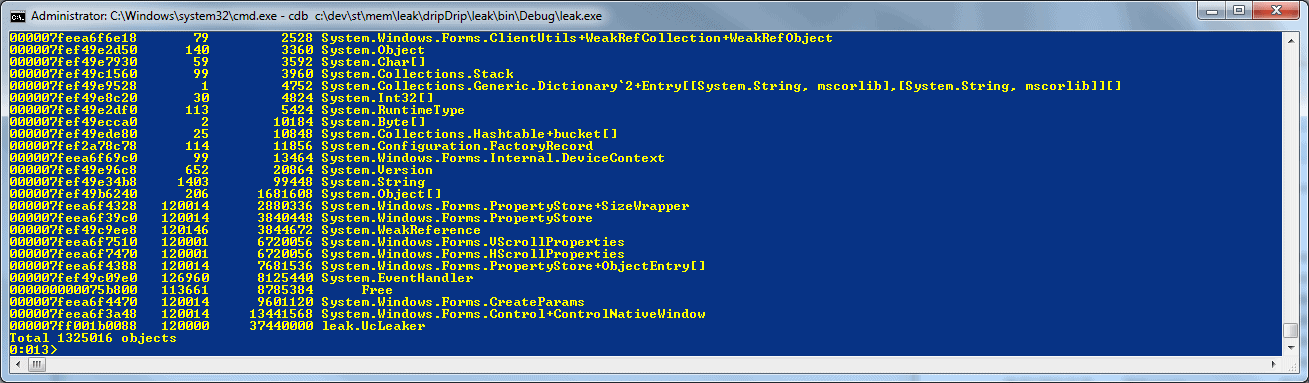
- run “!DumpHeap –stat”
.. then at the bottom we see something like:
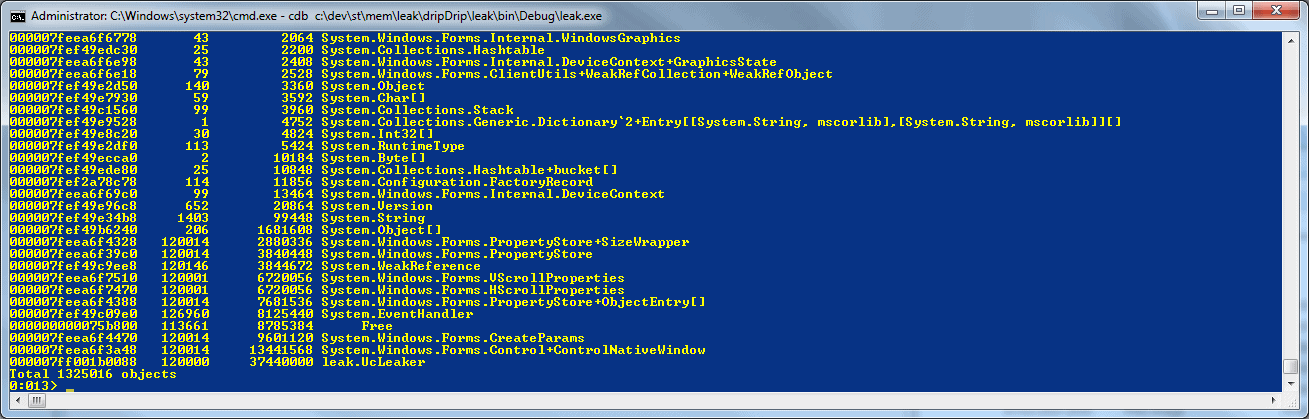
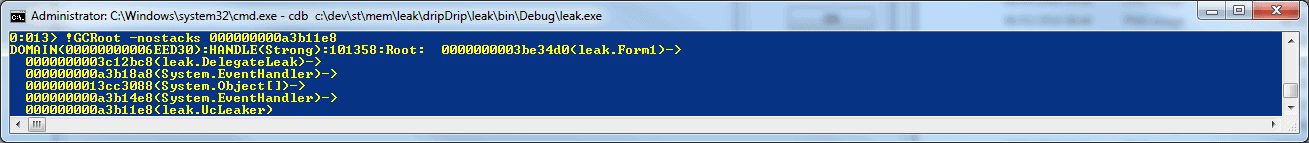
Here we see a large number (in this particular case 12000+) of a number of different types including “leak.UcLeaker” . If we then dump out those objects by getting the MethodTable from the first column and doing “!DumpHeap –mt [MethodTable]”, and do “!GCRoot -nostacks” on a few at random , we can see that there is an object “leak.DelegateLeak” which has a reference to a “System.EventHandler” which has a reference to an array of System.Objects which reference an EventHandler which reference our object we originally did GCRoot against:
We can then take a look at the System.Object[] because it is useful to know if it is one object that has many references or one object per reference (because if it is just one object then it is likely a static instance so should help to track down the problem faster), if you do “!do” against the address of the object array.
We see that there are quite a few elements, running “!da” against the address dumps each element and if you let it run, it will list the objects that are leaking, but at some point the addresses will change to “null”: This is because the array has been resized with appropriate space for more objects to be added. In this case, the element number where it changes to null should be approximately the same as the amount of leaked objects we had in our output from “!DumpHeap –stat“.
So we now know that one class has a reference to all our objects: Freeing that object will free our references, but how do we know what the reference is for other than it is for an event? As always in debugging, there are a few different approaches we can take to this, we can …
- examine the EventHandler objects which have a MethodPtr to see what method on the leaked class is being called,
- we can set a breakpoint on that MethodPtr to see when (if ever) it gets called
- we could set a break point on the EventHandler constructor and wait to see where it is actually set.
Each way has its own merits. Here we will see how to find out where the event goes to. To do this, dump out all of the EventHandlers in the program: If there are too many extra handlers that aren’t involved in your problem, then choose the ones that you want from the output from the !da on the System.Object[] we did earlier.
.foreach (location {!DumpHeap -type System.EventHandler -short} ) {!do location;}
If you scan the output, you see the _target. This is the actual object that will receive the event and you can run “!do” against that if you wanted to see what it was, but as we know it is our “leak.UcLeaker” class we won’t bother. The second thing you should see is the _methodPtr which should be the same on all the EventHandler objects:
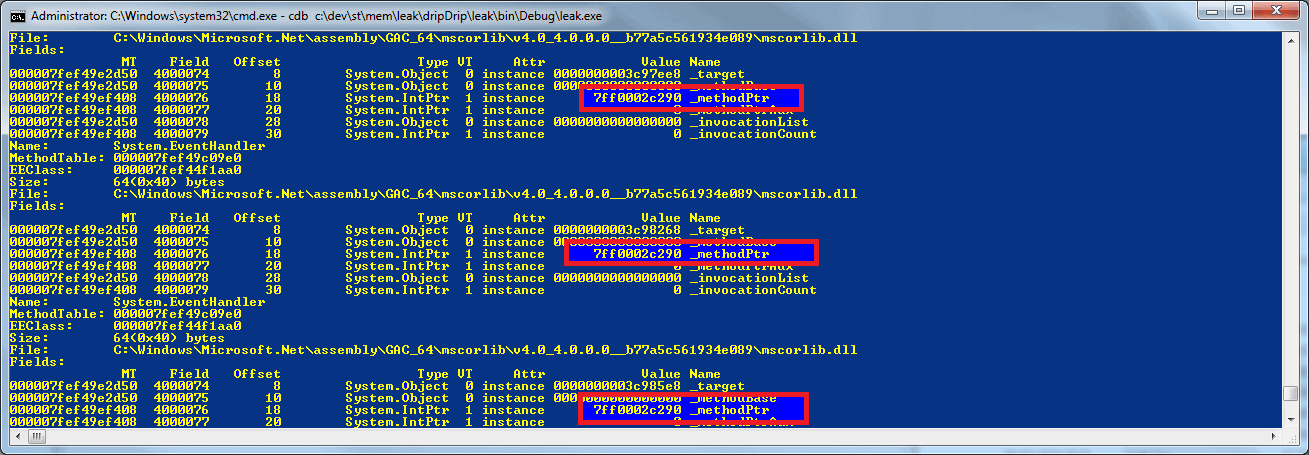
The _methodPtr is a IntPtr to the memory address that will be run when the event fires, you can run “!ip2md” against the _methodPtr but this normally fails to resolve the method. If it does fail then the easiest thing to do is to set a breakpoint on that address, run the program, and wait for it to break (Press the “Fire Events” button). When it breaks, if you do a “!CLRStack” you will likely find yourself in a mysterious method called “System.EventHandler.Invoke“. This does some magic to call your event, it will setup some variables and then jump into your method, so step through the code pressing “p” and you can either be brave and wait until you get a jmp or you can keep doing a “!CLRStack” until you see the method you were looking for, “leak.UcLeaker.EventDelegate“:
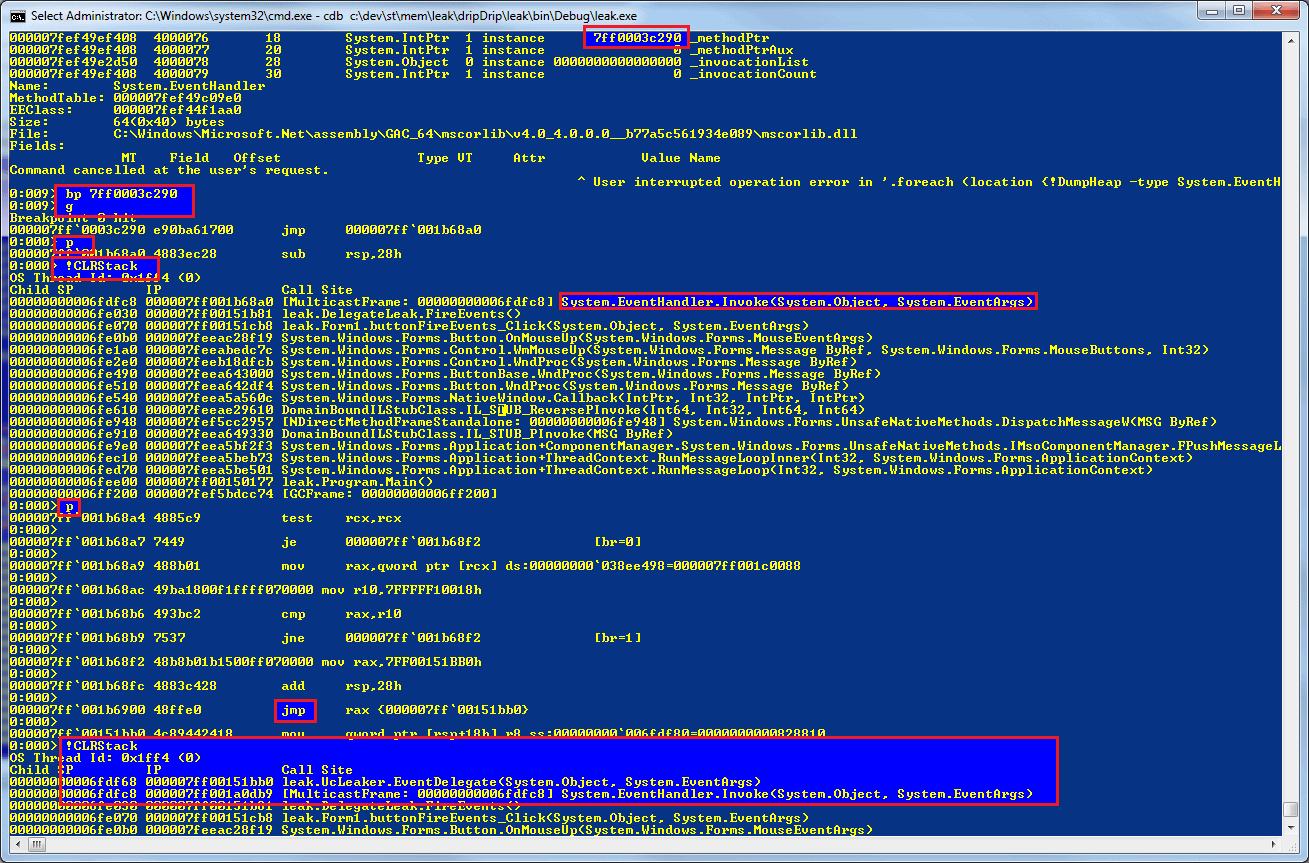
Once you know that you have an event and the method it points at, it should be fairly simple to search your code and find where the += is being called to then add a -= at the appropriate place.
If you wanted to approach this from the other point of view and see where the EventHandler objects are being created to find the breakpoint location, you can use !Name2EE to get the method table, then you use !DumpMT with the –md parameter to get a the method description for the constructor on the EventHandler which you pass to !bpmd.
Summary
It is fairly simple to understand how to find out what it is that is using your memory with Son of Strike (SOS.DLL) by using DumpHeap and how to find out why the objects are alive using GCRoot. If you couple these two with the advanced debugging commands such as .foreach, it really does become quite simple to quickly identify bugs which can lead to memory leaks or just poor performance using the debugging tools for windows and SOS. Despite their rather Spartan user-interface, they are free and, after some work in learning how to use them, can be a joy to use.
This document contains proprietary information and is protected by copyright law.
Copyright © 2026 Red Gate Software Limited. All rights reserved
Load comments