
SQL Server provides us with variety of tools for auditing. All of them have their advantages and pitfalls. The default trace, introduced in SQL Server 2005, has the great advantage of being switched on by default, and is usually already there to use. It provides comprehensive information about changes in the system.
Firstly, let’s start by answering some basic questions:
What is the default trace? The default trace is enabled by default in SQL Server and is a minimum weight trace which consists by default of five trace files ( .trc) located in the SQL Server installation directory. The files are rolled over as time passes.
How do we know that the default trace is running? We can run the following script in order to find out if the default trace is running:
|
1 |
SELECT* FROM sys.configurations WHERE configuration_id = 1568 |
If it is not enabled, how do we enable it? We can run this script in order to enable the default trace:
|
1 2 3 4 5 6 7 8 |
sp_configure 'show advanced options', 1; GO RECONFIGURE; GO sp_configure 'default trace enabled', 1; GO RECONFIGURE; GO |
What is logged in the Default Trace? If we open the Default trace file in Profiler and look at the trace definition we will see that events in 6 categories are captured: Database, Errors and Warnings, Full-Text, Objects, Security Audit and Server. Also, all available columns are selected for every sub-event.
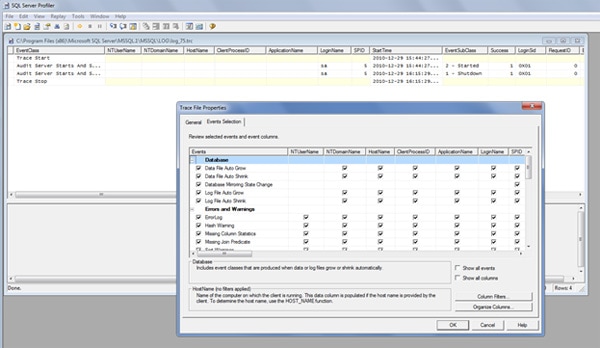
Figure 1: This is how the Default trace looks like
So, how can we benefit from each audited category? In the following sections I will explain briefly what each category means, as well as some of the sub-events, and will provide essential scripts for auditing the events in the Default Trace.
Database Events
Let’s start with the first event: the Database. As we can see, the sub-events are pretty much self-explanatory – the growth and shrinkage of data and log files, together with the changes in mirroring status. It is important to monitor file growths and shrinkages; It would be a vast topic to explain why, but in an nutshell, it is because of possible performance issues. Every time a file is grown or shrunk, SQL Server will halt and wait for the disk system to make the file available again. And halt, in this case, means halt: no transactions processed until the action is completed.
These are the database events that are monitored:
- Data file auto grow
- Data file auto shrink
- Database mirroring status change
- Log file auto grow
- Log file auto shrink
Here is a script which will list the data file growths and shrinkages:
|
1 2 3 4 5 6 7 8 9 10 11 12 13 14 15 16 17 18 19 |
SELECT TE.name AS [EventName] , T.DatabaseName , t.DatabaseID , t.NTDomainName , t.ApplicationName , t.LoginName , t.SPID , t.Duration , t.StartTime , t.EndTime FROM sys.fn_trace_gettable(CONVERT(VARCHAR(150), ( SELECT TOP 1 f.[value] FROM sys.fn_trace_getinfo(NULL) f WHERE f.property = 2 )), DEFAULT) T JOIN sys.trace_events TE ON T.EventClass = TE.trace_event_id WHERE te.name = 'Data File Auto Grow' OR te.name = 'Data File Auto Shrink' ORDER BY t.StartTime ; |
The output of the script will not tell you why the database grew, but will show you how long it took to grow. (Be careful about the value of the Duration column, since it might be in milliseconds or in microseconds, depending on the SQL Server version).
Also, I would recommend extending this query to search for databases which took longer than, say, a second to grow (this is just a guideline).
Here is another query which will return the log growths and log shrinking.
|
1 2 3 4 5 6 7 8 9 10 11 12 13 14 15 16 17 18 19 |
SELECT TE.name AS [EventName] , T.DatabaseName , t.DatabaseID , t.NTDomainName , t.ApplicationName , t.LoginName , t.SPID , t.Duration , t.StartTime , t.EndTime FROM sys.fn_trace_gettable(CONVERT(VARCHAR(150), ( SELECT TOP 1 f.[value] FROM sys.fn_trace_getinfo(NULL) f WHERE f.property = 2 )), DEFAULT) T JOIN sys.trace_events TE ON T.EventClass = TE.trace_event_id WHERE te.name = 'Log File Auto Grow' OR te.name = 'Log File Auto Shrink' ORDER BY t.StartTime ; |
Also keep in mind that the query will not tell you if your junior DBA has been shrinking the data and log files. In the default trace we can find only the AUTO growth and shrink events and not the ones triggered by the ALTER DATABASE statement.
Errors and Warnings
Now let’s move on to the next section of the events: the Errors and Warnings. As we can see, there is an abundance of information here.
The Errorlog sub-event occurs when something is written to the SQL Server event log; Hash and Sort warnings happen generally when a sort or a hash match operation is spilled to disk (and since the disk subsystem is the slowest, then our queries become much slower.) Missing column statistics events will occur only when the ‘Auto create statistics’ option is set to off. In this case SQL Server indicates that it might have chosen a bad execution plan. The missing join predicate occurs when two tables do not have a join predicate and when both tables have more than one row. This can result in a long running queries or unexpected results.
These categories of errors and warnings are:
- Errorlog
- Hash warning
- Missing Column Statistics
- Missing Join Predicate
- Sort Warning
Here is a script which will outline the errors:
|
1 2 3 4 5 6 7 8 9 10 11 12 13 14 15 16 17 18 |
SELECT TE.name AS [EventName] , T.DatabaseName , t.DatabaseID , t.NTDomainName , t.ApplicationName , t.LoginName , t.SPID , t.StartTime , t.TextData , t.Severity , t.Error FROM sys.fn_trace_gettable(CONVERT(VARCHAR(150), ( SELECT TOP 1 f.[value] FROM sys.fn_trace_getinfo(NULL) f WHERE f.property = 2 )), DEFAULT) T JOIN sys.trace_events TE ON T.EventClass = TE.trace_event_id WHERE te.name = 'ErrorLog' |
Note that this script has neither EndTime nor Duration columns, for obvious reasons.
Here is another script which will outline the sort and hash warnings:
|
1 2 3 4 5 6 7 8 9 10 11 12 13 14 15 16 17 18 19 20 21 22 23 24 25 26 27 28 29 30 31 32 33 34 35 36 |
SELECT TE.name AS [EventName] , v.subclass_name , T.DatabaseName , t.DatabaseID , t.NTDomainName , t.ApplicationName , t.LoginName , t.SPID , t.StartTime FROM sys.fn_trace_gettable(CONVERT(VARCHAR(150), ( SELECT TOP 1 f.[value] FROM sys.fn_trace_getinfo(NULL) f WHERE f.property = 2 )), DEFAULT) T JOIN sys.trace_events TE ON T.EventClass = TE.trace_event_id JOIN sys.trace_subclass_values v ON v.trace_event_id = TE.trace_event_id AND v.subclass_value = t.EventSubClass WHERE te.name = 'Hash Warning' OR te.name = 'Sort Warnings' ... and finally, one more script which outlines the missing statistics and join predicates. SELECT TE.name AS [EventName] , T.DatabaseName , t.DatabaseID , t.NTDomainName , t.ApplicationName , t.LoginName , t.SPID , t.StartTime FROM sys.fn_trace_gettable(CONVERT(VARCHAR(150), ( SELECT TOP 1 f.[value] FROM sys.fn_trace_getinfo(NULL) f WHERE f.property = 2 )), DEFAULT) T JOIN sys.trace_events TE ON T.EventClass = TE.trace_event_id WHERE te.name = 'Missing Column Statistics' OR te.name = 'Missing Join Predicate' |
The Full Text Events
The Full-Text event category shows information about the Full-Text population events: If it is aborted, then you should look into the event log for a more detailed message; the FT Crawl Started sub-event indicates that the population request has been picked up by the workers. FT Crawl Stopped indicates either a successful completion or stop by error.
Full-Text events are…
- FT Crawl Aborted
- FT Crawl Started
- FT Crawl Stopped
Here is a script which will return the Full text events:
|
1 2 3 4 5 6 7 8 9 10 11 12 13 14 15 16 17 18 |
SELECT TE.name AS [EventName] , DB_NAME(t.DatabaseID) AS DatabaseName , t.DatabaseID , t.NTDomainName , t.ApplicationName , t.LoginName , t.SPID , t.StartTime , t.IsSystem FROM sys.fn_trace_gettable(CONVERT(VARCHAR(150), ( SELECT TOP 1 f.[value] FROM sys.fn_trace_getinfo(NULL) f WHERE f.property = 2 )), DEFAULT) T JOIN sys.trace_events TE ON T.EventClass = TE.trace_event_id WHERE te.name = 'FT:Crawl Started' OR te.name = 'FT:Crawl Aborted' OR te.name = 'FT:Crawl Stopped' |
Notice that the records in the DatabaseName column are null, so we have to get the database name from the DB_NAME() function.
Object events
Here is where the real detective work starts: the changes of the object. In this category we have altered, created and deleted objects, and this includes anything from index rebuilds, statistics updates, to database deletion.
Object events include:
- Object Altered
- Object Created
- Object Deleted
Here is a script which will give you the most recently manipulated objects in your databases.
|
1 2 3 4 5 6 7 8 9 10 11 12 13 14 15 16 17 18 19 20 21 22 23 24 25 26 27 28 29 30 31 32 33 34 35 36 37 38 39 40 41 42 43 44 45 46 47 48 49 50 51 52 53 54 55 56 57 58 59 60 61 62 63 64 65 66 67 68 69 70 71 72 73 74 75 76 77 78 79 80 81 82 83 84 85 86 87 88 89 90 91 92 93 94 95 96 97 98 99 100 101 102 103 104 105 |
SELECT TE.name , v.subclass_name , DB_NAME(t.DatabaseId) AS DBName , T.NTDomainName , t.NTUserName , t.HostName , t.ApplicationName , t.LoginName , t.Duration , t.StartTime , t.ObjectName , CASE t.ObjectType WHEN 8259 THEN 'Check Constraint' WHEN 8260 THEN 'Default (constraint or standalone)' WHEN 8262 THEN 'Foreign-key Constraint' WHEN 8272 THEN 'Stored Procedure' WHEN 8274 THEN 'Rule' WHEN 8275 THEN 'System Table' WHEN 8276 THEN 'Trigger on Server' WHEN 8277 THEN '(User-defined) Table' WHEN 8278 THEN 'View' WHEN 8280 THEN 'Extended Stored Procedure' WHEN 16724 THEN 'CLR Trigger' WHEN 16964 THEN 'Database' WHEN 16975 THEN 'Object' WHEN 17222 THEN 'FullText Catalog' WHEN 17232 THEN 'CLR Stored Procedure' WHEN 17235 THEN 'Schema' WHEN 17475 THEN 'Credential' WHEN 17491 THEN 'DDL Event' WHEN 17741 THEN 'Management Event' WHEN 17747 THEN 'Security Event' WHEN 17749 THEN 'User Event' WHEN 17985 THEN 'CLR Aggregate Function' WHEN 17993 THEN 'Inline Table-valued SQL Function' WHEN 18000 THEN 'Partition Function' WHEN 18002 THEN 'Replication Filter Procedure' WHEN 18004 THEN 'Table-valued SQL Function' WHEN 18259 THEN 'Server Role' WHEN 18263 THEN 'Microsoft Windows Group' WHEN 19265 THEN 'Asymmetric Key' WHEN 19277 THEN 'Master Key' WHEN 19280 THEN 'Primary Key' WHEN 19283 THEN 'ObfusKey' WHEN 19521 THEN 'Asymmetric Key Login' WHEN 19523 THEN 'Certificate Login' WHEN 19538 THEN 'Role' WHEN 19539 THEN 'SQL Login' WHEN 19543 THEN 'Windows Login' WHEN 20034 THEN 'Remote Service Binding' WHEN 20036 THEN 'Event Notification on Database' WHEN 20037 THEN 'Event Notification' WHEN 20038 THEN 'Scalar SQL Function' WHEN 20047 THEN 'Event Notification on Object' WHEN 20051 THEN 'Synonym' WHEN 20549 THEN 'End Point' WHEN 20801 THEN 'Adhoc Queries which may be cached' WHEN 20816 THEN 'Prepared Queries which may be cached' WHEN 20819 THEN 'Service Broker Service Queue' WHEN 20821 THEN 'Unique Constraint' WHEN 21057 THEN 'Application Role' WHEN 21059 THEN 'Certificate' WHEN 21075 THEN 'Server' WHEN 21076 THEN 'Transact-SQL Trigger' WHEN 21313 THEN 'Assembly' WHEN 21318 THEN 'CLR Scalar Function' WHEN 21321 THEN 'Inline scalar SQL Function' WHEN 21328 THEN 'Partition Scheme' WHEN 21333 THEN 'User' WHEN 21571 THEN 'Service Broker Service Contract' WHEN 21572 THEN 'Trigger on Database' WHEN 21574 THEN 'CLR Table-valued Function' WHEN 21577 THEN 'Internal Table (For example, XML Node Table, Queue Table.)' WHEN 21581 THEN 'Service Broker Message Type' WHEN 21586 THEN 'Service Broker Route' WHEN 21587 THEN 'Statistics' WHEN 21825 THEN 'User' WHEN 21827 THEN 'User' WHEN 21831 THEN 'User' WHEN 21843 THEN 'User' WHEN 21847 THEN 'User' WHEN 22099 THEN 'Service Broker Service' WHEN 22601 THEN 'Index' WHEN 22604 THEN 'Certificate Login' WHEN 22611 THEN 'XMLSchema' WHEN 22868 THEN 'Type' ELSE 'Hmmm???' END AS ObjectType FROM [fn_trace_gettable](CONVERT(VARCHAR(150), ( SELECT TOP 1 value FROM [fn_trace_getinfo](NULL) WHERE [property] = 2 )), DEFAULT) T JOIN sys.trace_events TE ON T.EventClass = TE.trace_event_id JOIN sys.trace_subclass_values v ON v.trace_event_id = TE.trace_event_id AND v.subclass_value = t.EventSubClass WHERE TE.name IN ( 'Object:Created', 'Object:Deleted', 'Object:Altered' ) -- filter statistics created by SQL server AND t.ObjectType NOT IN ( 21587 ) -- filter tempdb objects AND DatabaseID <> 2 -- get only events in the past 24 hours AND StartTime > DATEADD(HH, -24, GETDATE()) ORDERBY t.StartTime DESC ; |
Keep in mind that SQL Server by default has five trace files, 20 MB each and there is no known supported method of changing this. If you have a busy system, the trace files may roll over far too fast (even within hours) and you may not be able to catch some of the changes. This article will not discuss in detail any workarounds for efficient SQL Server tracing, instead I will do this in a separate article later on.
Security Audit Events
Another part of the default trace is the Security Audit. As you can see from the event list below, this is one of the richest parts of the default trace. In general, what this event group tells us is what significant security events are occurring in our system.
Security events include…
- Audit Add DB user event
- Audit Add login to server role event
- Audit Add Member to DB role event
- Audit Add Role event
- Audit Add login event
- Audit Backup/Restore event
- Audit Change Database owner
- Audit DBCC event
- Audit Database Scope GDR event (Grant, Deny, Revoke)
- Audit Login Change Property event
- Audit Login Failed
- Audit Login GDR event
- Audit Schema Object GDR event
- Audit Schema Object Take Ownership
- Audit Server Starts and Stops
Let’s take it one step at a time and:
- create a SQL Server login
- assign read permissions to this user in one of our databases.
By running the following query we will be able to track what users have been created on our SQL Server instance:
|
1 2 3 4 5 6 7 8 9 10 11 12 13 14 15 16 17 18 19 20 21 22 23 24 |
SELECT TE.name AS [EventName] , v.subclass_name , T.DatabaseName , t.DatabaseID , t.NTDomainName , t.ApplicationName , t.LoginName , t.SPID , t.StartTime , t.RoleName , t.TargetUserName , t.TargetLoginName , t.SessionLoginName FROM sys.fn_trace_gettable(CONVERT(VARCHAR(150), ( SELECT TOP 1 f.[value] FROM sys.fn_trace_getinfo(NULL) f WHERE f.property = 2 )), DEFAULT) T JOIN sys.trace_events TE ON T.EventClass = TE.trace_event_id JOIN sys.trace_subclass_values v ON v.trace_event_id = TE.trace_event_id AND v.subclass_value = t.EventSubClass WHERE te.name IN ( 'Audit Addlogin Event', 'Audit Add DB User Event', 'Audit Add Member to DB Role Event' ) AND v.subclass_name IN ( 'add', 'Grant database access' ) |
Here is how the result of the query looks like after we have created one login with giving it read permission to one database:

As we can see, the first row is announcing the creation of the login in the master database, together with the creator (SessionLoginName column) and the create user (TargetLoginName column).
The next two rows are as follows: creating the database user and granting it database access, and last – adding the database user to a DB role.
Keep in mind that if you add the user to more than one role and if you give the login access to more than one database, then you will see several rows noting every event in your default trace.
Now let’s audit the dropped users and logins by running the following query:
|
1 2 3 4 5 6 7 8 9 10 11 12 13 14 15 16 17 18 19 20 21 22 23 24 |
SELECT TE.name AS [EventName] , v.subclass_name , T.DatabaseName , t.DatabaseID , t.NTDomainName , t.ApplicationName , t.LoginName , t.SPID , t.StartTime , t.RoleName , t.TargetUserName , t.TargetLoginName , t.SessionLoginName FROM sys.fn_trace_gettable(CONVERT(VARCHAR(150), ( SELECT TOP 1 f.[value] FROM sys.fn_trace_getinfo(NULL) f WHERE f.property = 2 )), DEFAULT) T JOIN sys.trace_events TE ON T.EventClass = TE.trace_event_id JOIN sys.trace_subclass_values v ON v.trace_event_id = TE.trace_event_id AND v.subclass_value = t.EventSubClass WHERE te.name IN ( 'Audit Addlogin Event', 'Audit Add DB User Event', 'Audit Add Member to DB Role Event' ) AND v.subclass_name IN ( 'Drop', 'Revoke database access' ) |
As you can see, the event name is the same for both creating and dropping logins: i.e. Audit Addlogin Event, however the subclass column value is what defines the difference, ie. In the case of creation of a login the subclass would be ‘Add’ and in the case of deletion it would be ‘Drop’.
In fact, if we drop the database user and the SQL login we created earlier, this query will return two rows – one for each event together with the dropped user and login names and the login name of the user who deleted the user and the login.
The following query will give us all the failed logins contained in our default trace file:
|
1 2 3 4 5 6 7 8 9 10 11 12 13 14 15 16 17 18 |
SELECT TE.name AS [EventName] , v.subclass_name , T.DatabaseName , t.DatabaseID , t.NTDomainName , t.ApplicationName , t.LoginName , t.SPID , t.StartTime , t.SessionLoginName FROM sys.fn_trace_gettable(CONVERT(VARCHAR(150), ( SELECT TOP 1 f.[value] FROM sys.fn_trace_getinfo(NULL) f WHERE f.property = 2 )), DEFAULT) T JOIN sys.trace_events TE ON T.EventClass = TE.trace_event_id JOIN sys.trace_subclass_values v ON v.trace_event_id = TE.trace_event_id AND v.subclass_value = t.EventSubClass WHERE te.name IN ( 'Audit Login Failed' ) |
There are quite a few events in the Security Audit class and for the sake of compactness of this article I will turn your attention only to one more event, namely to the ‘Audit Server Starts and Stops’.
The following query will give you only the server start event:
|
1 2 3 4 5 6 7 8 9 10 11 12 13 14 15 16 17 18 19 |
SELECT TE.name AS [EventName] , v.subclass_name , T.DatabaseName , t.DatabaseID , t.NTDomainName , t.ApplicationName , t.LoginName , t.SPID , t.StartTime , t.SessionLoginName FROM sys.fn_trace_gettable(CONVERT(VARCHAR(150), ( SELECT TOP 1 f.[value] FROM sys.fn_trace_getinfo(NULL) f WHERE f.property = 2 )), DEFAULT) T JOIN sys.trace_events TE ON T.EventClass = TE.trace_event_id JOIN sys.trace_subclass_values v ON v.trace_event_id = TE.trace_event_id AND v.subclass_value = t.EventSubClass WHERE te.name IN ( 'Audit Server Starts and Stops' ) |
Yes, you read it correctly: the above query will return only the Server Start event, and never the Server Stop event. Here is the explanation: as I mentioned earlier, SQL Server’s default trace consists of five trace files in total, which are 20 MB each. These five trace files are rotated (‘refurbrished’ or ‘recycled’, if you like) upon several conditions: when the instance starts or when the file size reaches 20 MB. Now, let’s think about this for a second: the queries I have listed so far in this article are returning the results only from the current trace file, i.e. the most recent one. Further, since the default trace file is rolled over every time the instance starts, this means that the event indicating the Server Stop will remain in the previous default trace file. Put simply, after the SQL Service restarts, our current default trace file will have the Server Start event as a first row. If you really wish to know when your SQL Server instance was stopped, you will need to include at least the contents of the previous file, but in fact we can include the contents of the other four default trace files to our result set. We can do this by changing the way we call sys.fn_trace_gettable so that it appends all default trace files. This function accepts 2 parameters – file location and name and number of files; if we pass as the first parameter the file location and the name of the oldest default trace file, then the sysfn_trace_gettable will append the newest ones, as long as we specify the appropriate value for the second parameter (the number of files). If we specify the newest file as a parameter to the function (as it is the case in all scripts in this article) then the older files will not be appended. As the filename contains the index of the file and they increment as each new file is created, it is easy to calculate the name of the oldest file.
To find the exact file location of the default trace files, you just need to execute the following query:
|
1 2 3 |
SELECT REVERSE(SUBSTRING(REVERSE(path), CHARINDEX('\', REVERSE(path)), 256)) AS DefaultTraceLocation FROM sys.traces WHERE is_default = 1 |
Server Memory Change Events
And now, let’s move on to the last event class in our default trace: the Server class. It contains only one event – Server Memory Change.
The following query will tell us when the memory use has changed:
|
1 2 3 4 5 6 7 8 9 10 11 12 |
SELECT TE.name AS [EventName] , v.subclass_name , t.IsSystem FROM sys.fn_trace_gettable(CONVERT(VARCHAR(150), ( SELECT TOP 1 f.[value] FROM sys.fn_trace_getinfo(NULL) f WHERE f.property = 2 )), DEFAULT) T JOIN sys.trace_events TE ON T.EventClass = TE.trace_event_id JOIN sys.trace_subclass_values v ON v.trace_event_id = TE.trace_event_id AND v.subclass_value = t.EventSubClass WHERE te.name IN ( 'Server Memory Change' ) |
The event subclass indicates if the memory has increased or decreased.
Conclusion
The default trace is a very powerful way to examine the health and the security of your SQL Server instance. There are several pitfalls to keep in mind – mainly related to file rollovers and size limitations, but with some programming the workarounds are not impossible. It is important to remember that the queries presented in this article will return the result from the single most recent default trace file. Depending on how busy the SQL Server instance is, the files may roll over way too fast for a DBA to catch all significant events; therefore, some automation is needed.
Load comments