Statistics are critical metadata used by SQL Server’s query optimizer, which influence the selected execution plan for a query. The optimizer obtains its knowledge of the data, its distribution, and the number of rows a given query is likely to return from the available statistics. Based on this knowledge, it decides the optimal access path, making choices such as whether to scan a table or perform an index seek, use a nested loop join or a hash join, and so on.
If statistics are out of date, or do not exist, the optimizer can make poor choices and execution plan quality, and consequently query performance, can suffer. SQL Server can automatically maintain statistics, periodically refreshing them based on its tracking of data modifications. However, for some tables, such as those subject to significant changes in distribution, or those with skewed values, it’s possible that SQL Server’s automatic statistics update will be inadequate to maintain consistently high levels of query performance.
In this article, I’ll describe, briefly, when SQL Server creates statistics and its criteria for performing automatic statistics updates. I’ll then explain, in more detail, why automatic updates to statistics may not be sufficient, and what data you can gather and monitor to help you manage statistics manually, and proactively, rather than in response to query performance issues.
Statistics and Database Maintenance Tasks
Database backups, integrity checks, and performance optimizations form the core of a DBA’s regular maintenance tasks. Backups are usually at the top of the list, as data is one of the most important, if not the most important, facets of a business. If there is any problem with the production database, it must be possible to recover the data. Integrity checks are also essential as database corruption must be found and corrected as quickly as possible, to mitigate downtime and data loss.
Finally, a DBA has to ensure that performance is optimal, and ensuring that statistics remain up-to-date and accurate is an important part of this task. However, perhaps because SQL Server does update statistics automatically, whereas it doesn’t, for example, automatically defragment indexes, it’s easy for a DBA to overlook this task.
The problem is that, in certain cases, SQL Server’s automatic statistics maintenance may update the statistics too infrequently, or not provide the optimizer enough information to define properly the data distribution. This is when the DBA may need to step in and manage statistics manually.
When SQL Server Creates Statistics
First, SQL Server will create an associated Statistics object every time we create an index. We refer to these as index statistics. These statistics will exist as long as the index exists. Note that since an index rebuild operation recreates the index, SQL Server will also update the index Statistics object.
Second, assuming the database option Auto Create Statistics is enabled, which it is by default, SQL Server will create single-column statistics whenever a column, which is not already the leading column in an existing index, is used in a query predicate (e.g. in the search condition of a WHERE clause, or in a JOIN condition). We refer to these as column statistics. We can also use the CREATE STATISTICS command (http://msdn.microsoft.com/en-us/library/ms188038.aspx) to create single- and multi-column statistics manually.
In essence, statistics are a histogram describing the data distribution in a column. The statistics are stored in system tables in the database. In a multi-column statistic, whether index or column-level, the histogram only exists for the first column (they are “left-based”). For example, if the index is on (ID, LastName, FirstName), the histogram for the index statistic is on ID. If we write a query, SELECT * FROM dbo.table WHERE LastName = 'Smith', then SQL Server will create a column statistic on LastName only (assuming LastName is not the leading column in another existing index).
How SQL Server Manages Statistics
After working with clients for several years, I realized there was some confusion surrounding indexes and statistics, particularly among “accidental” DBAs, or those that were new to database administration. While many recognized that indexes and statistics were two distinct entities, they didn’t always understand when each would update.
As we add, delete or modify rows in a table, SQL Server adds, deletes or modifies corresponding rows in the indexes. For example, if we modify the value for ProductID for a record, SQL Server will also modify the corresponding record in any indexes that contain that column. Some DBAs assume SQL Server updates statistics in a similar fashion i.e. every time we add, remove or modify data. In fact, this is not how it works. Assuming the Auto Update Statistics database option is enabled for the SQL Server instance, SQL Server will automatically update the statistics, but only after a certain “volume threshold” of changes to the data.
Every time we modify a record in a table, SQL Server tracks it via the rcmodified column in a hidden system table. SQL Server 2005 tracked this information in the sys.rowsetcolumns table, In SQL Server 2008 (and later) sys.rowsetcolumns merged with sys.syshobtcolumns and became sys.sysrscols (covered in more detail later in the article). In general, when 20% of the rows in a table, plus 500, have been modified, SQL Server considers the associated column and/or index statistics objects to be ‘stale’. SQL Server will update each invalidated object, automatically, the next time the query optimizer needs to use that statistic.
When SQL Server auto-updates statistics
For more details on when, generally, SQL Server will automatically update statistics objects, see my article, Understanding when statistics will automatically update. For details on one or two other cases where SQL Server will update statistics, please see Statistics Used by the Query Optimizer in Microsoft SQL Server 2008.
What this means is that over time, as business processes modify data in a table, the associated statistics can become progressively ‘stale’ and less accurate in their representation of the data. At a certain volume threshold of modifications, as described above, SQL Server will automatically update the statistics. However, in some cases it’s possible that the optimizer will start to make poor choices for an execution plan, before the automatic update occurs.
The second important point to consider, in addition to the volume of changes that will trigger an automatic update, is the degree of accuracy of the auto-updated statistics. When we create or rebuild (not reorganize, just rebuild) an index, SQL Server generates the statistics with a FULLSCAN, i.e. it scans all the rows in the table to create a histogram that represents the distribution of data in the leading column of the index. Likewise, SQL will auto-create column statistics with a full sample.
Index rebuilds on partitioned tables
Note that in SQL Server 2012, index rebuilds for partitioned tables do not perform a full scan. See http://blogs.msdn.com/b/psssql/archive/2013/03/19/sql-server-2012-partitioned-table-statistics-update-behavior-change-when-rebuilding-index.aspx for more details.
However, when SQL Server automatically updates a statistic, if the table is more than 8 MB in size then it uses a default sample, which is less than the full sample that SQL Server uses when creating the statistic (this is non-configurable). The automatic update samples only from selected pages (the sampling is not actually random; see http://blogs.msdn.com/b/conor_cunningham_msft/archive/2008/07/24/statistics-sample-rates.aspx) in the index or table. Those samples may not capture the interesting details about a column or set of columns. As a result, the default sample may not create a histogram that accurately represents the distribution of data in the column.
Are SQL Server’s automatic updates to statistics adequate?
Many systems rely solely on SQL Server to update statistics automatically, and many of those systems consistently perform well. However, there are always exceptions. Large tables, tables with uneven data distributions, tables with ever-increasing keys and tables that have significant changes in distribution often require manual statistics updates.
If a table is very big, perhaps more than 100 million rows, then waiting for 20% of rows to change before SQL Server automatically updates the statistics could mean that millions of rows are modified, added or removed before it happens. Depending on the workload patterns and the data, this could mean the optimizer is choosing a substandard execution plans long before SQL Server reaches the threshold where it invalidates statistics for a table and starts to update them automatically. In such cases, you might consider updating statistics manually for those tables on a defined schedule (while leaving AUTOUPDATESTATISTICS enabled so that SQL Server continues to maintain statistics for other tables).
In cases where you know data distribution in a column is “skewed”, it may be necessary to update statistics manually with a full sample, or create a set of filtered statistics (not covered further in this article), in order to generate query plans of good quality. Remember, however, that sampling with FULLSCAN can be costly for larger tables, and must be done so as not to affect production performance.
It is quite common to see an ascending key, such as an IDENTITY or date/time data types, used as the leading column in an index. In such cases, the statistic for the key rarely matches the actual data, unless we update the Statistic manually after every insert (not likely). For example, consider the Sales.SalesOrderDetail table in the AdventureWorks2012 database, and imagine that we wanted to retrieve the CustomerID, SalesPersonID, and TotalDue and for all orders with an OrderDate in the current week.
We could create a non-clustered index with OrderDate as the leading column, and include as part of the key the CustomerID, SalesPersonID, and TotalDue columns. If we had a scheduled job that updated statistics on Sunday morning at 1:00 AM, the highest value in the histogram would be for the most recent order placed i.e. Sunday at 1:00 AM, at latest.
As customers place orders during the week, new rows are added to the table. By the end of the week, it might contain thousands of new rows but, if the table is big enough, this volume of change still may not trigger SQL Server’s automatic statistics update, and according to the statistic, there would only be one row for any date beyond Sunday at 1:00 AM. It is very common to see large differences between the estimated and actual rows in a statistic when an ascending key exists.
How You Can Manage Statistics
In cases where we feel that the frequency or accuracy SQL Server’s automatic statistics updates is inadequate for a table, we have the option to maintain those statistics manually. For example, we can create a maintenance job that will run the UPDATE STATISTICS (http://msdn.microsoft.com/en-us/library/ms187348.aspx) command, and update statistics on a regular schedule. We can run the command for a table, in which case it will update all index statistics and column statistics on that table, or we can target specific index statistics or column statistics. However, we must consider carefully when to execute this job.
Many teams simply incorporate manual statistics updates into their regular index maintenance schedule. Some DBA teams rebuild all of their indexes on a regular schedule, say once a week, in which case they are also updating index statistics on a weekly basis since, as discussed, rebuilding an index will update the statistics with a FULLSCAN. Note that, for this reason, it is a waste of resources to rebuild indexes and then immediately run a job to update statistics for those indexes. I’ve even seen cases where immediately after index rebuilds, a scheduled job updated the statistics, but using the default sample, so in effect reducing the sampling size, and therefore accuracy of the statistics. A better option, after a rebuild of all indexes, would be to update only column statistics, i.e. those auto-created by SQL Server, as these are unaffected by index rebuilds.
Overall, though, regular rebuilding of all the indexes in a database is a poor way to manage indexes. You’ll inevitably waste resources rebuilding indexes that are not fragmented. In addition, it can affect the availability of a system, particularly if you’re running Standard Edition where index rebuilds are performed offline (although for some systems, this option works because the database does not have to be online 24×7 and it completes in the available maintenance window). Note that there are additional considerations, even in Enterprise Edition, that affect the ability to rebuild indexes online (e.g. LOB and XML data).
A better, and more common, approach is to implement a maintenance task that rebuilds or reorganizes indexes based on fragmentation. Indexes that we rebuild will have their statistics updated as part of that task. For other statistics, such as those for indexes that we reorganize, or column statistics, we can update the statistics as part of a separate task, or leave SQL Server to manage them automatically.
Collecting Data for Proactive Management of Statistics
In general, the manual management of statistics occurs as a reactive response to specific performance problems. In other words, performance of certain queries starts to suffer due to poor execution plans generated by the optimizer. The DBA suspects the cause is inaccurate and outdated statistics and implements a manual statistics update regime for the affected tables.
However, this reactive approach to optimization is often stressful. Ideally, manual statistic updates are targeted and occur before issues arise, but the practice of proactively monitoring statistics is rare and often an after-thought.
Certain indicators can tell you, ahead of time, that SQL Server’s automatic statistics updates are likely to be inadequate for a table. It comes down to knowing your data, for example, knowing the size of the table, column density (to try to predict data skew), the volatility of the data, those subject to large data loads, the presence of ascending keys, and so on.
We can get some of this information by examining the existing statistics for our tables. In addition to this, we can start actively tracking changes in the volume of data in our tables, and the rate of changes of rows within the table, and then target our manual statistics updates at the tables that really need it.
Let’s discuss each of these elements in turn, first how to examine existing statistics, and then how to start tracking data volume changes, and rate of data modifications, on our tables.
Examining Statistics
Let’s look at the Sales.SalesOrderDetail table in the AdventureWorks2012 database. It has a clustered index, PK_SalesOrderDetail_SalesOrderID_SalesOrderDetailID, and two non-clustered indexes, AK_SalesOrderDetail_rowguid and IX_SalesOrderDetail_ProductID.
|
1 2 3 |
USE [AdventureWorks2012]; GO EXEC sp_helpindex "Sales.SalesOrderDetail"; |

Listing 1: Indexes on the SalesOrderDetail table in AdventureWorks2012
There is a Statistics folder for the SalesOrderDetail table in SSMS Object Explorer and in it we can see four statistics objects.
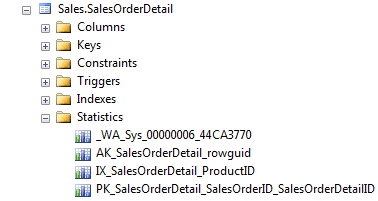
The bottom three represent the statistics associated with the table’s three indexes. The first statistic, _WA_Sys_*, is on the SalesOrderDetailID column, and SQL Server created it automatically.
However, a much better way to view statistics is via the sys.stats catalog view. Those of you on older versions of SQL Server, or those of you who have been using SQL Server for a long time, may still be using the system-stored procedure, sp_helpstats. I like sp_helpstats because it lists the columns in the statistic, but it is a deprecated feature and may be removed in a future release of SQL Server. In addition, the sys.stats catalog view provides significantly more information about a statistic, as shown in Listing 2.
|
1 2 3 4 5 6 7 8 9 10 11 12 13 14 15 16 17 18 19 20 21 22 23 24 25 26 27 28 29 30 31 32 33 34 35 36 |
USE [AdventureWorks2012]; GO EXEC sp_helpstats 'Sales.SalesOrderDetail', 'ALL'; GO SELECT [sch].[name] + '.' + [so].[name] AS [TableName] , [si].[index_id] AS [Index ID] , [ss].[name] AS [Statistic] , STUFF(( SELECT ', ' + [c].[name] FROM [sys].[stats_columns] [sc] JOIN [sys].[columns] [c] ON [c].[column_id] = [sc].[column_id] AND [c].[object_id] = [sc].[OBJECT_ID] WHERE [sc].[object_id] = [ss].[object_id] AND [sc].[stats_id] = [ss].[stats_id] ORDER BY [sc].[stats_column_id] FOR XML PATH('') ), 1, 2, '') AS [ColumnsInStatistic] , [ss].[auto_Created] AS [WasAutoCreated] , [ss].[user_created] AS [WasUserCreated] , [ss].[has_filter] AS [IsFiltered] , [ss].[filter_definition] AS [FilterDefinition] , [ss].[is_temporary] AS [IsTemporary] FROM [sys].[stats] [ss] JOIN [sys].[objects] AS [so] ON [ss].[object_id] = [so].[object_id] JOIN [sys].[schemas] AS [sch] ON [so].[schema_id] = [sch].[schema_id] LEFT OUTER JOIN [sys].[indexes] AS [si] ON [so].[object_id] = [si].[object_id] AND [ss].[name] = [si].[name] WHERE [so].[object_id] = OBJECT_ID(N'Sales.SalesOrderDetail') ORDER BY [ss].[user_created] , [ss].[auto_created] , [ss].[has_filter]; GO |

Listing 2: Output of sp_helpstats compared to querying sys.stats
If you’re using SQL Server 2005 or higher, I highly recommend taking advantage of sys.stats, and using sys.stats_columns to list the columns for a statistic.
Once we know what statistics exist for an object, one way to get more details on that object, including when it was last updated, is via DBCC SHOW_STATISTICS.
|
1 2 3 |
USE [AdventureWorks2012]; DBCC SHOW_STATISTICS ("Sales.SalesOrderDetail", IX_SalesOrderDetail_ProductID); |
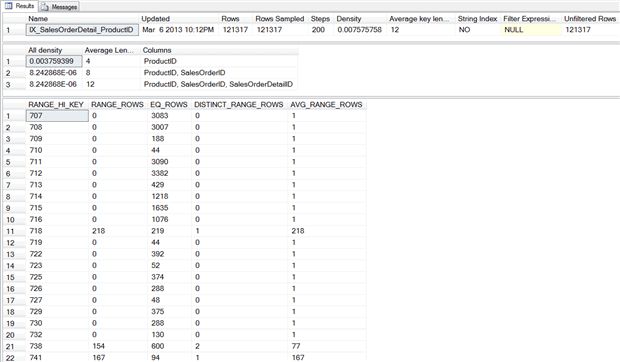
Listing 3: Statistics for IX_SalesOrderDetail_ProductID
The Updated column in the statistics header displays the last time statistic was updated, whether it was via an automatic or manual update. We can use the Rows and Rows_Sampled columns to determine whether the sample rate was 100% (FULLSCAN) or something less.
The density vector, which is the second set of information, provides detail regarding the uniqueness of the columns. The optimizer can use the density value for the left-based column in the key to estimate how many rows would return for any given value in the table. Density is calculated as “1/unique number of values in the column”.
The final section of the output, the histogram, provides detailed information, also used by the optimizer. A histogram can have a maximum of 200 steps, and the histogram displays the number of rows equal to each step, as well as number of rows between steps, number of distinct values in the step, and the average number of rows per value in the step.
Data Volume Changes and Rate of Modification
In order to understand when statistics should be updated manually, versus automatically by SQL Server, you have to know your data. For a DBA that manages hundreds of databases, this can be a challenge, but information is available in SQL Server that can help you make informed decisions related to updates. Two critical pieces of data you can capture are net change in volume of data in the table, and rate of change of rows within the table. If we know this data, we can target first large tables that are subject to rapid change.
Volume of data
To monitor the change in the number of rows for a table over time, use any of the following catalog or Dynamic Management Views:
sys.partitions– provide the number of rows in the tablesys.dm_db_partition_stats– provides row counts plus page counts, per partitionsys.dm_db_index_physical_stats– provides the number of rows and pages, plus information about fragmentation, forwarded rows and more
By tracking changes in row counts over time, we measure simply the net change in volume of data. The sys.partitions and sys.dm_db_partition_stats provide the easiest route to trending the change in the number of rows. However, if you’re already using sys.dm_db_index_physical_stats to manage index fragmentation, then it should be simple to modify existing scripts to capture the number of rows as well. Note that you must use the DETAILED option with sys.dm_db_index_physical_stats to return the number of rows in the table, and be aware that running this DMV generates a significant real-time overhead that can affect system performance.
|
1 2 3 4 5 6 7 8 9 10 11 12 13 14 15 16 17 18 19 20 21 22 |
USE [AdventureWorks2012]; GO SELECT OBJECT_NAME([p].[object_id]) AS [Table] , [p].[index_id] AS [Index ID] , [i].[name] AS [Index] , [p].[rows] AS "Number of Rows" FROM [sys].[partitions] AS [p] JOIN [sys].[indexes] AS [i] ON [p].[object_id] = [i].[object_id] AND [p].[index_id] = [i].[index_id] WHERE [p].[object_id] = OBJECT_ID(N'Sales.SalesOrderDetail'); SELECT OBJECT_NAME([ips].[object_id]) AS [Table] , [ips].[index_id] AS [Index ID] , [i].[name] AS [Index] , [ips].[record_count] AS [NumberOfRows] FROM [sys].[dm_db_index_physical_stats](DB_ID(N'AdventureWorks2012'), OBJECT_ID(N'Sales.SalesOrderDetail'), NULL, NULL, 'DETAILED') AS [ips] JOIN [sys].[indexes] AS [i] ON [ips].[object_id] = [i].[object_id] AND [ips].[index_id] = [i].[index_id] WHERE [ips].[index_level] = 0; |

Listing 4: Using sys.partitions or sys.dm_db_index_physical_stats to track data volume in a table
Rate of Change
Changes in data volume, while valuable, do not provide a complete picture of database activity. For staging tables, nearly the same number of records can be added to and deleted from the table each day, and a snapshot of the number of rows would suggest the table is static. However, the records added and deleted may have very different values, which can dramatically alter the distribution of data in a database, rendering statistics meaningless, possibly before the optimizer would label them as invalidated and update them automatically.
In such cases, it helps to track the number of modifications for a table and we can do this in several ways, although for reasons we’ll discuss, only the last two are good approaches:
rowmodctrinsys.sysindexesrcmodifiedinsys.sysrscolsmodified_countinsys.system_internals_partition_columnsleaf_*_count columnsinsys.dm_db_index_operational_statsmodification_counterinsys.dm_db_stats_properties
While the sys.sysindexes system table is still available in SQL Server 2012, Microsoft plans to remove it in a future release, so don’t use it to track modifications unless you have no choice. Anyone still using SQL Server 2000 could utilize this option.
sys.sysrscols is a hidden system table and accessing it requires the Dedicated Admin Connection, which is not conducive to scheduled maintenance. As such, it is not a practical option for tracking modification. For more information on rcmodified in sys.sysrscols, please see the article, How are per-column modification counts tracked?, which explains how it could be used to examine modifications in detail.
sys.system_internals_partition_columns is a system internal view, which means that it is reserved for Microsoft SQL Server. It tracks modifications in a similar fashion to sys.sysrscols, but you don’t need the DAC to view it. While a better option than sys.sysrscols, its information is still not a good basis on which to build maintenance strategy, because Microsoft makes no promises that the behavior of hidden system tables will be consistent from one release to the next.
Finally, we arrive at the two viable options. We can track the number of modifications using sys.dm_db_index_operational_stats by summing the leaf_insert_count, leaf_update_count, leaf_delete_count and leaf_ghost_count columns. However, the count columns do not track modifications in the same manner as sys.sysrscols and sys.system_internals_partition_columns, as we’ll see in the next section.
For systems running SQL Server 2008R2 SP2 or SQL Server 2012 SP1, we can also use the new sys.dm_db_stats_properties DMV to monitor table modifications, using the modification_counter column; we’ll examine this approach next.
How SQL Server tracks data modifications internally (demo)
One of the easiest ways to illustrate how SQL Server tracks modifications is to walk through an example of how the system tables and DMVs change, in response to record modifications, using sys.system_internals_partition_columns, sys.dm_db_index_operational_stats or sys.dm_db_stats_properties. We’ll then discuss how you can use this information to start measuring the rate of change of data in your tables.
First, create a copy of the Sales.SalesOrderDetail table in the AdventureWorks2012 database and insert 100 rows, as shown in Listing 5. The CHECKPOINT statement after the INSERT statement ensures that we flush from cache any modifications to the system tables, so that they appear in the hidden system table output.
|
1 2 3 4 5 6 7 8 9 10 11 12 13 14 15 16 17 18 19 20 21 22 23 24 25 26 27 28 29 30 31 32 33 34 35 36 37 38 39 40 41 42 43 44 45 46 47 |
USE [AdventureWorks2012]; GO CREATE TABLE [Sales].[TestSalesOrderDetail] ( [SalesOrderID] [int] NOT NULL , [SalesOrderDetailID] [int] IDENTITY(1, 1) NOT NULL , [CarrierTrackingNumber] [nvarchar](25) NULL , [OrderQty] [smallint] NOT NULL , [ProductID] [int] NOT NULL , [SpecialOfferID] [int] NOT NULL , [UnitPrice] [money] NOT NULL , [UnitPriceDiscount] [money] NOT NULL , [LineTotal] AS ( ISNULL(( [UnitPrice] * ( ( 1.0 ) - [UnitPriceDiscount] ) ) * [OrderQty], ( 0.0 )) ) , [rowguid] [uniqueidentifier] ROWGUIDCOL NOT NULL , [ModifiedDate] [datetime] NOT NULL ); INSERT INTO [Sales].[TestSalesOrderDetail] ( [SalesOrderID] , [CarrierTrackingNumber] , [OrderQty] , [ProductID] , [SpecialOfferID] , [UnitPrice] , [UnitPriceDiscount] , [rowguid] , [ModifiedDate] ) SELECT TOP 100 [SalesOrderID] , [CarrierTrackingNumber] , [OrderQty] , [ProductID] , [SpecialOfferID] , [UnitPrice] , [UnitPriceDiscount] , [rowguid] , [ModifiedDate] FROM [Sales].[SalesOrderDetail]; GO CHECKPOINT; GO |
Listing 5: Creating and populating Sales.TestSalesOrderDetail
The first two queries in Listing 6 interrogate sys.system_internals_partition_columns and sys.dm_db_index_operational_stats, respectively, to return the number of recorded modifications for the Sales.TestSalesOrderDetail table. The former tracks modifications per column, and each column, as expected is subject to 100 modifications. The latter view simply returns the total number of modifications, whether they are inserts, updates or deletes.
The final query against sys.dm_db_stats_properties returns no rows, confirming that no statistics currently exist. In this example, we use a statistic with stats_id of 1, but the query returns no rows regardless of the stats_id used.
|
1 2 3 4 5 6 7 8 9 10 11 12 13 14 15 16 17 18 19 20 21 22 23 24 25 26 27 28 29 30 31 32 33 34 35 36 37 38 39 40 41 |
USE [AdventureWorks2012]; GO SELECT OBJECT_NAME([p].[object_id]) AS [Table] , [p].[index_id] AS [Index ID] , [i].[name] AS [Index] , [ipc].[partition_column_id] AS [Index_Column_ID] , [ipc].[modified_count] AS [Modifications] FROM [sys].[system_internals_partition_columns] AS [ipc] JOIN [sys].[partitions] AS [p] ON [ipc].[partition_id] = [p].[partition_id] JOIN [sys].[indexes] AS [i] ON [p].[object_id] = [i].[object_id] AND [p].[index_id] = [i].[index_id] WHERE [p].[object_id] = OBJECT_ID(N'Sales.TestSalesOrderDetail'); SELECT OBJECT_NAME([ios].[object_id]) AS [Table] , [ios].[index_id] AS [Index ID] , [i].[name] AS [Index] , [ios].[leaf_insert_count] + [ios].[leaf_update_count] + [ios].[leaf_delete_count] + [ios].[leaf_ghost_count] AS [Modifications] FROM [sys].[dm_db_index_operational_stats](DB_ID(N'AdventureWorks2012'), OBJECT_ID(N'Sales.TestSalesOrderDetail'), NULL, NULL) AS [ios] JOIN [sys].[indexes] AS [i] ON [ios].[object_id] = [i].[object_id] AND [ios].[index_id] = [i].[index_id]; SELECT OBJECT_NAME([sp].[object_id]) AS [Table] , [sp].[stats_id] AS [StatisticID] , [s].[name] AS [Statistic] , [sp].[last_updated] AS [LastUpdated] , [sp].[rows] AS [Rows], [sp].[rows_sampled] AS [RowsSampled] , [sp].[unfiltered_rows] AS [UnfilteredRows], [sp].[modification_counter] AS [Modifications] FROM [sys].[dm_db_stats_properties] (OBJECT_ID(N'Sales.TestSalesOrderDetail'), 1) AS [sp] JOIN [sys].[stats] AS [s] ON [sp].[object_id] = [s].[object_id] AND [sp].[stats_id] = [s].[stats_id]; |
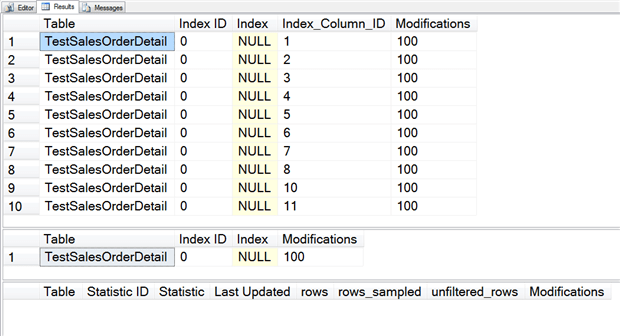
Listing 6: Querying row changes and statistics for Sales.TestSalesOrderDetail
Now, let’s create a clustered index, insert 100 more rows, then re-run the same three queries.
|
1 2 3 4 5 6 7 8 9 10 11 12 13 14 15 16 17 18 19 20 21 22 23 24 25 26 27 28 29 30 31 32 33 34 |
USE [AdventureWorks2012]; GO CREATE UNIQUE CLUSTERED INDEX CI_TestSalesOrderDetail ON [Sales].[TestSalesOrderDetail] ([SalesOrderID], [SalesOrderDetailID]); GO INSERT INTO [Sales].[TestSalesOrderDetail] ( [SalesOrderID] , [CarrierTrackingNumber] , [OrderQty] , [ProductID] , [SpecialOfferID] , [UnitPrice] , [UnitPriceDiscount] , [rowguid] , [ModifiedDate] ) SELECT TOP 100 [SalesOrderID] , [CarrierTrackingNumber] , [OrderQty] , [ProductID] , [SpecialOfferID] , [UnitPrice] , [UnitPriceDiscount] , [rowguid] , [ModifiedDate] FROM [Sales].[SalesOrderDetail]; GO CHECKPOINT; GO -- rerun Listing 6 |
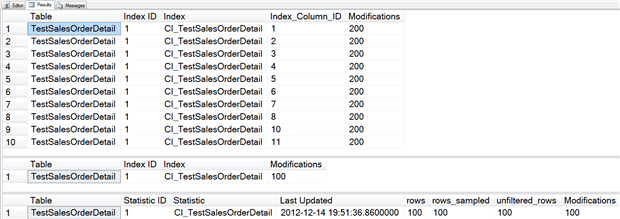
Listing 7: Create a clustered index on Sales.TestSalesOrderDetail and insert 100 more rows
First, notice that the Index ID value changed; in the original output from sys.system_internals_partition_columns it was 0, because the table was a heap. Now that it’s a clustered index, the Index ID is 1.
Second, notice that the output from sys.dm_db_index_operational_stats shows a value of 100 for modifications, but sys.system_internals_partition_columns shows a value of 200 for modifications. This is because even though the Index ID changed, the modification tracking was maintained in sys.system_internals_partition_columns. The output from sys.dm_db_index_operational_stats is the result of directly reading the data, and here we went from a heap to a clustered index, which caused the data to physically move.
Let’s see how the counters change when we selectively update columns.
|
1 2 3 4 5 6 7 8 9 10 11 12 |
USE [AdventureWorks2012]; GO UPDATE [Sales].[TestSalesOrderDetail] SET [orderqty] = 6 WHERE [SalesOrderID] = 43659 AND [SalesOrderDetailID] = 10; GO CHECKPOINT; GO -- rerun Listing 6 |
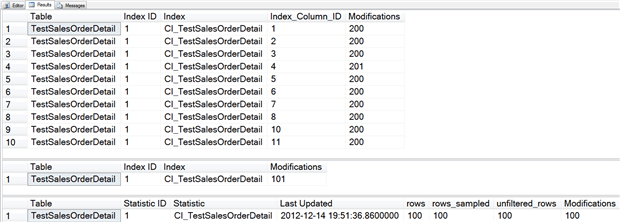
Listing 8: Update OrderQty for one row on Sales.TestSalesOrderDetail
In sys.system_internals_partition_columns the Modifications column (i.e. the modified_count counter) increased by one for Index_Column_ID 4. Likewise, in sys.dm_db_index_operational_stats, the modifications increased by one.
However, the modification_counter in sys.dm_db_stats_properties did not change. Let’s see what happens if we modify a column that’s in the clustering key.
|
1 2 3 4 5 6 7 8 9 10 11 12 |
USE [AdventureWorks2012]; GO UPDATE [Sales].[TestSalesOrderDetail] SET [SalesOrderID] = 93659 WHERE [SalesOrderID] = 43659 AND [SalesOrderDetailID] = 10; GO CHECKPOINT; GO -- rerun Listing 6 |
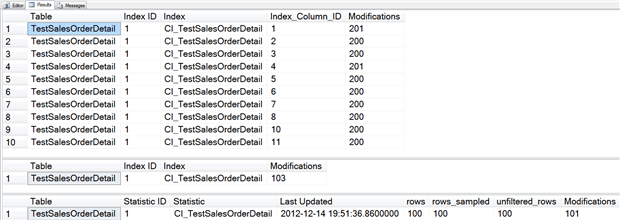
Listing 9: Update a clustered index key for one row in Sales.TestSalesOrderDetail
Now we see that the counter changed in sys.dm_db_stats_properties, as did the counter in sys.dm_db_index_operational_stats and the counter for Index_Column_ID 1 in sys.system_internals_partition_columns.
The counter in sys.dm_db_stats_properties will only change if the modification occurs for any column in the index key. If you look closely, you might notice that the modification counter in sys.dm_db_index_operational_stats jumped from 101 to 103 after this update, even though we only updated one row. If we split out the columns that we have been aggregating in sys.dm_db_index_operational_stats, as shown in Listing 10, we see that we have an insert and a ghost record.
|
1 2 3 4 5 6 7 8 9 10 11 12 13 14 15 16 17 18 19 20 21 22 23 24 25 26 27 |
USE [AdventureWorks2012]; GO SELECT OBJECT_NAME([ios].[object_id]) AS [Table] , [ios].[index_id] AS [Index ID] , [i].[name] AS [Index] , [ios].[leaf_insert_count] + [ios].[leaf_update_count] + [ios].[leaf_delete_count] + [ios].[leaf_ghost_count] AS [Modifications] FROM [sys].[dm_db_index_operational_stats](DB_ID(N'AdventureWorks2012'), OBJECT_ID(N'Sales.TestSalesOrderDetail'), NULL, NULL) AS [ios] JOIN [sys].[indexes] AS [i] ON [ios].[object_id] = [i].[object_id] AND [ios].[index_id] = [i].[index_id]; SELECT OBJECT_NAME([ios].[object_id]) AS [Table] , [ios].[index_id] AS [Index ID] , [i].[name] AS [Index] , [ios].[leaf_insert_count] AS [Leaf Level Insert] , [ios].[leaf_update_count] AS [Leaf Level Update] , [ios].[leaf_delete_count] AS [Leaf Level Delete] , [ios].[leaf_ghost_count] AS [Leaf Level Ghost] FROM [sys].[dm_db_index_operational_stats](DB_ID(N'AdventureWorks2012'), OBJECT_ID(N'Sales.TestSalesOrderDetail'), NULL, NULL) AS [ios] JOIN [sys].[indexes] AS [i] ON [ios].[object_id] = [i].[object_id] AND [ios].[index_id] = [i].[index_id]; |

Listing 10: Splitting out leaf level updates, deletes and ghosts
A ghost record is one that is marked as deleted but has yet to be removed. Once the ghost cleanup process removes it, the count will decrease by one, and the leaf level delete column will increase. This occurs because we modified the cluster key, and even though it was an update of the column, because it is part of the index key, it is actually a delete and an insert. Paul Randal demonstrates this in detail in his post, Do changes to index keys really do in-place updates?, and I talk about this further in my post, SQL University – Internals and Updates.
The important point is that sys.system_internals_partition_columns,sys.dm_db_index_operational_stats, and sys.dm_db_stats_properties track modifications differently. If you plan to use any of these to track modifications for a statistic, and then make a decision to update a statistic, or not, based on the number of modifications, it is critical that you understand the differences.
Within sys.dm_db_index_operational_stats, SQL Server tracks all modifications for a table, regardless of the column modified. Updates of columns in the key will show up twice if you are aggregating all the leaf level counters, which will inflate the modification counter.
Within sys.dm_db_stats_properties, SQL Server tracks only changes to columns in the key. It will not track any changes to columns that are not in the key, even for a clustered index. However, for purposes of statistics, this is acceptable, as the query optimizer is using the statistic specific to a column or set of columns. Changes to column 3 do not in any way affect a statistic for columns 1 and 2.
Note that updating a statistic will not reset counters in sys.dm_db_index_operational_stats, but will reset the modification_counter in sys.dm_db_stats_properties, as demonstrated in Listing 11.
|
1 2 3 4 5 6 7 8 9 10 11 12 13 14 15 16 17 18 19 20 21 22 23 24 25 26 27 28 29 30 |
USE [AdventureWorks2012]; GO UPDATE STATISTICS [Sales].[TestSalesOrderDetail] CI_TestSalesOrderDetail WITH FULLSCAN; GO SELECT OBJECT_NAME([ios].[object_id]) AS "Table" , [ios].[index_id] AS "Index ID" , [i].[name] AS "Index" , [ios].[leaf_insert_count] + [ios].[leaf_update_count] + [ios].[leaf_delete_count] + [ios].[leaf_ghost_count] AS "Modifications" FROM [sys].[dm_db_index_operational_stats](DB_ID(N'AdventureWorks2012'), OBJECT_ID(N'Sales.TestSalesOrderDetail'), NULL, NULL) AS [ios] JOIN [sys].[indexes] AS [i] ON [ios].[object_id] = [i].[object_id] AND [ios].[index_id] = [i].[index_id]; SELECT OBJECT_NAME([sp].[object_id]) AS "Table" , [sp].[stats_id] AS "Statistic ID" , [s].[name] AS "Statistic" , [sp].[last_updated] AS "Last Updated" , [sp].[rows] , [sp].[rows_sampled] , [sp].[unfiltered_rows] , [sp].[modification_counter] AS "Modifications" FROM [sys].[dm_db_stats_properties](OBJECT_ID(N'Sales.TestSalesOrderDetail'), 1) AS [sp] JOIN [sys].[stats] AS [s] ON [sp].[object_id] = [s].[object_id] AND [sp].[stats_id] = [s].[stats_id]; |

Listing 11: Effect on modification counters of updating statistics
Rebuilding a clustered index will reset the counters in both sys.dm_db_index_operational_stats and sys.dm_db_stats_properties.
|
1 2 3 4 5 |
USE [AdventureWorks2012]; GO ALTER INDEX ALL ON [Sales].[TestSalesOrderDetail] REBUILD; GO |
Listing 12: Rebuilding the clustered index resets all row modification counters
Tracking modifications for a statistic is very easy using sys.dm_db_stats_properties, and is the route I recommend if you’re using SQL Server 2008R2 SP2 or SQL Server 2012 SP1.
How you can start measuring rate of modification
In my previous post about this DMV, New Statistics DMF in SQL Server 2008R2 SP2, I included a query that could be used to list statistics information, including modifications, for all statistics in a database. Listing 13 shows two variations of the query; the first returns information for all statistics which exist for user objects, and output is ordered with the oldest statistics first. The second query lists statistics that have had greater than 10% of the total number of rows modified (based on the modification_counter). Adjust this threshold to find tables more frequently updated (e.g. 5% of rows modified).
|
1 2 3 4 5 6 7 8 9 10 11 12 13 14 15 16 17 18 19 20 21 22 23 24 25 26 27 28 29 30 31 32 33 34 35 36 37 38 39 40 41 42 43 44 45 46 47 48 49 50 51 52 |
USE [AdventureWorks2012]; GO -- all statistics, ordered by update_date descending SELECT [sch].[name] + '.' + [so].[name] AS [TableName] , [ss].[name] AS [Statistic] , [ss].[auto_Created] AS [WasAutoCreated] , [ss].[user_created] AS [WasUserCreated] , [ss].[has_filter] AS [IsFiltered] , [ss].[filter_definition] AS [FilterDefinition] , [ss].[is_temporary] AS [IsTemporary], [sp].[last_updated] AS [StatsLastUpdated], [sp].[rows] AS [RowsInTable], [sp].[rows_sampled] AS [RowsSampled], [sp].[unfiltered_rows] AS [UnfilteredRows], [sp].[modification_counter] AS [RowModifications], [sp].[steps] AS [HistogramSteps] FROM [sys].[stats] [ss] JOIN [sys].[objects] [so] ON [ss].[object_id] = [so].[object_id] JOIN [sys].[schemas] [sch] ON [so].[schema_id] = [sch].[schema_id] OUTER APPLY [sys].[dm_db_stats_properties] ([so].[object_id],[ss].[stats_id]) sp WHERE [so].[type] = 'U' ORDER BY [sp].[last_updated] DESC; -- statistics with more than 10% change SELECT [sch].[name] + '.' + [so].[name] AS [TableName], [ss].[name] AS [Statistic], [ss].[auto_Created] AS [WasAutoCreated], [ss].[user_created] AS [WasUserCreated], [ss].[has_filter] AS [IsFiltered], [ss].[filter_definition] AS [FilterDefinition], [ss].[is_temporary] AS [IsTemporary], [sp].[last_updated] AS [StatsLastUpdated], [sp].[rows] AS [RowsInTable], [sp].[rows_sampled] AS [RowsSampled], [sp].[unfiltered_rows] AS [UnfilteredRows], [sp].[modification_counter] AS [RowModifications], [sp].[steps] AS [HistogramSteps], CAST(100 * [sp].[modification_counter] / [sp].[rows] AS DECIMAL(18,2)) AS [PercentChange] FROM [sys].[stats] [ss] JOIN [sys].[objects] [so] ON [ss].[object_id] = [so].[object_id] JOIN [sys].[schemas] [sch] ON [so].[schema_id] = [sch].[schema_id] OUTER APPLY [sys].[dm_db_stats_properties] ([so].[object_id], [ss].[stats_id]) sp WHERE [so].[type] = 'U' AND CAST(100 * [sp].[modification_counter] / [sp].[rows] AS DECIMAL(18,2)) >= 10.00 ORDER BY CAST(100 * [sp].[modification_counter] / [sp].[rows] AS DECIMAL(18,2)) DESC; |
Listing 13: Statistics information, including modifications, for all statistics in a database
Whether you’re looking for statistics with the highest number of modifications, the largest percentage of modifications (modification_counter/rows), or simply those that have not been updated in a while, the sys.dm_db_stats_properties can be used to simplify this data collection and better automate your analysis.
Summary
Statistics play a vital role in performance and the introduction of the sys.dm_db_stats_properties DMF gives DBAs an easy way to capture additional information about database statistics. While many systems rely on SQL Server to automatically update statistics, and consistently perform well, exceptions such as large tables that don’t update frequently, tables with uneven data distributions, tables with ever-increasing keys, and tables which have significant changes in distribution often require manual updates. Tracking modifications for those tables and then updating statistics when the modifications reach a specific threshold can prevent performance problems from occurring, and reduce the manual effort required by the Database Administrator to manage statistics.
Load comments