
This article is the fourth in a series about the SQL Server Analysis Services (SSAS) tabular model. In the first three articles (one | two | three), we’ve covered the basic components that make up a SQL Server 2012 tabular database and examined how to create Data Analysis Expressions (DAX) queries to access data in those databases. We also looked at how to use SQL Server Management Studio (SSMS) and Microsoft Excel to create DAX queries that retrieve data from an SSAS tabular instance.
In this article, we move onto a new client application: SQL Server Reporting Services (SSRS). You’ll learn how to incorporate DAX into an SSRS report to return and display tabular data. However, as the previous articles illustrate, using DAX is not always a straightforward process. The Report Designer interface makes it easy enough to use Multidimensional Expressions (MDX) statements in your reports, but not so with DAX. In fact, you’ll find little indication, if any, that you can use DAX. But you can, and knowing how to do so is essential if you’re working with a tabular database configured in DirectQuery mode, which accepts DAX queries but not MDX.
This article walks you through the process of creating an SSRS report that uses DAX to retrieve tabular data from the AdventureWorks Tabular Model SQL 2012 database, available as a SQL Server Data Tools (SSDT) tabular project from the AdventureWorks CodePlex site. On my system, I’ve downloaded the project and used it to implement the database on a local instance of SSAS 2012 in tabular mode. To follow along in this article, you should already have a basic understanding of how to create an SSRS report and write a DAX query.
Creating a DAX-Based Dataset
The key to using DAX to access tabular data from within an SSRS report is to create a dataset that includes a DAX query. However, before we get into that, we first need to create an SSRS project in SQL Server Data Tools (SSDT) and then add a data source to our initial report. For this exercise, we’ll be embedding the data source (and subsequently the dataset) directly into the report, as opposed to creating either a shared data source or dataset, but feel free to take whichever approach you like.
If necessary create an SSRS project in SSDT and then create a report. To add an embedded data source to the report, right-click the Data Source node in the Report Data window and click Add Data Source. When the Data Source Properties dialog box appears, provide a name. (I used AWtabular.) Next, select Microsoft SQL Server Analysis Services from the Type drop-down list, and then provide a connection string that specifies the SSAS tabular instance and the name of the tabular database, as shown in Figure 1.
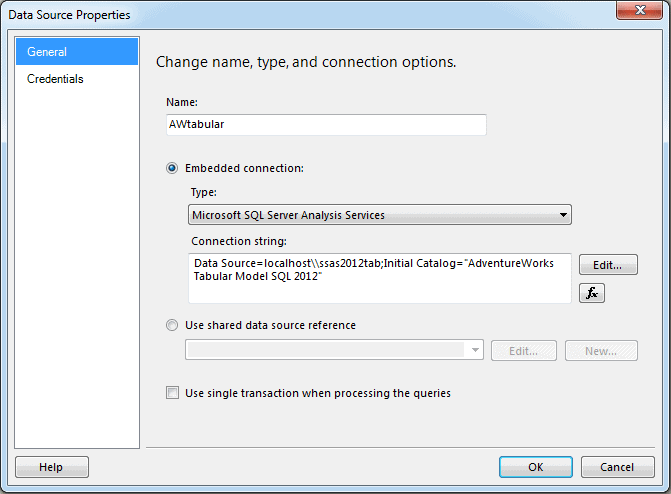
Figure 1: Connecting to an SSAS tabular data source
In this case, I’m connecting to the ssas2012tab instance on my local system, with the initial catalog set to AdventureWorks Tabular Model SQL 2012. I’ve included the connection string here as well in case you want to copy it or have trouble reading it within the figure:
Data Source=localhost\\ssas2012tab;Initial Catalog="AdventureWorks Tabular Model SQL 2012"
Instead of manually typing the connection string, you can let SSRS define it. Click the Edit button in the Data Sources Properties dialog box. This launches the Connection Properties dialog box, shown in Figure 2. Here you enter the instance name and select the target database. When you finish, click OK. SSRS will automatically generate the connection string and insert it into the Connection string text box in the Data Sources Properties dialog box.
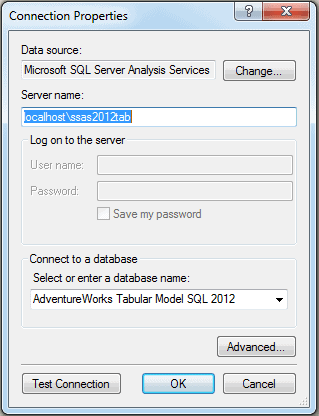
Figure 2: Defining a connection string for an SSAS data source
After we add our data source, we can create the dataset. In the Report Data window, right-click the Datasets node and then click Add Dataset. When the Dataset Properties dialog box appears, type in a name for the data source. (I used ProductInfo.) Next, select the option Use a dataset embedded in my report, and then select your data source from the Data source drop-down list, as shown in Figure 3.
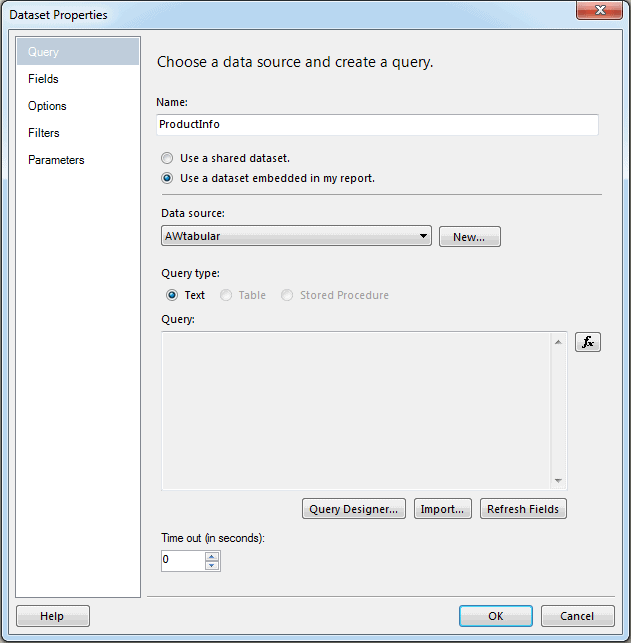
Figure 3: Configuring a dataset based on SSAS tabular data
The next step is to define your DAX query. The query goes into the Query text box; however, you cannot add the query directly to the text box. You must use the Query Designer tool. To access that tool, click the Query Designer button to launch the Query Designer window, shown in Figure 4.
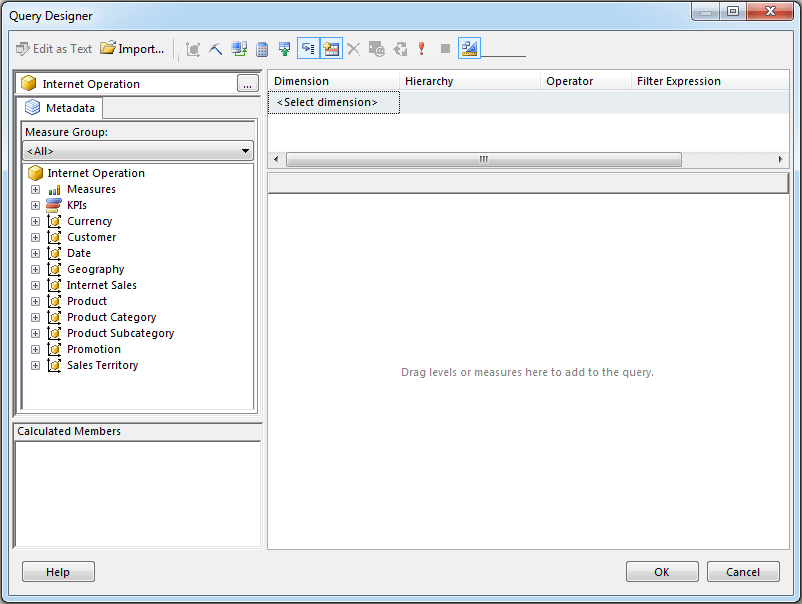
Figure 4: Accessing Query Designer when defining a dataset
By default, the Query Designer window lets you create an MDX query that you can use to retrieve data from your data source. However, we’re not interested in MDX this time around, and we can’t use this window in its present state to create a DAX query. Instead, we must change to the mode used for the Data Mining Extensions (DMX) language, which lets you create and work with data mining models in SSAS. We won’t be writing DMX expressions, though, but we can use the DMX mode to write our DAX queries. So click the Command Type DMX button on the menu bar. When you do, you’ll receive the message shown in Figure 5.
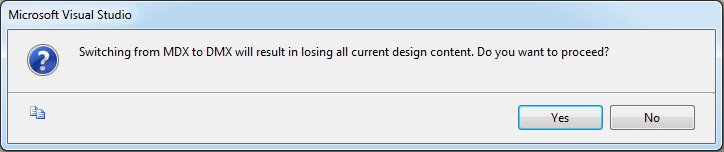
Figure 5: Receiving a warning about switching from MDX to DMX
You don’t need to worry about this message for what we’re doing here. Simply click Yes and you’ll be taken to DMX mode. Once in that mode, you’ll then have to switch to Design mode. To do so, click the Design Mode button on the menu bar. You can then add your DAX query in the bottom window, as shown in Figure 6.
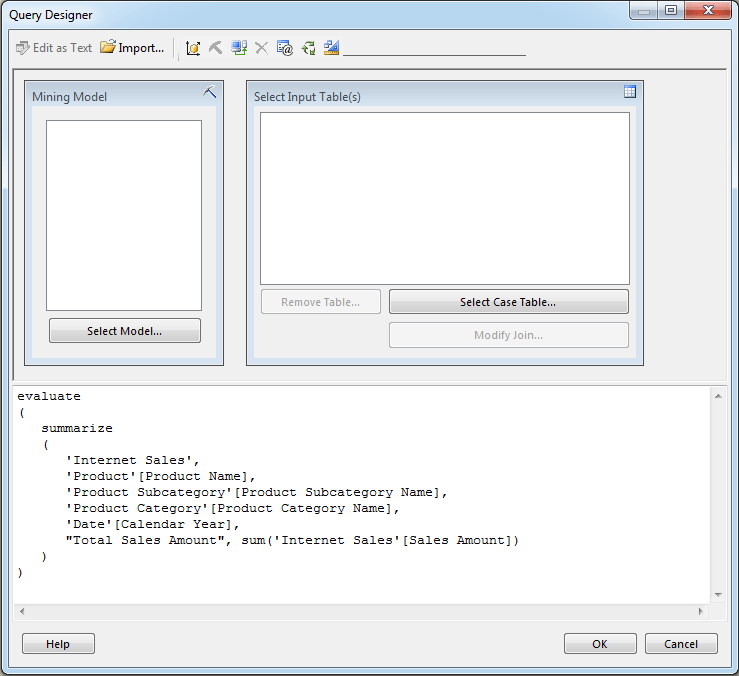
Figure 6: Adding a DAX statement to Query Designer in DMX mode
That’s all you need to do to add your DAX statement. It’s a bit of a convoluted process, but not too bad. Should you want to copy and paste the statement, I’ve included it here as well:
|
1 2 3 4 5 6 7 8 9 10 11 12 |
evaluate ( summarize ( 'Internet Sales', 'Product'[Product Name], 'Product Subcategory'[Product Subcategory Name], 'Product Category'[Product Category Name], 'Date'[Calendar Year], "Total Sales Amount", sum('Internet Sales'[Sales Amount]) ) ) |
Essentially, we’re retrieving sales information about the various products sold via the Internet. For information about how the statement works, refer back to the second article in this series, “Using DAX to retrieve tabular data,” which explains the various components.
Once you’ve added your DAX query to the Query Designer window, click OK to return to the Dataset Properties dialog box. If there’s a problem with the query, you’ll receive an error message, though it won’t provide many details. I find it easier to write my queries in SSMS and then paste them into the other applications. However, even SSMS has limited support for writing DAX queries.
When you’re returned to the Dataset Properties dialog box, you should find that all your settings on the Query page are now complete, as shown in Figure 7. Notice that the DAX query is now inserted in the Query text box.
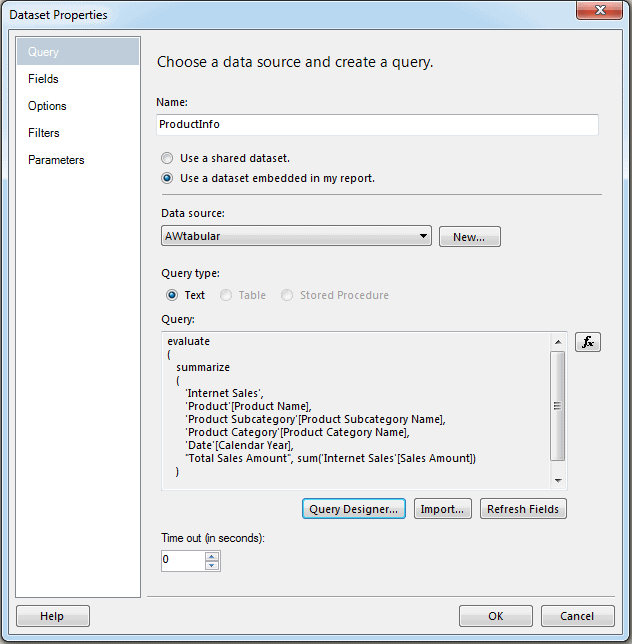
Figure 7: Setting up a dataset based on an SSAS tabular data source
At this point, you can go to the Fields page to verify and modify your field names, as shown in Figure 8. Each column returned by your query should be listed on this page. In this case, I’ve changed the outputted field names so they’re simpler to work with. For example, Product[Product Name] is now simply Product. The outputted field names are the ones you’ll be working with when you create your report.
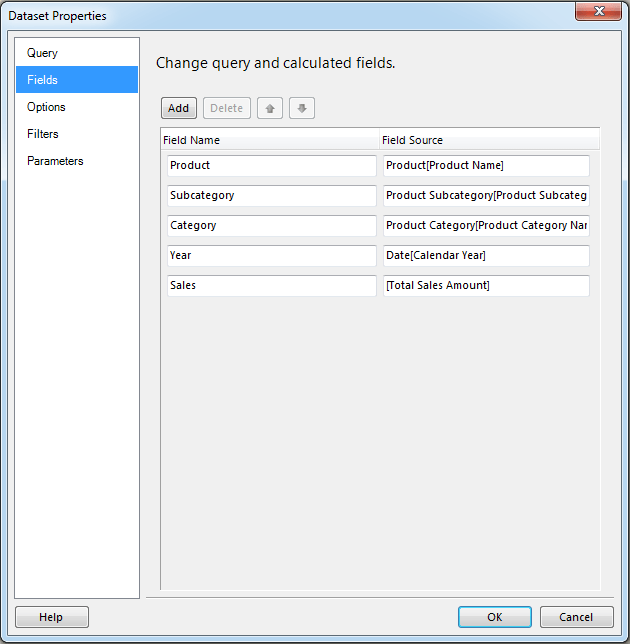
Figure 8: Modifying the field names in your dataset
That’s all we need to do to set up our dataset to use DAX to retrieve tabular data. We can now create our report and use the fields in our dataset to populate the various components. However, describing how to create a report in SSRS is beyond the scope of this article, although Figure 9 shows you the matrix I created in Report Designer on my system.
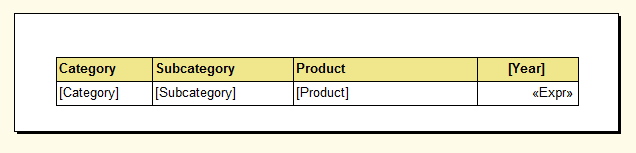
Figure 9: Defining a matrix in Report Designer<
Essentially, I added a Matrix object by dragging it from the Toolbox to the design surface. I then added the fields, as shown in the figure. It’s all fairly straightforward, except the <<Expr>> placeholder. For this, I defined the following expression:
=FormatCurrency(Fields!Sales.Value, 2)
All I’m doing here is formatting the Sales field to be displayed as currency, with two digits to the right of the decimal point. Figure 10 shows what the report looks like when I view it in the previewer available to Report Designer in SSDT.
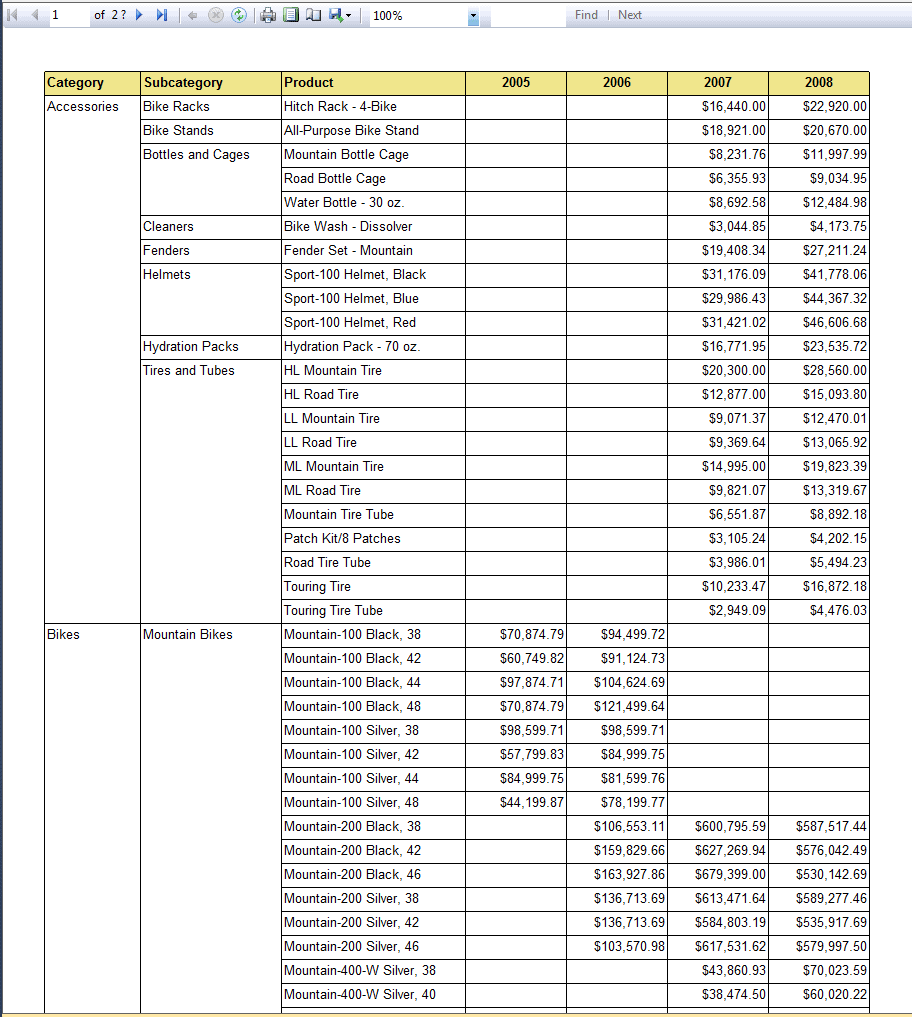
Figure 10: Previewing your report from Report Designer
The figure shows only part of the results returned by the report, but as you can see, I’ve grouped the data first by category, then subcategory, and finally product. I’ve then provided each year’s worth of sales for the individual products.
Adding Parameters to DAX
Undoubtedly, the report shown above is a very basic one. But it does demonstrate how to use DAX to retrieve tabular data. However, there’s more you can do with DAX: add parameters to your queries.
In SSRS, it’s not uncommon to include parameters when defining a dataset. Even a dataset based on a DAX query might benefit from a parameter or two, depending on the type of information being retrieved. For example, suppose in the report above we want users to be able to view the amount of sales for each product within a specific product category. In this case, we can add a parameter based on the Product Category Name column in the Product Category table. (In our dataset’s output fields, we’ve renamed this column Category, which you can see if you refer back to Figure 8.)
To add the parameter, we must first modify our DAX query, as shown in the following evaluate statement:
|
1 2 3 4 5 6 7 8 9 10 11 12 13 14 15 |
evaluate ( summarize ( calculatetable ( 'Internet Sales', 'Product Category'[Product Category Name] = @Category ), 'Product'[Product Name], 'Product Subcategory'[Product Subcategory Name], 'Date'[Calendar Year], "Total Sales Amount", sum('Internet Sales'[Sales Amount]) ) ) |
Originally, the first argument in our summarize function was the Internet Sales table. But we’ve now replaced the table name with a table expression that consists of the calculatetable function and it’s two arguments. In DAX, the calculatetable function applies one or more filters against a specified table. In this case, the function is applying one filter (the second argument) against the Internet Sales table (the first argument). The filter specifies that, for each row returned by the calculatetable function, the Product Category Name value must equal the value specified in the @Category parameter.
We can give our parameter any SSRS-supported name, as long as we precede it with the at (@) symbol in our DAX statement. The key is to use the same capitalization we use here in any subsequent references within the Report Designer interface. You’ll run into errors if your capitalization doesn’t match. In other words, @Category is not equal to @category when building a report.
One other change this DAX statement makes is to remove the Product Category Name column from the results. Because we’re filtering by the category name, we don’t need to include that name in the report data because all values would be the same.
To make these changes to your DAX statement, launch the Query Designer window from the Dataset Properties dialog box associated with your dataset, and then update the statement, as shown in Figure 11. But don’t click OK yet because we need to take another step.
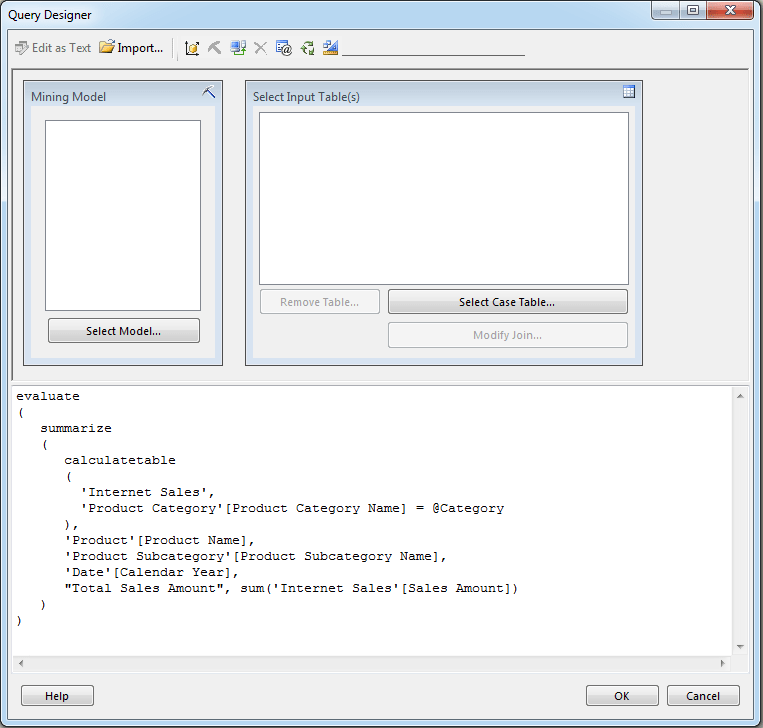
Figure 11: Adding a parameter to your DAX query
Once you’ve updated your query and added the @Category parameter, click the Query Parametersbutton in the menu bar to launch the Query Parameters dialog box. In the first row of the grid, type the name of the parameter (without the @ symbol) in the Parameter column, and type an initial value in the Value column, as shown in Figure 12. This value should be an actual value within that column, or your initial report will show no results. For this exercise, I’ve used Clothing.
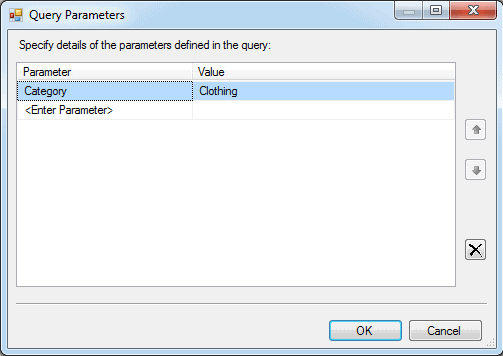
Figure 12: Adding a parameter to your SSRS report
Once you’ve added your parameter and its value, click OK to close the Query Parametersdialog box, then click OK to close the Query Designerwindow, and finally click OK to close the Dataset Properties dialog box.
The next step is to define a dataset that will supply a list of product categories to our parameter when the report is rendered. Follow the steps described in the previous section to create the dataset. However, this time around, we’ll name the dataset Categories and use the following DAX query to retrieve our data:
|
1 2 3 |
evaluate values('Product Category'[Product Category Name]) order by 'Product Category'[Product Category Name] |
Because we’re retrieving our data from a single column, we can use the values function as our table expression in the evaluate function. The values function returns a one-column table that contains distinct values from the specified column, in this case, Product Category Name. Our DAX statement also includes an order by clause that sorts our results in ascending order. TheDataset Properties dialog box for the new dataset should now look similar to the one shown in Figure 13.
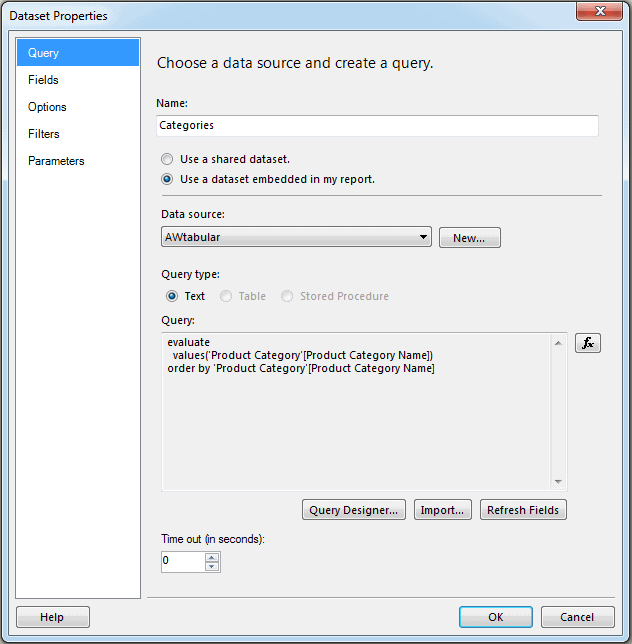
Figure 13: Setting up a dataset to provide parameter values
To finish setting up your dataset, go to the Fields page and change the field name to Category. Then click OK .
Once we’ve created the dataset for our parameter, we must now associate that dataset with the parameter. To do so, expand the Parameters node in the Report Data window. TheCategory parameter should be listed. Double-click the parameter to launch the Report Parameter Properties dialog box, as shown in Figure 14.
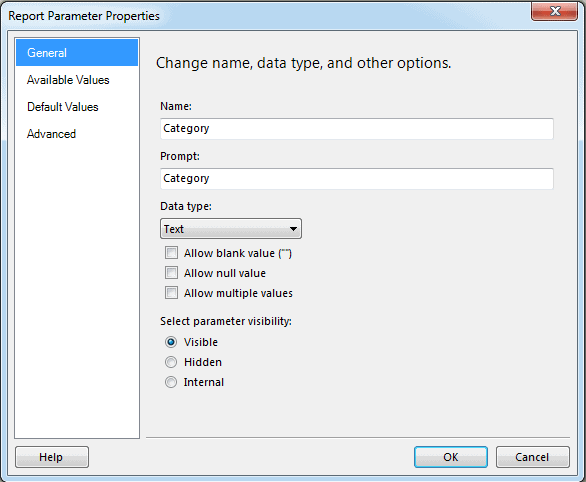
Figure 14: Configuring your parameter’s properties
Go to the Available Values page and select the option Get values from< a query. From theDataset drop-down list, select Categories; from the Value field drop-down list, select Category; and from the Label field drop-down list, select Category. The Available Values page should now look like the one shown in Figure 15.
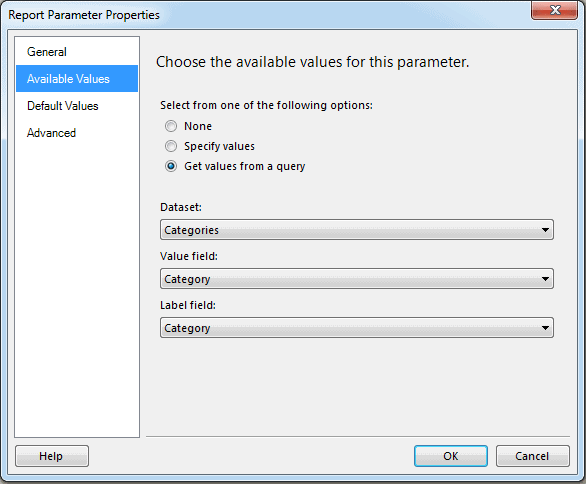
Figure 15: Retrieving your parameter values from the dataset
If you like, you can go to the Default Values page and change the default value. Figure 16 shows how it is currently configured, with Clothing specified as the default value. However, you can change this if you want no default value specified or want to retrieve values from a dataset. For now, the current setting is fine, so click OK to close the Report Parameters roperties dialog box.
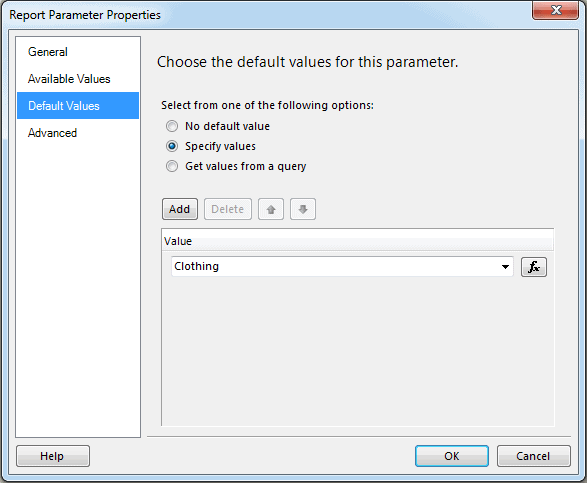
Figure 16: Confirming your parameter’s default value
Because we removed the Category field from our dataset, we need to modify the matrix on the design surface. Figure 17 shows the modifications I made on my system. All I did was remove the Category column, which included the header and the column reference. (Refer back to Figure 9 to see the original.)
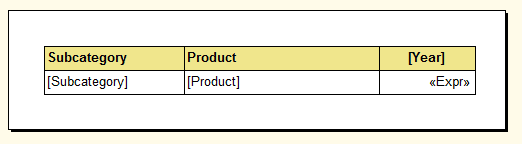
Figure 17: Defining a matrix in Report Designer
When we preview our report now, we’ll be presented with the Category drop-down list, as shown in Figure 17. By default, Clothing is selected from the list, and all the information displayed in the report is specific to that product category. As you can see in the figure, SSRS displays only columns for which there is sales data. Because there were no sales in the Clothing category for 2005 and 2006, those columns are not displayed.
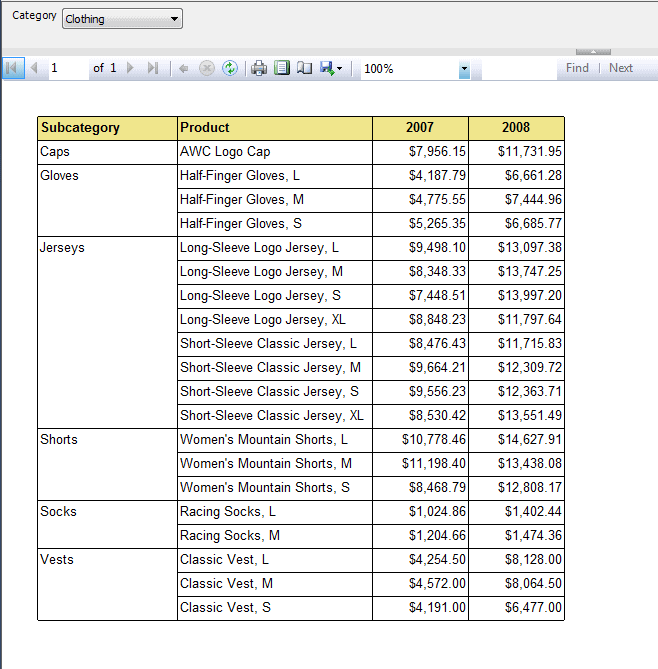
Figure 18: Viewing sales for the Clothing product category
The report also no longer includes a Category column. Because Clothing is selected in the Category drop-down list, we know that all the sales data in this report applies to that product category. If we were to select a different product category, the data would change accordingly. For example, Figure 19 shows part of the results returned when the Bikes category is selected. In this case, sales occurred in all four years, so sales data is available for all those years.
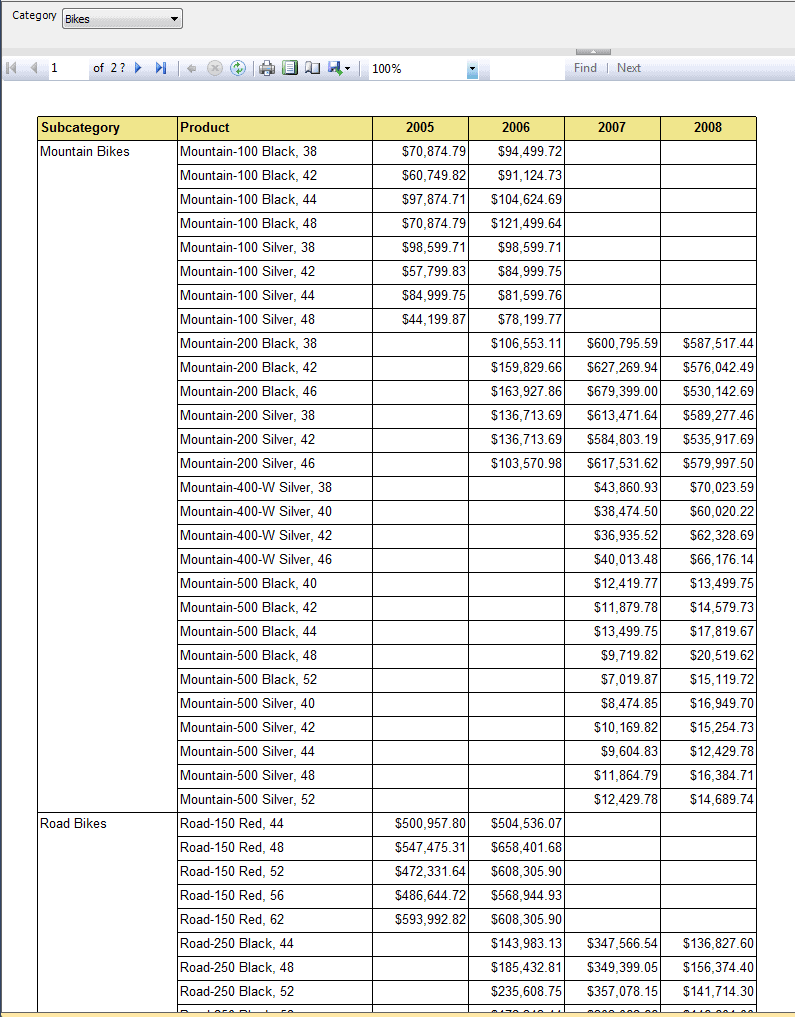
Figure 19: Previewing your report from Report Designer
You can just as easily view data for the other categories, assuming data exists. If it doesn’t, no report will be displayed. For example, you’ll find in the Category drop-down list the option Components. If you select this category and then try to view a report, no data will be returned. That’s because no Internet sales are associated with that category.
DAX and SSRS
As you can see, it’s quite possible to use DAX within your SSRS reports to retrieve tabular data. The process might seem a bit unusual, but once you know the trick, it’s easy enough to achieve. Even adding parameters to your DAX queries is a fairly straightforward process. But the method we used here for adding parameters works only if you want to base your results on one value at a time. If, for example, you want to modify the report above to be able to display data about multiple product categories at the same time, you would have to take a different approach to including a parameter, one a bit more complicated that what we’ve done (and beyond the scope of this article).
Microsoft has been a bit slow in fully supporting DAX, despite the prominent role that DAX plays in the company’s business intelligence (BI) offerings. Excel, SSRS, and SSMS are all limited in their support for DAX when retrieving data from a SSAS tabular instance. In fact, you can’t even use DAX in Report Builder. Given these limitations, it might seem surprising that an SSAS tabular database can be configured in DirectQuery mode, which supports only DAX queries. Still, you now have some workarounds for working with DAX in a variety of environment, including your SSRS reports.
This document contains proprietary information and is protected by copyright law.
Copyright © 2026 Red Gate Software Limited. All rights reserved


Load comments